 Journal of Global Positioning Systems (2002) Vol. 1, No. 2: 85-95 GPS Attitude Determination Reliability Performance Improvement Using Low Cost Receivers Chaochao Wang and Gérard Lachapelle Department of Geomatics Engineering, University of Calgary Received: 13 October 2002 / Accepted: 4 December 2002 Abstract. This paper describes different methods to improve reliability of attitude estimation using low cost GPS receivers. Previous work has shown that low cost receiver attitude determination systems are more susceptible to measurement errors, such as multipath, phase center offsets, and cycle slips. In some cases, these error sources lead to severely erroneous attitude estimates and/or to a lower availability. The reliability control in the attitude determination becomes imperative to users, as most attitude applications require a high level of reliability. The three methods tested herein to improve reliability are the use of a high data rate, fixed angular constraints, and a quality control algorithm implemented with a Kalman filter. The use of high rate measurements improves error detection as well as ambiguity fixing time. Fixed angular constraints in a multi-antenna attitude system is effective to reject incorrect solutions during the ambiguity resolution phase of the process. Utilizing a Kalman filter with a high data rate, e.g. 10 Hz, not only increases reliability through an increase of information, but also can improve accuracy and availability. The simultaneous utilization of the above methods significantly improves reliability, as demonstrated through a series of hardware simulations and field tests. The low cost receiver type selected is the CMC Allstar receiver equipped with a commercially available low cost antenna. Finally, the use of statistically reliability measures, namely internal and external reliability measures, shows the inherent limitations of a low cost system and the need to either use better antennas and/or external aiding in the form of low cost sensors. Key words: GPS, Attitude Determination, Low Cost Receiver 1 Introduction Multi-antenna GPS systems provide a high accuracy attitude solution without error drift over time [e.g., Lu 1994]. The performance of GPS attitude determination is a function of receiver firmware, satellite geometry, antenna carrier phase stability, multipath rejection ability and inter-antenna distances. With advances in GPS receiver technology, low cost receivers equipped with phase lock loops that output precisely time-synchronized carrier phase measurements are now available on the market. The use of this grade of GPS receiver for attitude determination has proven feasible [e.g., Hoyle et al. 2002]. However, it has been found that multipath, antenna phase center offsets and cycle slips are major error sources that mitigate the performance of low cost receiver attitude solutions. In worst-case scenarios, these errors severely affect the integrated carrier phase measurements and lead to incorrect attitude estimates in attitude determination. Therefore, the reliability of attitude estimation becomes a major issue. The objective of this paper is to investigate three methodologies to improve the reliability performance of attitude determination using low cost receivers. Three different schemes, namely the use of high rate carrier phase measurements, fixed angular constraints and a Kalman filter with a statistical quality control system, are used interactively to improve reliability. These schemes are implemented in a high performance, open architecture attitude determination software, namely HEADRT+TM, for testing [e.g. Hoyle et al 2002]. The performances of different methods are examined both in hardware simulation mode and under field static and kinematic conditions.  86 Journal of Global Positioning Systems 2 GPS Attitude Determination Because of the short inter-antenna distance (generally less than 20 m), the spatially correlated orbital and atmospheric errors virtually cancel out from the equation. The errors sources remaining here are only multipath, antenna phase center offsets and carrier receiver noise, provided that the double difference integer ambiguities are correctly solved. By definition, attitude is the rotation of a specific frame with respect to a reference frame, which is well defined in space. In the case of a multi-antenna system, this specific frame is usually referred to as the antenna body frame, while the local level frame is selected as the reference frame. Once the antenna vector in the local level frame is precisely determined, the three Euler attitude angles in the rotation matrix can be estimated using Equation 1. 3 Reliability Problems Using Low Cost Receivers = ll ll ll b b b z y x hRpRrR z y x )()()( 312 (1) where h, p, r denote heading, pitch and roll x, y, z are the coordinates of the antenna vector superscript b represents the body frame superscript ll stands for the local level frame The GPS receivers determine the inter-antenna vectors firstly in a Conventional Terrestrial frame, namely WGS- 84. The carrier phase measurements have to be used as observables in this application since the attitude determination system requires high precision relative positioning between the antennas. In the general case that independent (non-dedicated} receivers are used and each receiver has a separate oscillator, the double differencing combinations are formed so that not only the clock errors but also the line biases caused by the different cable lengths can be removed. Without clock and line bias errors, the carrier phase double difference observation equation is expressed as tropion dddN ∆∇+∆∇−∆∇+∆∇+∆∇=∆Φ∇ ρλρ rxmulti εε ∆∇+∆∇+ ant ε ∆∇+ (2) Previous research has shown the advantages and limitations of using low cost receivers such as the CMC Electronic Allstar, for attitude determination [e.g, Hoyle et al 2002]. Without multipath and antenna impact, this receiver type can achieve attitude estimation performance comparable with high quality/high cost units during hardware simulation testing. This is because, under hardware simulation conditions, error sources can be separated. No multipath or antenna phase centre errors need to be introduced, thereby allowing a performance analysis of the receiver noise and tracking loops. Under field conditions, the low cost receiver is more likely to suffer from carrier phase multipath and antenna phase instabilities. In practice each of these two error sources range from a few mm to 1 cm (although higher values are possible). In some severe cases, the two error sources, coupled with cycle slips, significantly deteriorate the carrier phase measurements and the wrong double difference ambiguities could be produced from the ambiguity resolution. The incorrect ambiguities eventually lead to the erroneous attitude estimates, which impair the reliability of the whole attitude determination system. In order to improve the overall attitude performance, some measures should be taken to enhance the reliability of attitude determination using low cost receivers. 4 Attitude Determination Algorithm where: ∆∇ represents the double difference operator In the HEADRT+TM software, the attitude determination estimation process is carried out in two phases. The first phase determines the correct double difference carrier phase ambiguities for the antenna vector(s). After the coordinate transformation from WGS-84 into the local level frame, the attitude parameters are estimated from the vector components with corresponding variance- covariance matrix in the second phase [e.g. Lu 1994]. ∆Φ∇ is the double difference carrier phase measurement ρ ∆∇ is the double difference range N∆∇ is the double difference integer ambiguity λ is the carrier wavelength (m) ρ d∆∇ is the orbital error tropion dd ∆∇∆∇ , are the errors due to the ionospheric delay and tropospheric delay The ambiguity resolution used in the software is based on the Least Squares Ambiguity Search Technique (LSAST) [Hatch 1991]. This method has the advantages of a small number of candidate ambiguity combinations and high computational efficiency. Given that the vector lengths are small, this technique is effective for this purpose. The ambiguity search region is defined as a sphere with the multi ε ∆∇ is the double difference multipath error rx ε ∆∇ is the double difference carrier phase error due to the receiver noise ant ε ∆∇ is the double difference antenna phase center offset  Wang and Lachapelle: GPS Attitude Determination Using Low Cost Receivers 87 radius of the inter-antenna distance(s). After forming all possible ambiguity combinations, different discrimination tests are conducted to isolate the correct ambiguity set using the fixed antenna distance(s) and some other statistical properties [e.g., Hoyle et al. 2002]. Two statistical tests are involved in the ambiguity resolution, namely the ratio test and the Chi-square test. The underlying assumption of a ratio test is that the residuals of the correct ambiguities should be significantly smaller than those of the incorrect ones. Only if the ratio of the two smallest residual quadratic forms is greater than a preset threshold (normally 2.5 to 4), is the potential ambiguity set with the smallest quadratic form accepted as the correct ambiguity set. For true ambiguities, it is assumed that the double difference residuals are normally distributed, and the sum of the quadratic forms follows the Chi-square distribution, with the degree of freedom being the redundant measurement number. Therefore, a Chi-square test based on the residuals is conducted to verify the double difference ambiguities in the software. Once the inter-antenna vector ambiguities are fixed, the inter-antenna vector components are transformed from WGS-84 earth-fixed frame into local level coordinates and the attitude parameters are computed from an implicit least squares estimation. Currently, no dynamic constraints of the platforms are implemented in the filtering process to permit an epoch-by-epoch assessment of attitude estimation under any dynamics, subject to the availability of unbiased receiver carrier phase). 5 High Data Rate As the CMC Allstar receiver can output raw time synchronized carrier phase measurements up to 10 Hz, it allows for high data rate processing in HEADRT+TM, both for ambiguity resolution and attitude estimation. The higher data rate can benefit the ambiguity resolution process due to the high availability of phase measurements. Also, platform dynamics can be predicted for short time intervals in many applications and outlier estimation in the antenna vector lengths can be easily detected and further rejected using filtering of the high rate measurements. In this section, only the effect of the high data rate on ambiguity resolution will be investigated. The impact of the high data rate on Kalman filter estimation will be discussed in the sequel. In order to evaluate the performance of ambiguity resolution, the time to fixed ambiguities is utilized. In this test, two receivers were used, both for the hardware simulator and field test. In the latter case, two AT575-104 low cost antennas were used. The hardware simulation test was done using a Spirent STR-4760 simulator. As no errors were simulated, the only remaining error present was receiver measurement noise. The field test was conducted on the roof of Engineering building at the University of Calgary. The inter-antenna distances were about 1 m in both tests. The data was collected at a 10-Hz rate. The double difference ambiguities were intentionally reset every 120 seconds during the data processing to gather enough trials for a meaningful analysis. The Minimum Time To Ambiguity Fix (MTTAF) was set to 1 epoch and the fixing ratio was set to 3 in HEADRT+TM. 0 20 40 60 80 100 <0.1<1<5<10 <20>20 Ambiguity Fixing Time(Seconds) Percentage(%) 0 20 40 60 80 100 Cumulative Percent(%) 10Hz Data1Hz Data Fig. 1 Time to Fix Ambiguity in hardware simulation Fig. 1 shows the ambiguity fixing times for the case of the hardware simulation test. Without multipath and antenna phase center offset, the integer ambiguities were successfully determined within a single epoch (1s or 0.1 s) during each trial, demonstrating that the CMC receiver measurement noise is not a significant factor that is affecting ambiguity resolution performance. 0 20 40 60 80 100 <1<5<10<60<120 >120 Ambiguity Fixing Time(Seconds) Percentage(%) 0 20 40 60 80 100 Cumulative Percent(%) 10Hz Data1Hz Data Fig. 2 Time to Fix Ambiguity in static field test The corresponding static field test statistics are shown in Fig. 2. With the existence of multipath and antenna phase center errors, 19.6 % of the ambiguities were fixed in one second with 1 Hz data. The integer ambiguities were fixed in 5 seconds 84.9 % of the time. Meanwhile, with 10 Hz measurement rate, the corresponding values were 89.4 % and 93.4 % respectively. The time required to fix the ambiguity could be significantly reduced using high data rate in this case during some trials. However, there are cases where the fixing time was larger than 60 second. This was related to the presence of time- correlated multipath and antenna phase center offset errors. The high data measurement is less effective to these errors. Tab. 1 shows that the probability of resolving correct ambiguities for the field test is 93% for 1 Hz data and  88 Journal of Global Positioning Systems 96% for 10 Hz data. With the higher rate measurements, the ambiguity resolution reliability can thus be only slightly improved. Even though the incorrect ambiguities were selected occasionally, they can be easily rejected in the attitude software either by improving the MTTAF parameter in ambiguity resolution or by the reliability control in the attitude estimation phase. Then, the estimated angle is compared with the known angle . If the ambiguities of two inter-antenna vectors are correctly solved, the two angles should be consistent within a certain tolerance. E θ θ δθθ <− E (4) Tab. 1 Performance of ambiguity resolution using different data rate measurements The numerical value of the angular tolerance in (4) depends on the inter-antenna distance and the quality of phase measurements, which are a function of measurement noise, multipath and phase centre stability. In the case of antenna vector lengths of 1-2 m and a moderate carrier phase measurement quality, a 5-degree tolerance is appropriate to detect the wrong ambiguities. If at least four antennas are used in the attitude determination system and only one vector ambiguity is wrong, this erroneous ambiguity combination can be detected and identified by checking all the angles between the inter antenna vectors. δ Correctness (%) 10 Hz data 1 Hz data Simulation Test 100% 100% Static Field Test 96 93 6 Fixed Angular Constraint Scheme If one can assume that the antennas are mounted on a rigid platform, then their relative positions are fixed regardless of the platform motion. The full antenna frame geometry is known a priori and appropriate constraints can be used in the ambiguity resolution process to take advantage of this knowledge. Many geometric constraints have been brought forward for the ambiguity resolution in multi-antenna GPS attitude determination system. [El- Mowafy 1994, Euler and Hill 1995] In this research, the fixed angle between the antenna vectors, as well as the vector length, was employed to verify the double difference ambiguities. A hardware simulation test was conducted with the 4760 simulator to investigate the validity of the angular constraint scheme. An antenna body frame was simulated using inter-antenna distances of 1 m. The angles between the antenna vectors were intentionally set to 90 degrees in this test. The initial parameters used in the software were • Fixing ratio =3 • MTTAF =1 epoch The implementation of the angular constraint is straightforward. First, the fixed planar angles () between antenna vector pairs could either be measured a priori or calculated using the antenna coordinates in the body frame. Once the integer ambiguities of the antenna vector pairs have been determined, the angle between the pairs can be directly computed using the antenna vector coordinates in the local level frame: θ LL AC LL AB LL AC LL AB E bb bb v r rr ⋅ ⋅ =−1 cos θ ACAB LL AC LL AB LL AC LL AB LL AC LL AB bb VVNNEE ⋅ ∆∆+∆∆+∆∆ =−1 cos (3) where E θ is the estimated angle between the two antenna vectors Fig. 3 DOPs and SV number during simulator test Fig. 3 shows the satellite’s azimuth and elevation DOPs during the test. At GPS time 216932 s, the loss of SV27 signal in one of the secondary receivers caused the failure of the Chi-square test and the re-initialization of the double difference ambiguity for the corresponding inter- antenna vector. Unfortunately, the wrong ambiguity was determined due to the short MTTAF. When SV27 was re- acquired by the receiver, an incorrect ambiguity was first LL AC LL AB bb rr , are the antenna vectors in local level frame ACABbb, are the lengths of the antenna vectors VNE ∆∆∆ ,, are three components of antenna vector in east, north, and vertical directions subscripts represent the primary antenna and two secondary antennas CBA ,,  Wang and Lachapelle: GPS Attitude Determination Using Low Cost Receivers 89 found, with the true ambiguity obtained afterwards. The effect of this error on the inter-antenna vector solutions during this period is shown in Fig. 4. The inter-antenna length components are obviously incorrect. However, the length itself was corrected solved and testing of the solution with that known length failed to detect the incorrect solution in this case. Fig. 4 Effects of an incorrect ambiguity on an inter-antenna vector estimate Since no quality control procedure was performed in the least squares attitude estimation, the erroneous inter- antenna vector solutions inevitably led to the wrong attitude parameters. The error effects on the attitude component estimates are shown in Fig. 5. Fig. 5 Effects of an incorrect ambiguity on attitude component estimates After the angular constraint scheme was implemented in the software, the wrong ambiguity was easily detected and the erroneous vector solution was successfully detected and excluded from the attitude estimation. As shown in Fig. 6, the correct attitude components were estimated in the least squares solution using the other two inter-antenna vectors. The small shift in the attitude estimates is due to the exclusion of SV27 and the resulting slight change of satellite geometry. The mean and rms agreements in heading, pitch and roll are 2.1, 0.3, -0.2, 2.8, 3.4 and 3.3 arcmins, respectively. Fig. 6 Attitude results after implementing angular constraints in static simulation test By employing the angle consistency check in the ambiguity resolution, some incorrect ambiguity solutions can be effectively rejected, which significantly improves the reliability of multi-antenna attitude determination. 7 Kalman Filter Estimation Kalman filtering estimation provides a recursive method for the determination of attitude components through a predicting and updating process. The general formulas in Kalman filtering can be written as [Brown & Hwang 1992] kkkk vxHz +⋅= (5) kkkk wxx +⋅= −1 φ (6) where k z is the measurement vector at time k k H is the design matrix k x is state vector at time k k v is the measurement noise with covariance R k φ is the transition matrix k w is the process noise with covariance Q In attitude determination using vector components, the “measurements” are the antenna vector components in the local level frame. The design matrix is the partial derivative of the rotation matrix with respect to the state vector in Equation 1.  90 Journal of Global Positioning Systems x R H∂ ∂ = (7) The state vector here includes the three Euler attitude parameters and their angular rates: ( T x ϕθψϕθψ & & & = ) (8) The transition matrix and the process noise can be expressed as follows φ = 100000 010000 001000 00100 00010 00001 dt dt dt φ (9) = 2 2 2 00000 00000 00000 000000 000000 000000 ϕ θ ψ σ σ σ & & & Q (10) α The numerical values of the angular rate variances in (10) represent the tightness of the dynamic constraint of the Kalman filter. In vehicular attitude determination, the sigma of the angular rate in the Q matrix is empirically selected as 2 degrees per epoch in 10 Hz sampling in the present case. Intuitively, one realizes that the effectiveness of the filter in detecting incorrect solutions, thus improving reliability, will depend on our a priori knowledge of the vehicle dynamic and of the measurement rate. Using this model, the attitude parameters and their angular rates can be correctly estimated in the Kalman filter as long as all the measurements are free of errors. As previously mentioned, the measurements used in the Kalman filter are the inter-antenna vector solutions after ambiguity resolution. In the case that the wrong ambiguity is determined, these “quasi-measurements” are in error and the attitude estimates calculated from the Kalman filter may deviate from the truth. In order to reject the incorrect inter-antenna vector solutions from the Kalman filter and improve the reliability of the attitude estimates, a quality control system based on the filter innovation sequences is introduced herein. The innovation sequence is the difference between the actual system output and the predicted output based on the predicted state (see Equation 11) [Teunissen & Salzman 1988]. )(−− −=kkk xfzv) (11) Under normal conditions, the innovation sequence is a zero-mean Gaussian white noise sequence with known variance. In the presence of erroneous measurements, such assumptions are no longer valid, and the innovation sequence deviates from its zero mean and white noise properties. Thus some statistical tests can be conducted to detect and identify outliers or faults in the measurements. Firstly, an overall model test is conducted to detect the errors in the measurement vector. The test statistics in this global test are given as )0,(~ 21 mvCvT ak v T kk k χ −−− − = (12) where m is the number of observations taken at time , k − k v C is the covariance matrix of the innovation and 2 α χ is the Chi-square probability with a significance level of . If the global test is rejected, the system error can be identified with the one-dimensional local slippage test. )1,0(~ 1 1 Ν= − −− − − i v T i k v T i ik lCl vCl w k k (13) where T i i i i l)0,...,0,1,0,...0(11 +− = for =1,…,m i The significant level in the local test is suggested to be 0.999, which leads to a boundary value of 3.29. Thus the i-th measurement is flagged for rejection when α 29.3> i w (14) When implementing statistical tests to identify outliers in the measurements, two types of errors may be made, as shown in Fig. 7. The first type (Type I) is rejecting a good measurement. The probability associated with this type error is denoted by . If a bad measurement is accepted by the test, a Type II error occurs. The probability of a Type II error is expressed as . α β Fig. 7 Type I/II Errors Given the probability values of Type I and Type II errors, the Minimum Detectable Blunder (MDB) can be calculated as the ability to detect errors in the system as  Wang and Lachapelle: GPS Attitude Determination Using Low Cost Receivers 91 i v T i ilCl z k 1 0 − − =∇ δ (15) where is a function of and (see Fig. 8). 0 δα β In GPS kinematic applications, and are commonly selected to be 0.001 and 0.2 respectively and is then 4.13. α β 0 δ In the presence of strong multipath, the identification test (Equation 15) may be too sensitive and will sometimes lead to a false alarm. In order to alleviate this problem, a further step was introduced by comparing the innovations with the MDB. If the innovation is larger than the MDB, the measurement is identified erroneous, otherwise it is considered a false alarm. The modified Kalman-filter-based attitude determination software was tested with the data collected with the Spirent 4760 hardware simulator using four CMC receivers. A vehicle trajectory was simulated in this test and the antenna configuration is shown in Figure 8. The maximum attitude changes were about 20 degree/s in heading and several degrees per second in pitch. The true attitude during the test is plotted in Fig. 9. Fig. 8 Simulated vehicle test antenna configuration Fig. 9 True attitude parameters during hardware simulator test The results, summarized in Fig. 10 and Table 2, show that the Kalman filter method did not work well with tight dynamic constraints using a 1-Hz date rate, as over shooting effects occur. With a 10-Hz data rate, the performance of the filter is excellent, the attitude parameter estimates being slightly better than those of the least squares estimates. Fig. 10 Attitude estimate errors using different estimation methods Tab. 2 RMS – Kalman filter versus least-squares RMS Heading Pitch Roll 10 Hz LS 3.9’ 11.8’ 9.9’ 10 Hz KF 3.9 9.8 7.9 1 Hz KF1 31.9 11.8 9.0 In order to test the performance of cycle slip detection using the quality control method implemented by the Kalman filter, 80 cycle slips were introduced in the carrier phase measurements on different receivers with a magnitude ranging from 1 to 8 cycles. Using the traditional phase prediction detection and inter-antenna length consistency check, all the cycle slips but one were either detected or recovered. The remaining cycle slip was removed when the Kalman filter was used, as shown in Fig. 12. Fig. 11 Cycle slip detection using Kalman filter 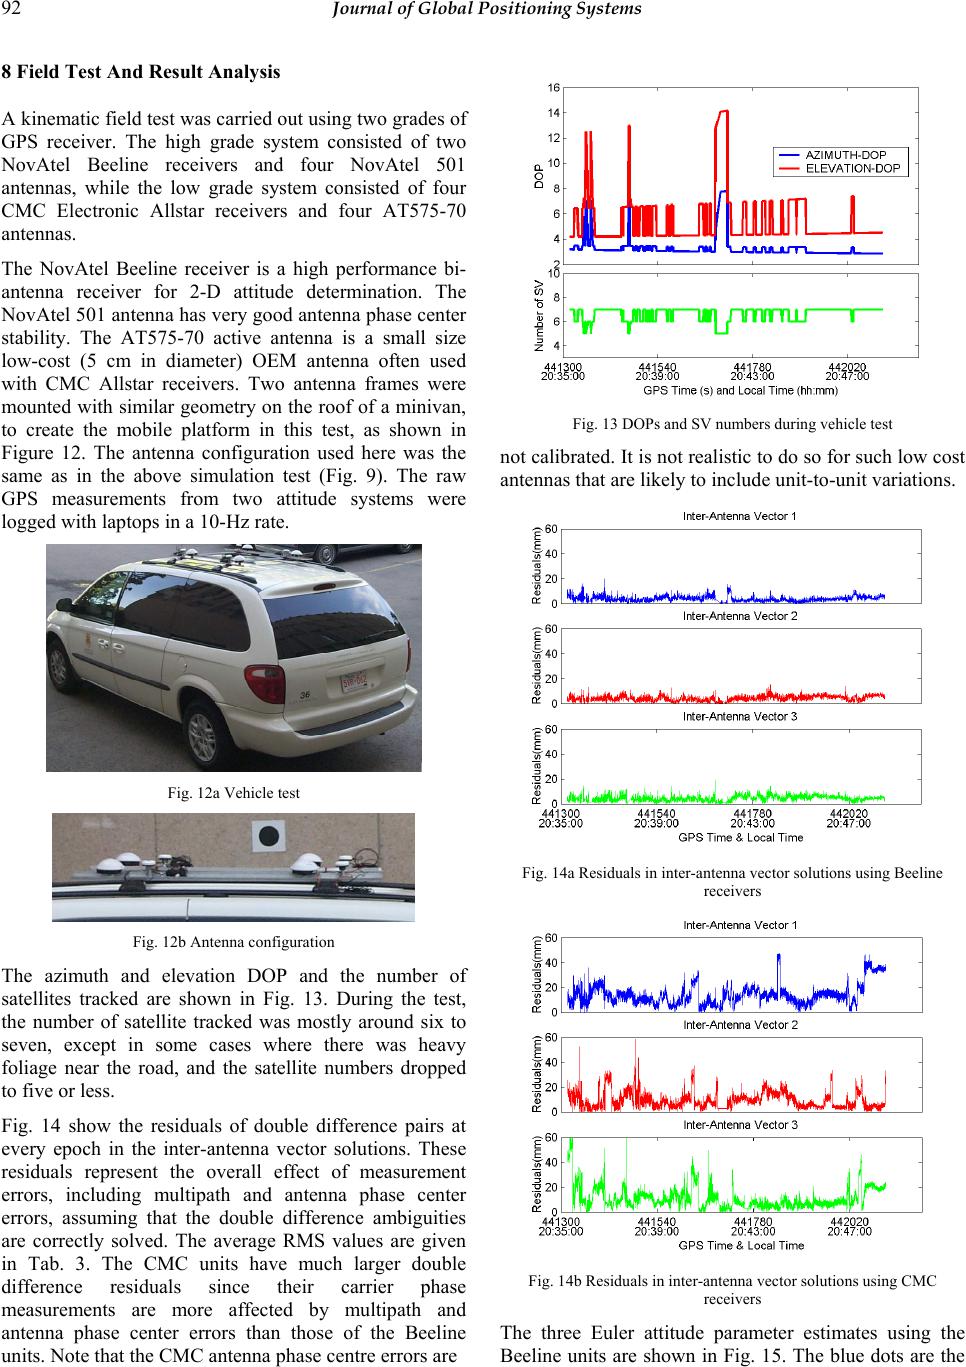 92 Journal of Global Positioning Systems 8 Field Test And Result Analysis A kinematic field test was carried out using two grades of GPS receiver. The high grade system consisted of two NovAtel Beeline receivers and four NovAtel 501 antennas, while the low grade system consisted of four CMC Electronic Allstar receivers and four AT575-70 antennas. The NovAtel Beeline receiver is a high performance bi- antenna receiver for 2-D attitude determination. The NovAtel 501 antenna has very good antenna phase center stability. The AT575-70 active antenna is a small size low-cost (5 cm in diameter) OEM antenna often used with CMC Allstar receivers. Two antenna frames were mounted with similar geometry on the roof of a minivan, to create the mobile platform in this test, as shown in Figure 12. The antenna configuration used here was the same as in the above simulation test (Fig. 9). The raw GPS measurements from two attitude systems were logged with laptops in a 10-Hz rate. Fig. 13 DOPs and SV numbers during vehicle test not calibrated. It is not realistic to do so for such low cost antennas that are likely to include unit-to-unit variations. Fig. 12a Vehicle test Fig. 14a Residuals in inter-antenna vector solutions using Beeline receivers Fig. 12b Antenna configuration The azimuth and elevation DOP and the number of satellites tracked are shown in Fig. 13. During the test, the number of satellite tracked was mostly around six to seven, except in some cases where there was heavy foliage near the road, and the satellite numbers dropped to five or less. Fig. 14 show the residuals of double difference pairs at every epoch in the inter-antenna vector solutions. These residuals represent the overall effect of measurement errors, including multipath and antenna phase center errors, assuming that the double difference ambiguities are correctly solved. The average RMS values are given in Tab. 3. The CMC units have much larger double difference residuals since their carrier phase measurements are more affected by multipath and antenna phase center errors than those of the Beeline units. Note that the CMC antenna phase centre errors are Fig. 14b Residuals in inter-antenna vector solutions using CMC receivers The three Euler attitude parameter estimates using the Beeline units are shown in Fig. 15. The blue dots are the  Wang and Lachapelle: GPS Attitude Determination Using Low Cost Receivers 93 least squares attitude estimates and their 3-sigma standard deviation envelopes, while the red dots are the corresponding estimates from the Kalman filter with the quality control method turned on. Tab. 3 Residuals RMS (mm) for Beeline and CMC receivers Inter-antenna Vector Beeline Rcvrs CMC Rcvrs 1 5 17 2 5 12 3 5 15 Fig. 15 Attitude estimates using the Beeline system Using least squares estimation, wrong attitude parameter estimates were output when heavy satellite blockages occurred. The reason for this is that the least squares estimation was severely affected by incorrect vector solutions in such circumstances. Once the base satellite is lost, the double difference ambiguities have to be resolved at the next epoch. As is known, ambiguity resolution performance is highly correlated to the number of visible satellites and their geometry. In a heavy signal blockage area with strong multipath and phase center variations, ambiguity resolution is more likely to result in an incorrect solution, which leads to erroneous attitude parameter estimates. These incorrect estimates can however be easily identified by inspecting the 3-sigma standard deviation envelopes. Once a Kalman filtering with the quality control method and the angular constraints are implemented, the wrong inter-antenna vector solutions are detected and excluded from the solution. This eliminates erroneous attitude parameters from the output. The Kalman filter 3-sigma standard deviation envelopes are slightly smaller than those from the least squares method due to the filter constraints. As can be seen in the figures, the standard deviation improvement is more significant in pitch and roll than in heading. This is because the pitch and roll dynamics were lower than those of heading. Fig. 16 Attitude estimates using the CMC system The attitude results from the CMC units are shown in Fig. 16. The overall attitude estimation accuracy was slightly lower than that obtained with the Beeline units. Using the Kalman filter augmented with the quality method, erroneous vector solutions, which caused wrong attitude estimates in the least squares approach, were successfully identified and rejected from the attitude estimation. As the phase measurements from CMC units are more vulnerable to multipath, phase center errors and cycle  94 Journal of Global Positioning Systems slips, erroneous inter-antenna vector solutions were more frequently determined. When more incorrect solutions were rejected by the Kalman filter, the availability of attitude estimates degraded due to the reduction of correct “quasi-observables” compared with the result from the least squares method. The lowered number of vector solutions involved in attitude estimation, coupled with the larger carrier phase errors, caused large variations in the estimation accuracy of the Kalman filter. The estimated attitude differences between the Beeline and CMC systems are shown in Fig. 17, and the corresponding statistics are summarized in Table 4. The estimated differences are mostly within 1.5 degrees in heading and 3 degrees in pitch and roll. The largest differences occur during periods of poor satellite geometry. Fig. 17 Attitude differences between the Beeline and CMC systems Tab. 4 Statistics of attitude difference between Beeline and CMC units (Units: degrees Difference Heading Pitch Roll Mean 0.68 - 0.74 - 0.24 RMS 0.94 2.26 2.17 Max(abs) 4.56 8.64 9.44 Figure 18 shows the external statistical reliability of the two systems. External reliability is the impact of the maximum measurement errors that could occur and go undetected, on the attitude estimates, for two systems. This reliability measure is a function of the quality of carrier phase measurements and of the redundancy numbers in the Kalman filters. The external reliability of the Beeline system is fairly consistent during the test except during times of poor geometry. The corresponding reliability of the CMC system is much poorer due to the higher multipath and antenna phase center errors. It is important to note that the estimated attitude differences in Figure 23 are within the reliability numbers of Figure 24 and 25. Thus, one can conclude that the CMC units have reached their limit in term of accuracy performance, if one assumes that the choice of antennas is limited to current low cost units. In order to increase attitude component estimation performance, higher performance, but more expensive antennas could be used. The use of long inter-antenna distances would also improve accuracy. Aiding with external sensors is the other alternative. Fig. 18 External reliability 9 Conclusions Multipath, cycle slips and antenna phase center instability are major error sources limiting the reliability of standalone GPS-based attitude determination with low cost receivers. Even if a required level of accuracy can be achieved with a given multiple receiver configuration, reliability becomes a major issue. It has been demonstrated herein that the use of angular constraints and a Kalman filter with a high data rate are effective to significantly improve reliability. However, the use of statistical reliability analysis has also shown the limitations of the above techniques. Another technique is currently being assessed to improve reliability and error detection, namely the use of low cost rate gyros integrated with the antenna assembly in various configurations. Given a GPS data rate of 10 Hz, such low cost rate gyro should still be useful for short term prediction between the GPS measurements, smoothing, error detection and enhancement of availability. Early results indicate these are possible enhancements indeed.  Wang and Lachapelle: GPS Attitude Determination Using Low Cost Receivers 95 References Brown, R.G. and P.Y.C. Hwang (1992) Introduction of Random Signals and Applied Kalman Filter, Second Edition, John Wiley & Sons, Inc., New York El-Mowafy, A, (1994) Kinematic Attitude Determination From GPS, Ph.D dissertation, UCGE Reports 20074, University of Calgary, Calgary, Alberta, Canada, 1994 Euler H.-J. and Hill C.D., (1995) Attitude Determination: Exploiting All Information for Optimal Ambiguity Resolution, Proceedings of the ION GPS-95, Palm Springs, CA, September, 1995 Hatch, R. (1991) Instantaneous Ambiguity Resolution, Proceedings of the IAG International Symposium 107 on Kinematic Systems in Geodesy, Surveying and Remote Sensing, Banff, Canada, September, 1990, Springer- Verlag, New York. Hoyle, V., Lachapelle, G., M.E. Cannon and Wang, C. (2002) Low-Cost GPS Receivers and their Feasibility for Attitude Determination, Proceeding of NTM02, The Institute of Navigation, San Diego, CA, pp. 226-234 [http://www.geomatics.ucalgary.ca/research/GPSRes earch/first.html] Lu, G. (1994) Development of a GPS Multi-Antenna System for Attitude Determination, Ph.D thesis, Report No. 20073, Department of Geomatics Engineering, University of Calgary [http://www.geomatics.ucalgary.ca/links/ GradTheses.html] Teunissen, P.J.G. and Salzman, M.A. (1988) Performance Analysis of Kalman Filters, Report of the Faculty of Geodesy, Delft University of Technology, Delft, The Netherlands.
|