Paper Menu >>
Journal Menu >>
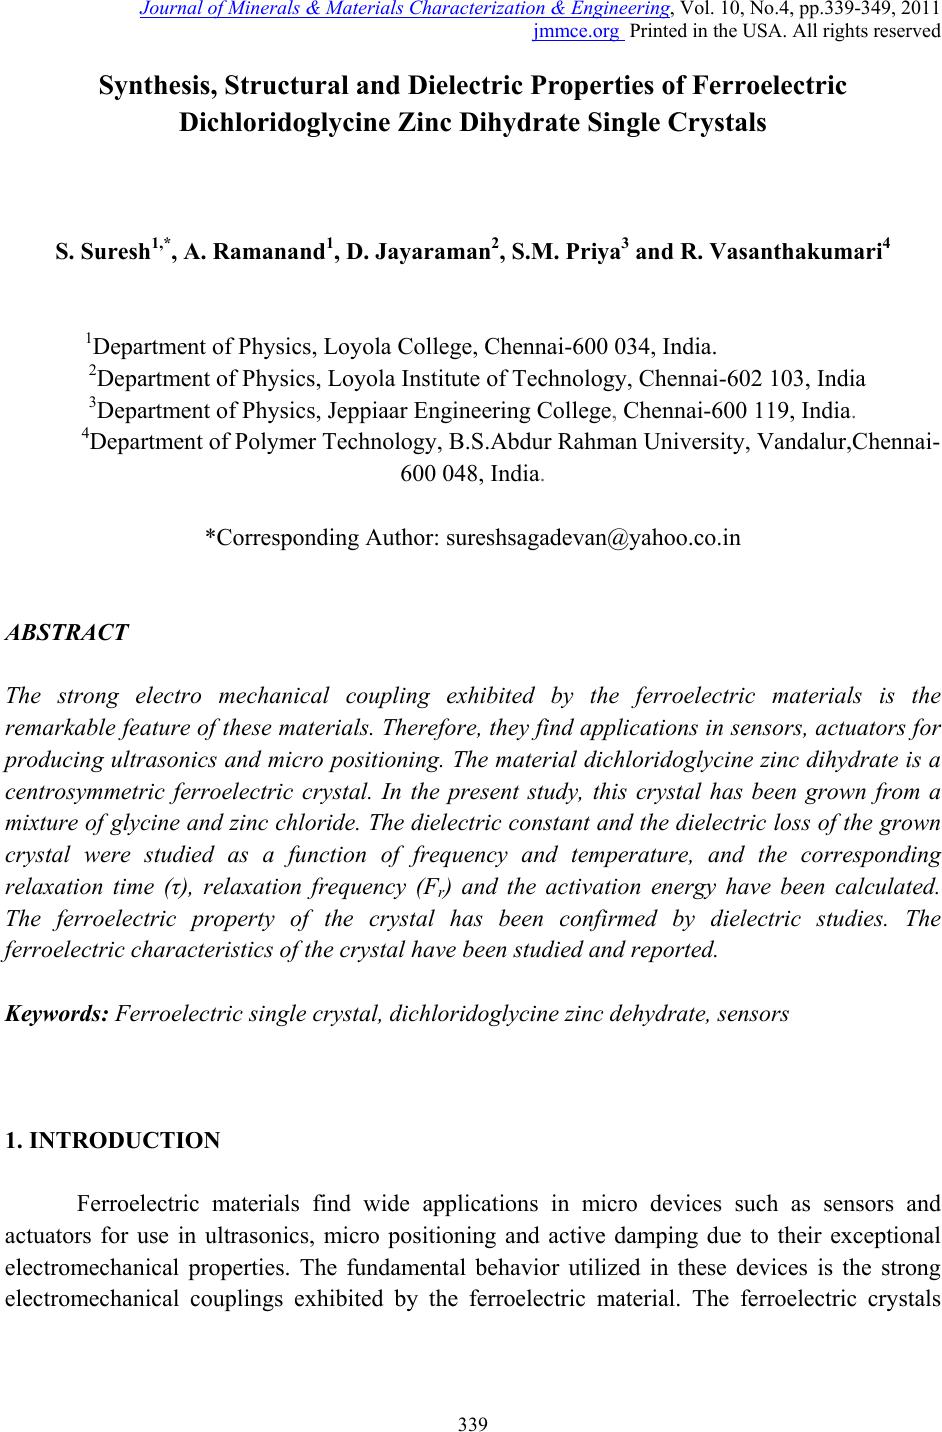 Journal of Minerals & Materials Characterization & Engineering, Vol. 10, No.4, pp.339-349, 2011 jmmce.org Printed in the USA. All rights reserved 339 Synthesis, Structural and Dielec tr ic Properties of Ferro el ec tr ic Dichloridoglycine Zinc Dihydrate Single Crystals S. Suresh1,*, A. Ramanand1, D. Jayaraman2, S.M. Priya3 and R. Vasanthakumari4 1Department of Physics, Loyola College, Chennai-600 034, India. 2Department of Physics, Loyola Institute of Technology, Chennai-602 103, India 3Department of Physics, Jeppiaar Engineering College, Chennai-600 119, India. 4Department of Polymer Technology, B.S.Abdur Rahman University, Vandalur,Chennai- 600 048, India. *Corresponding Author: sureshsagadevan@yahoo.co.in ABSTRACT The strong electro mechanical coupling exhibited by the ferroelectric materials is the remarkable feature of these materials. Therefore, they find applications in sensors, actuators for producing ultrasonics and micro positioning. The material dichloridoglycine zinc dihydrate is a centrosymmetric ferroelectric crystal. In the present study, this crystal has been grown from a mixture of glycine and zinc chloride. The dielectric constant and the dielectric loss of the grown crystal were studied as a function of frequency and temperature, and the corresponding relaxation time (τ), relaxation frequency (Fr) and the activation energy have been calculated. The ferroelectric property of the crystal has been confirmed by dielectric studies. The ferroelectric characteristics of the crystal have been studied and reported. Keywords: Ferroelectric single crystal, dichloridoglycine zinc dehydrate, sensors 1. INTRODUCTION Ferroelectric materials find wide applications in micro devices such as sensors and actuators for use in ultrasonics, micro positioning and active damping due to their exceptional electromechanical properties. The fundamental behavior utilized in these devices is the strong electromechanical couplings exhibited by the ferroelectric material. The ferroelectric crystals  340 S. Suresh, A. Ramanand, D. Jayaraman, S.M. Priya and R. Vasanthakumari Vol.10, No.4 find important applications in optoelectronics such as capacitors, nonvolatile memory devices, actuators, high-performance gate insulators, etc. All ferroelectric materials are pyroelectric, however, not all pyroelectric materials are ferroelectric. Below Curie temperature, ferroelectric and pyroelectric materials are polar and possess a spontaneous polarization or electric dipole moment. However, this polarity can be reoriented or reversed fully or partially through the application of an electric field with ferroelectric materials. The nonpolar phase encountered above the Curie temperature is known as the paraelectric phase. The direction of the spontaneous polarization confirms towards the crystal symmetry of the material. The reorientation of the spontaneous polarization is a result of atomic displacements. The magnitude of the spontaneous polarization is highest at temperatures well below the Curie temperature and approaches zero as the Curie temperature is neared. In recent times, the trend is to design organoelectronics for which the development of organic ferroelectrics is mandatory [1–4]. In the present investigation dielectric constant and the dielectric loss have been determined as a function of frequency and temperature for the dichloridodiglycine zinc dihydrate crystal. 2. EXPERIMENTAL PROCEDURE A supersaturated solution of glycine and zinc chloride was prepared in equimolar proportion and stirred continuously using a magnetic stirrer for 3 days. The prepared solution was filtered and kept undisturbed at room temperature. In the beginning some crystals of irregular polymorphs were harvested and it was identified as dichloro-bis glycine-O- zinc glycine, and after a few days seed crystals of dichloridodiglycine zinc dihydrate with an excellent morphology was observed and it is found to be centrosymmetric. 2.1 Single Crystal XRD X-ray diffracting data were collected using automatic diffractometer (MESSRS, ENRAF NONIUS, Netherlands). The structure was solved by the direct method using SHELXL program. From the analysis the cell parameters were found to be a = 14.4167 Å, b = 6.9068 Å, c = 12.9531 Å, β = 117.94 with space group C2/c and point group 2/m. ORTEP diagram and the packing diagram of the grown crystal are shown in Figs.1 and 2, respectively. 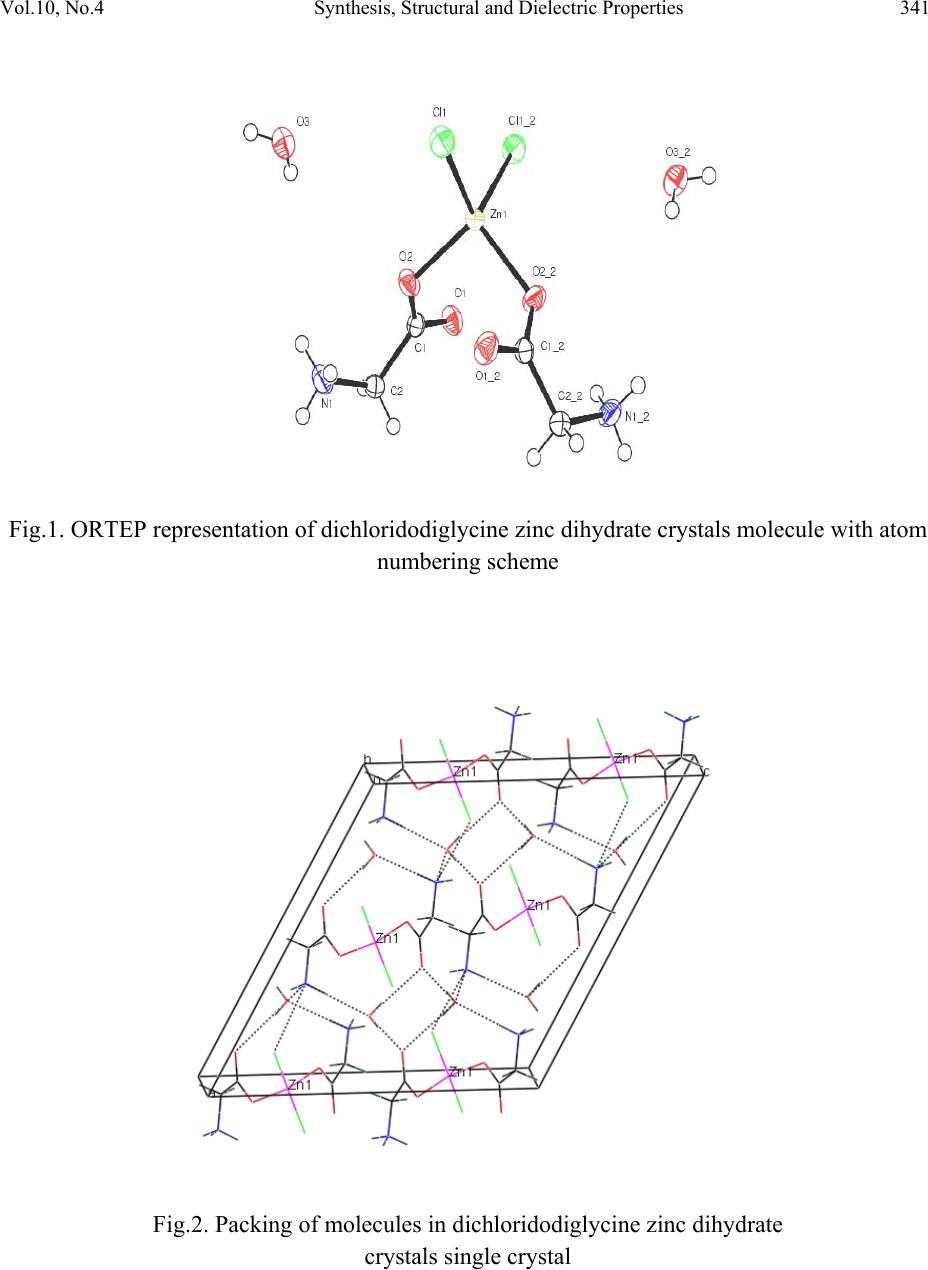 Vol.10, No.4 Synthesis, Structural and Dielectric Properties 341 Fig.1. ORTEP representation of dichloridodiglycine zinc dihydrate crystals molecule with atom numbering scheme Fig.2. Packing of molecules in dichloridodiglycine zinc dihydrate crystals single crystal 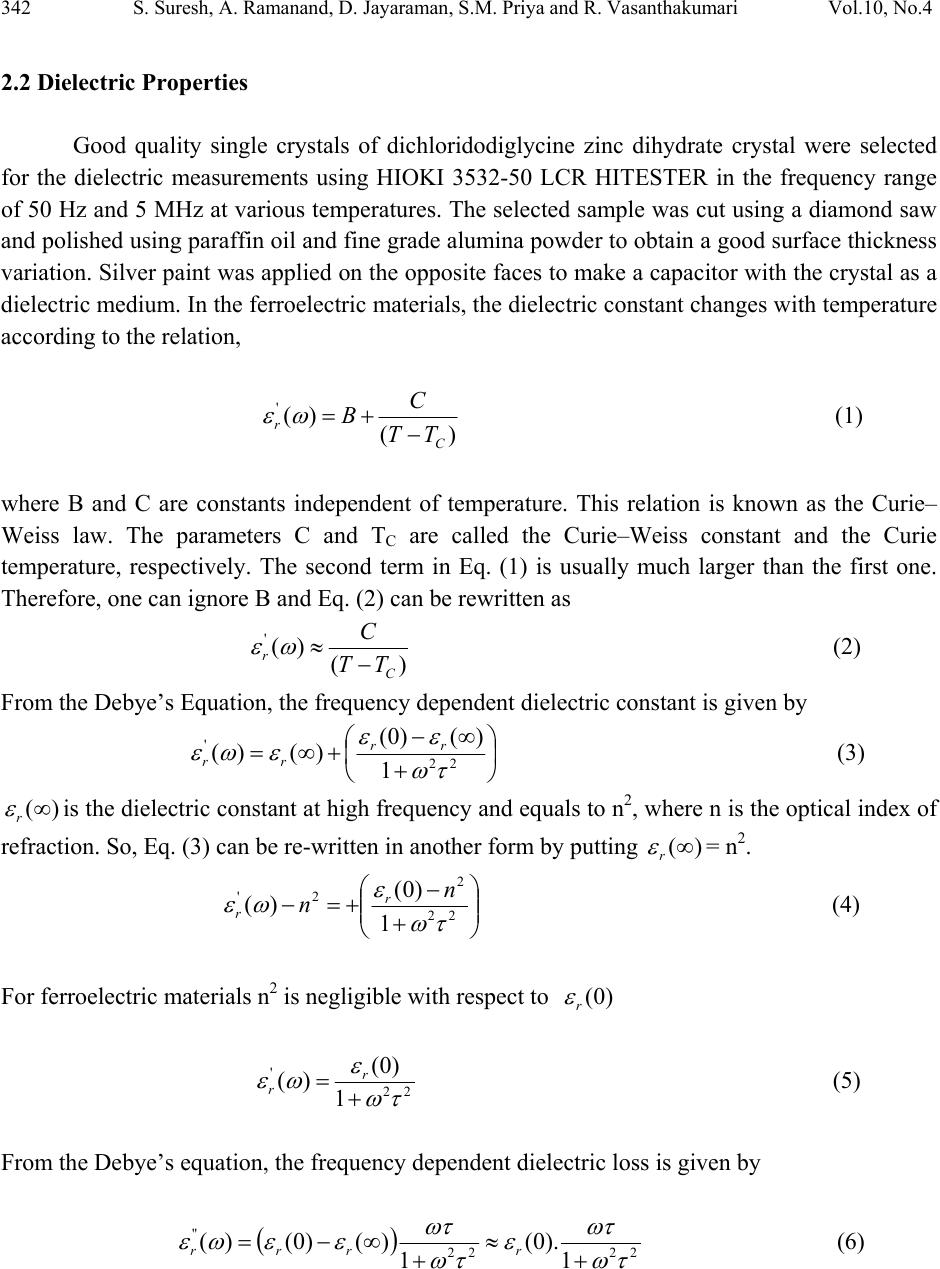 342 S. Suresh, A. Ramanand, D. Jayaraman, S.M. Priya and R. Vasanthakumari Vol.10, No.4 2.2 Dielectric Properties Good quality single crystals of dichloridodiglycine zinc dihydrate crystal were selected for the dielectric measurements using HIOKI 3532-50 LCR HITESTER in the frequency range of 50 Hz and 5 MHz at various temperatures. The selected sample was cut using a diamond saw and polished using paraffin oil and fine grade alumina powder to obtain a good surface thickness variation. Silver paint was applied on the opposite faces to make a capacitor with the crystal as a dielectric medium. In the ferroelectric materials, the dielectric constant changes with temperature according to the relation, )( )( ' C rTT C B (1) where B and C are constants independent of temperature. This relation is known as the Curie– Weiss law. The parameters C and TC are called the Curie–Weiss constant and the Curie temperature, respectively. The second term in Eq. (1) is usually much larger than the first one. Therefore, one can ignore B and Eq. (2) can be rewritten as )( )( ' C rTT C (2) From the Debye’s Equation, the frequency dependent dielectric constant is given by 22 ' 1 )()0( )()( rr rr (3) )( r is the dielectric constant at high frequency and equals to n2, where n is the optical index of refraction. So, Eq. (3) can be re-written in another form by putting )( r = n2. 22 2 2' 1 )0( )( n nr r (4) For ferroelectric materials n2 is negligible with respect to )0( r 22 ' 1 )0( )( r r (5) From the Debye’s equation, the frequency dependent dielectric loss is given by 2222 '' 1 ).0( 1 )()0()( rrrr (6)  Vol.10, No.4 Synthesis, Structural and Dielectric Properties 343 By substituting Eq. (5) in Eq. (6), we obtain ).()( ''' rr (7) and by substituting Eq. (2) in Eq. (7), we obtain C rTT C .)( '' (8) Then, C TT C r )( '' (9) When C TT , then0 . Hence ' r tends to maximum. Then Eq. (5) is rewritten as )0('max rr This conclusion means that the dielectric peak at the phase transition temperature in ferroelectric materials can be considered as)0( r . But ' maxr is a function of the frequency, i.e. )()()0( ' max ' max ncyhighfrequecylowfrequen rrr > Then Eq.(9) cannot be used for the calculation of the relaxation time, especially at the phase transition temperature TC. Then the previous model which was described by Eq. (9) can be modulated into another simplified model. Taking the relaxation time near the critical temperature as C , Eq (5) is rewritten for lower frequency ' maxr (L) and higher frequency ' maxr (H) as 22 max ' max 1 )0( )( CL r rL (10) 22 max ' max 1 )0( )( CH r rH (11) From the above two equations one can find an equation to describe the value of C as  344 S. Suresh, A. Ramanand, D. Jayaraman, S.M. Priya and R. Vasanthakumari Vol.10, No.4 2/1 22 )]([ ]1)([ R R LH C (12) where )( )( )( ' max ' max H L R r r Substituting the value of C in Eq. (11), the value of )0( maxr can be obtained. By substituting the value of )0( r in Eq. (5), one can obtain the value of , the Debye’s Relaxation time, as a function of temperature keeping frequency constant. Hence, the equation which gives the values of for all ranges of temperature, except at the phase transition temperature, can be rewritten as 2/1 max 11 )( )0( T r r (13) The values of τ from the previous equation are corrected for the whole range of temperatures both for ferroelectric phase and for paraelectric phase except atC TT , C . From the Debye’s relaxation time, the relaxation frequency (Fr) can be determined using the formula 1 r F (14) The activation energy (Ea) can be calculated from the plot of Log )(1 versus 1000/T using the relation [5]: KT Ea exp 0 (15) 3. RESULTS AND DISCUSSIONS The plot of dielectric constant (' ) vs frequency for various temperatures is shown in Fig.3. The dielectric constant is high in the lower frequency region and decreases with an increase in frequency. The very high value of dielectric constant at low frequencies may be due to the presence of all the four components namely, space charge, orientational, electronic and ionic polarisations. At higher frequencies up to 200 kHz, the dielectric constant decreases gradually. From 3 MHz to 5 MHz, there is an increase in the dielectric constant due to stray capacitances [6–10]. The dielectric loss was also studied as a function of frequency for different temperatures and is shown in Fig.4. The low dielectric loss at high frequencies for the given  Vol.10, No.4 Synthesis, Structural and Dielectric Properties 345 sample indicates very high purity of the crystal. These curves suggest that the dielectric loss is strongly dependent on the frequency of the applied field. The temperature dependent dielectric constant for various frequencies is shown in Fig.5. Dielectric measurements were carried out on the polarizing plane in the temperature range of 328K-368K for various frequencies. From the plot (Fig.5), it was clear that the dielectric constant increases at 368K called Curie temperature (TC). This means that the crystal undergoes phase transition at 368K from paraelectric to ferroelectric state. Thus, it is evident that the crystal possesses ferroelectric properties. The temperature dependent dielectric constant (' ) for dichloridodiglycine zinc dihydrate crystals shows that the dielectric constant (' ) initially increases up to 368 K then decreases gradually. This indicates that the grown crystal begins to undergo phase transition from paraelectric to ferroelectric at 368K, which is called as the Curie temperature (TC). Thus the peak at 368 K indicates the ferroelectric phase transition for the dichloridodiglycine zinc dihydrate crystals. The Debye’s relaxation time ( ) for various frequencies ranging between 50 Hz and 900 Hz and the corresponding relaxation frequency were calculated for the dichloridodiglycine zinc dihydrate crystals. The activation energy (Ea) at various frequencies ranging between 50 and 900 Hz was calculated from the slope of the graph between log )(1 vs. 1/T and is shown in Fig.6. The value of activation energy was found to be 0.014 eV, 0.023 eV, 0.030 eV, 0.047 eV and 0.060 eV for various frequencies of 50 Hz, 100 Hz, 200 Hz, 600 Hz and 900 Hz, respectively. Fig. 3. Variation of dielectric constant (' ) with log f 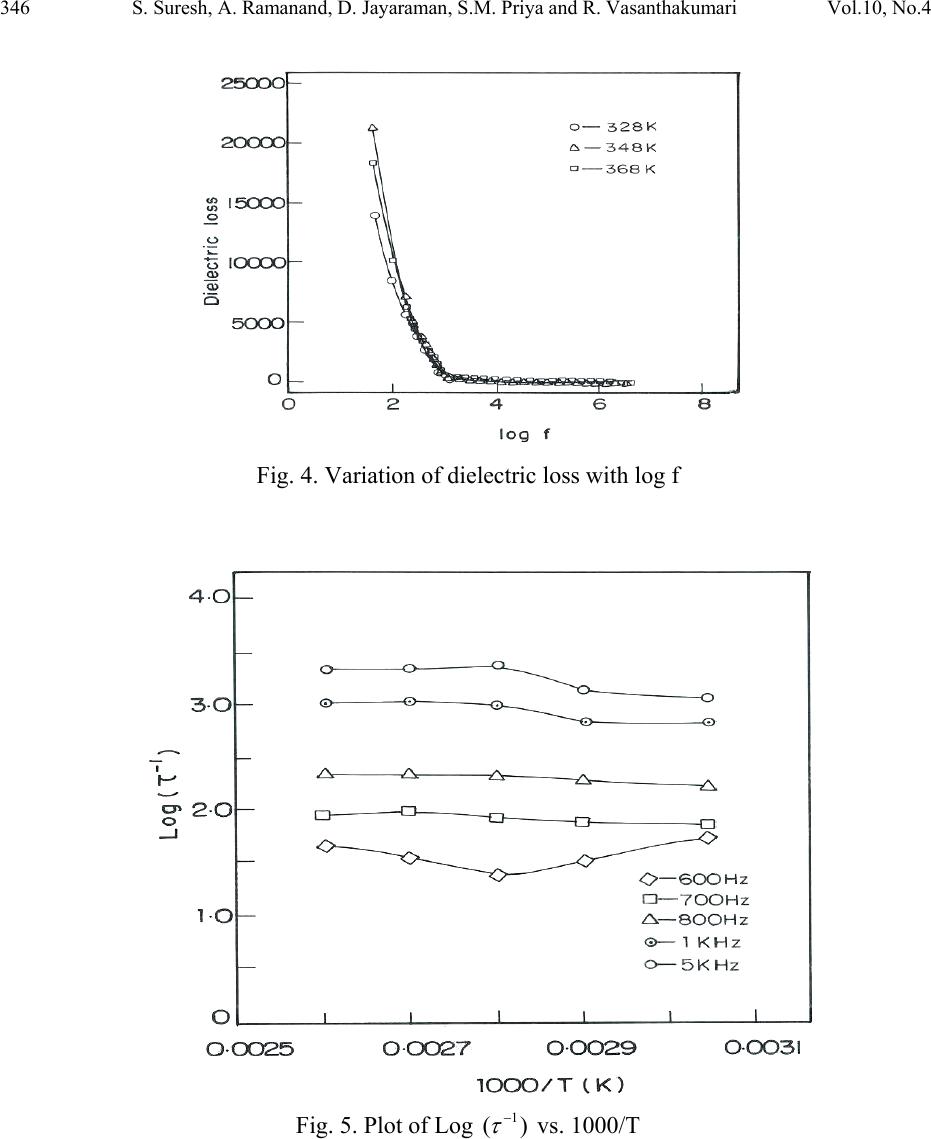 346 S. Suresh, A. Ramanand, D. Jayaraman, S.M. Priya and R. Vasanthakumari Vol.10, No.4 Fig. 4. Variation of dielectric loss with log f Fig. 5. Plot of Log )(1 vs. 1000/T  Vol.10, No.4 Synthesis, Structural and Dielectric Properties 347 Fig. 6. Variation of dielectric constant (' ) vs. temperature 3.1 Ferroelectric Studies The ferroelectric property of the crystal has been determined using Ferroelectric loop tracer (Radiant Technologies). Fig. 7 shows polarization versus voltage behaviour of the grown crystal with a voltage range from +200V to -200V. This figure shows that the material has good ferroelectric nature with a remanant polarization (Pr) of approximately 30nC/cm2and the coercivety (Vr) of about 177V which is quite high [11]. The saturation of the loops at these low frequencies indicates that the losses are minimal, suggesting that the crystal is highly resistive with electrical resistivity ρ = 5.35×10⁶ Ωcm2  348 S. Suresh, A. Ramanand, D. Jayaraman, S.M. Priya and R. Vasanthakumari Vol.10, No.4 Fig.7. P-V loop of dichloridodiglycine zinc dihydrate crystal 4. CONCLUSION Single crystal of dichloridodiglycine zinc dihydrate has been grown by slow evaporation method at a constant temperature of 40 0C. The grown crystal was characterized by single crystal XRD analysis .The variation of dielectric constant and dielectric loss were studied as a function of frequency and temperature. The Debye’s Relaxation time (τ), Relaxation frequency (Fr) and the corresponding activation energy (Ea) have been calculated for the dichloridodiglycine zinc dihydrate crystals. The ferroelectric behavior of the crystal was confirmed from the nature of ferroelectric loop with remant polarization of 300 nc/cm2 and coercivety value of 177V.These studies reveal that the dichloridodiglycine zinc dihydrate crystals are considered to be a promising material for the fabrication of optoelectronic devices. REFERENCES [1] K. Vinod Wadhawan, Introduction to Ferroic Materials, Gordon & Breach Publishers, London (New York), 2000. [2] O. Auciello, J.F. Scott, R. Ramesh, Phys. Today .51 (1998) 22. [3] J. Dolinsek, D. Arcon, Hae Jin Kim, J. Seliger, V. Zagar, P. Vanek, J. Kroupa, Z. Zikmund, J. Petzelt, Phys. Rev. B 57 (1998) R8063. [4] Sachio Horiuchi, Reiji Kumai, Yoshinori Tokura, J. Am. Chem. Soc. 127 (2005) 5010 [5] Gergs MK, Egypt J Solids .29, (2006) 371–82.  Vol.10, No.4 Synthesis, Structural and Dielectric Properties 349 [6] Patil MG, Mahajan VC, Ghatage AK, Patil SA, Indian J Pure Appl Phys .34, (1996)166– 71. [7] Lal B, Khosa SK, Tickoo R, Bamzai KK, Kotru PN, Mater Chem Phys. 83, (2004) 158–68. [8] Ramana Reddy AV, Ranga Mohan G, Ravinder D, Boyanov BS, J Mater Sci.34, (1999) 3169–76. [9] Parkash C, Bajal JS, J Less-Common Met .107, (1985) 51–7. [10] Ravinder D, Phys Status Solidi (a) .139, (1993) K69–72. [11] C.Sakaki et al., JpnJ.Appl.Phys.40, (2001)6901 |