Paper Menu >>
Journal Menu >>
 Journal of Minerals & Materials Characterization & Engineering, Vol. 9, No.9, pp.845-853, 2010 jmmce.org Printed in the USA. All rights reserved 845 Some Preliminary Metallurgical Studies on Grain Size and Density of Work Material used in Micro Turning Operation A. S. Patil 1 , H. K. Dave 1* , R. Balasubramaniam 2 , K. P. Desai 1 , H. K. Raval 1 1 Mechanical Engineering Department, S. V. National Institute of Technology, Surat, India 2 Machine Dynamics Division, BARC, Bombay, India *Corresponding Author: harshitkumar@yahoo.com ABSTRACT One important process in tool based micro machining technology is CNC micro turning which has the capability to produce 3D structures on micro scale. The major drawback of micro turning process is that the machining force influences machining accuracy and the limit of machinable size and shape. Therefore, the control of reactive force during cutting is an important factor in improving machining accuracy. The properties of work material significantly affect the cutting force generated during turning process. Commercially available metal rods are inhomogeneous and hence, qualifying the right material is very crucial in micro turning. Unlike plates, the properties like grain size and density vary significantly at different locations of the round bars. Hence, it is found very important to systematically find right material for micro turning from the commercially available rods. In present study, an attempt has been made to study the grain size and density of blank material from different locations of a larger diameter shaft. The work material selected is a 32 mm diameter shaft of commercial brass, a non ferrous alloy of copper and zinc. Five samples from different radial locations are cut from this shaft. It is found that grains are coarser at centre and finer towards the periphery of the shaft. Further, local density is less at centre and high at periphery of the shaft. Keywords: Micro turning, grain size measurement, grain counting method, linear intercept method 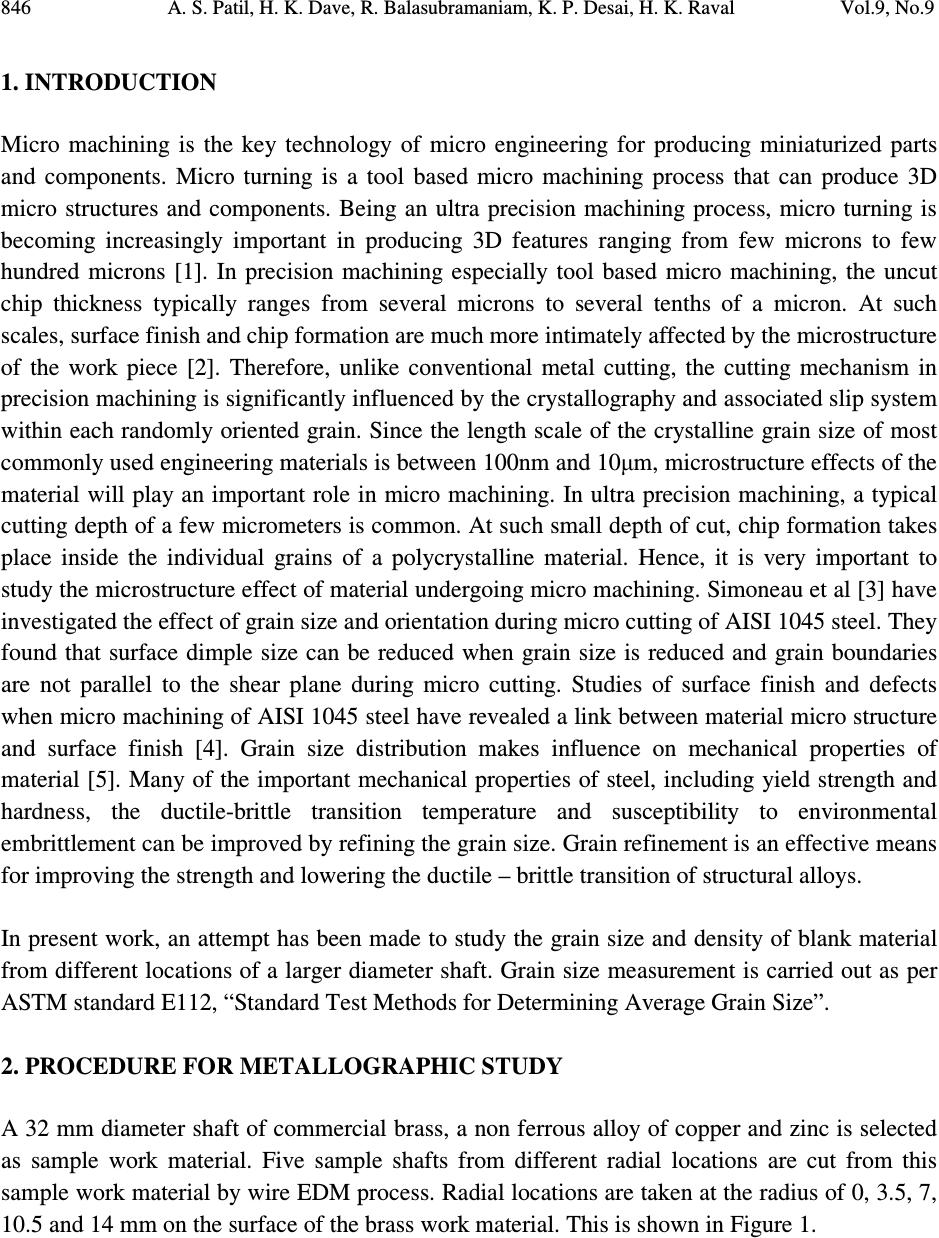 846 A. S. Patil, H. K. Dave, R. Balasubramaniam, K. P. Desai, H. K. Raval Vol.9, No.9 1. INTRODUCTION Micro machining is the key technology of micro engineering for producing miniaturized parts and components. Micro turning is a tool based micro machining process that can produce 3D micro structures and components. Being an ultra precision machining process, micro turning is becoming increasingly important in producing 3D features ranging from few microns to few hundred microns [1]. In precision machining especially tool based micro machining, the uncut chip thickness typically ranges from several microns to several tenths of a micron. At such scales, surface finish and chip formation are much more intimately affected by the microstructure of the work piece [2]. Therefore, unlike conventional metal cutting, the cutting mechanism in precision machining is significantly influenced by the crystallography and associated slip system within each randomly oriented grain. Since the length scale of the crystalline grain size of most commonly used engineering materials is between 100nm and 10µm, microstructure effects of the material will play an important role in micro machining. In ultra precision machining, a typical cutting depth of a few micrometers is common. At such small depth of cut, chip formation takes place inside the individual grains of a polycrystalline material. Hence, it is very important to study the microstructure effect of material undergoing micro machining. Simoneau et al [3] have investigated the effect of grain size and orientation during micro cutting of AISI 1045 steel. They found that surface dimple size can be reduced when grain size is reduced and grain boundaries are not parallel to the shear plane during micro cutting. Studies of surface finish and defects when micro machining of AISI 1045 steel have revealed a link between material micro structure and surface finish [4]. Grain size distribution makes influence on mechanical properties of material [5]. Many of the important mechanical properties of steel, including yield strength and hardness, the ductile-brittle transition temperature and susceptibility to environmental embrittlement can be improved by refining the grain size. Grain refinement is an effective means for improving the strength and lowering the ductile – brittle transition of structural alloys. In present work, an attempt has been made to study the grain size and density of blank material from different locations of a larger diameter shaft. Grain size measurement is carried out as per ASTM standard E112, “Standard Test Methods for Determining Average Grain Size”. 2. PROCEDURE FOR METALLOGRAPHIC STUDY A 32 mm diameter shaft of commercial brass, a non ferrous alloy of copper and zinc is selected as sample work material. Five sample shafts from different radial locations are cut from this sample work material by wire EDM process. Radial locations are taken at the radius of 0, 3.5, 7, 10.5 and 14 mm on the surface of the brass work material. This is shown in Figure 1. 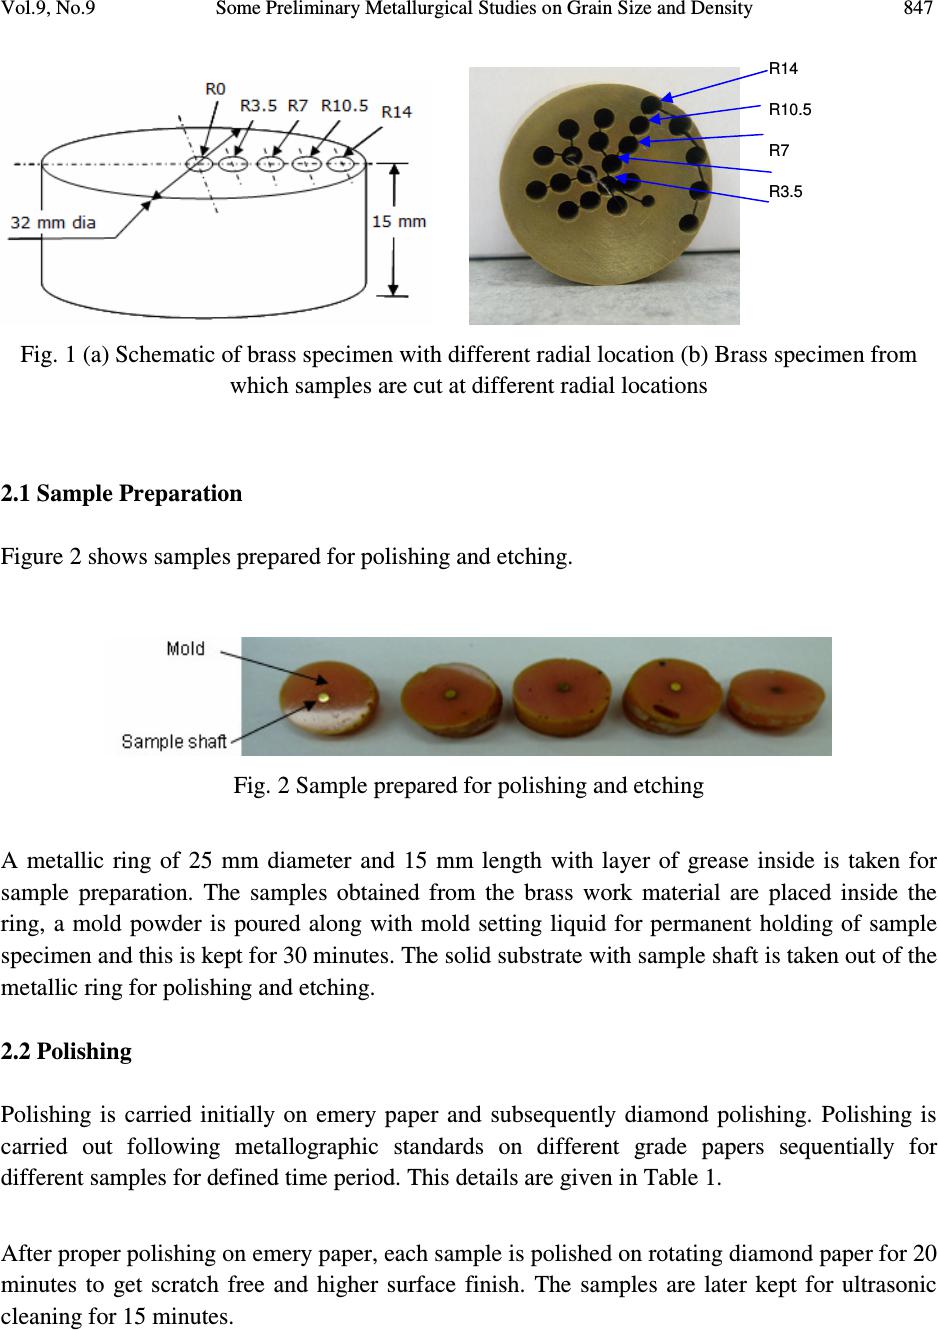 Vol.9, No.9 Some Preliminary Metallurgical Studies on Grain Size and Density 847 Fig. 1 (a) Schematic of brass specimen with different radial location (b) Brass specimen from which samples are cut at different radial locations 2.1 Sample Preparation Figure 2 shows samples prepared for polishing and etching. Fig. 2 Sample prepared for polishing and etching A metallic ring of 25 mm diameter and 15 mm length with layer of grease inside is taken for sample preparation. The samples obtained from the brass work material are placed inside the ring, a mold powder is poured along with mold setting liquid for permanent holding of sample specimen and this is kept for 30 minutes. The solid substrate with sample shaft is taken out of the metallic ring for polishing and etching. 2.2 Polishing Polishing is carried initially on emery paper and subsequently diamond polishing. Polishing is carried out following metallographic standards on different grade papers sequentially for different samples for defined time period. This details are given in Table 1. After proper polishing on emery paper, each sample is polished on rotating diamond paper for 20 minutes to get scratch free and higher surface finish. The samples are later kept for ultrasonic cleaning for 15 minutes. R14 R10.5 R7 R3.5 R0  848 A. S. Patil, H. K. Dave, R. Balasubramaniam, K. P. Desai, H. K. Raval Vol.9, No.9 Table 1 Different Grades of emery paper and time for polishing Sr. No. Grade of Emery paper Time required in minutes 1 Grade 220 30 2 Grade 320 25 3 Grade 400 25 4 Grade 600 25 2.3 Etching Etching is carried out by swabbing the etchant solution on sample for 10 – 15 second. The solutions used as etchant are given in Table 2. Table 2 Solutions used for etchant Sr. No. Solution Amount 1 NH 4 OH 30 ml 2 H 2 O 2 25 ml 2.4 Image Acquisition Microstructure of each sample is revealed on microscope at different magnifications. The images are taken on SEEBREZ measurement system at 300X magnification for grain size measurement. 3. GRAIN SIZE MEASUREMENT The methods for grain size measurement are described in ASTM standard E112 i.e. “Standard Test Methods for Determining Average Grain Size”. These methods have been described by Napolitanio [6]. The micro structural quantity known as ASTM Micro Grain Size Number n is defined by following relationship: N = 2 n – 1 where N is the number of grains per square inch measured at magnification of 100X. Commonly used methods for estimating the value of n are: (1) Comparison method (2) Grain counting method (3) Intercept method In present work, Grain counting method is used to determine the grain size number n and intercept method is used to determine average grain size L in microns. 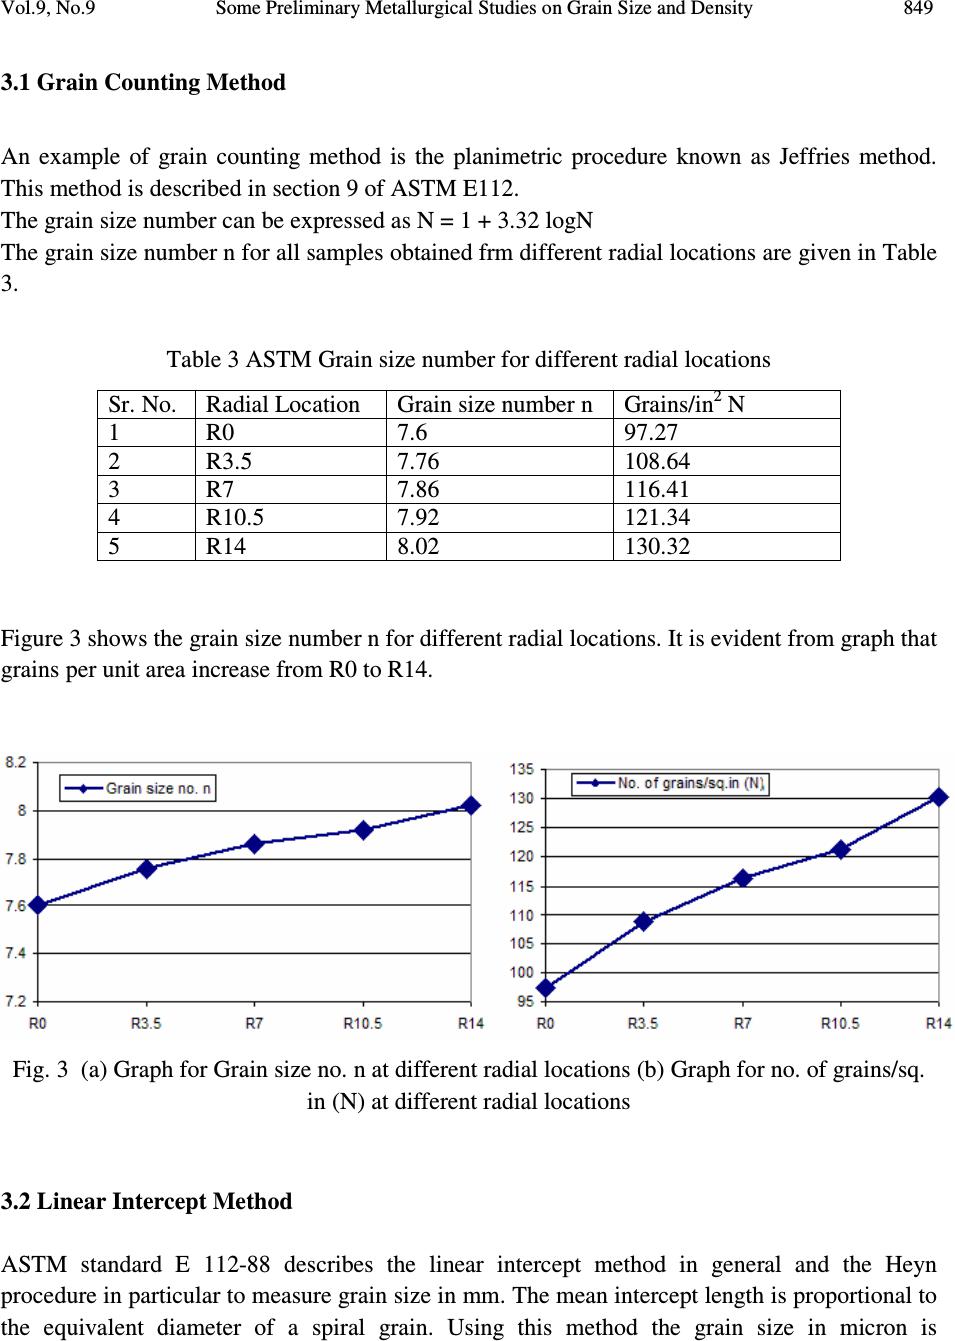 Vol.9, No.9 Some Preliminary Metallurgical Studies on Grain Size and Density 849 3.1 Grain Counting Method An example of grain counting method is the planimetric procedure known as Jeffries method. This method is described in section 9 of ASTM E112. The grain size number can be expressed as N = 1 + 3.32 logN The grain size number n for all samples obtained frm different radial locations are given in Table 3. Table 3 ASTM Grain size number for different radial locations Sr. No. Radial Location Grain size number n Grains/in 2 N 1 R0 7.6 97.27 2 R3.5 7.76 108.64 3 R7 7.86 116.41 4 R10.5 7.92 121.34 5 R14 8.02 130.32 Figure 3 shows the grain size number n for different radial locations. It is evident from graph that grains per unit area increase from R0 to R14. Fig. 3 (a) Graph for Grain size no. n at different radial locations (b) Graph for no. of grains/sq. in (N) at different radial locations 3.2 Linear Intercept Method ASTM standard E 112-88 describes the linear intercept method in general and the Heyn procedure in particular to measure grain size in mm. The mean intercept length is proportional to the equivalent diameter of a spiral grain. Using this method the grain size in micron is 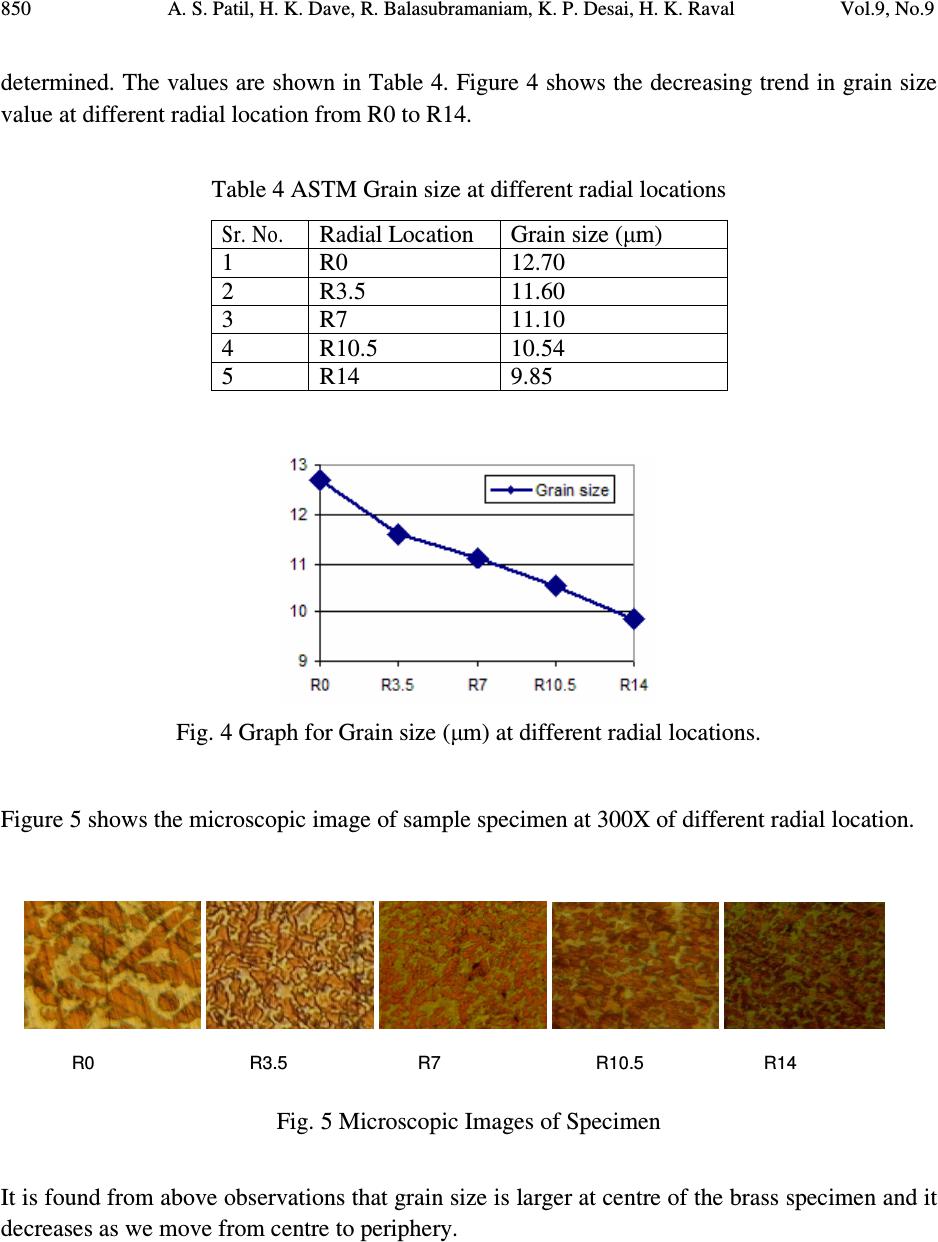 850 A. S. Patil, H. K. Dave, R. Balasubramaniam, K. P. Desai, H. K. Raval Vol.9, No.9 determined. The values are shown in Table 4. Figure 4 shows the decreasing trend in grain size value at different radial location from R0 to R14. Table 4 ASTM Grain size at different radial locations Sr. No . Radial Location Grain size (µm) 1 R0 12.70 2 R3.5 11.60 3 R7 11.10 4 R10.5 10.54 5 R14 9.85 Fig. 4 Graph for Grain size (µm) at different radial locations. Figure 5 shows the microscopic image of sample specimen at 300X of different radial location. Fig. 5 Microscopic Images of Specimen It is found from above observations that grain size is larger at centre of the brass specimen and it decreases as we move from centre to periphery. R0 R3.5 R7 R10.5 R14 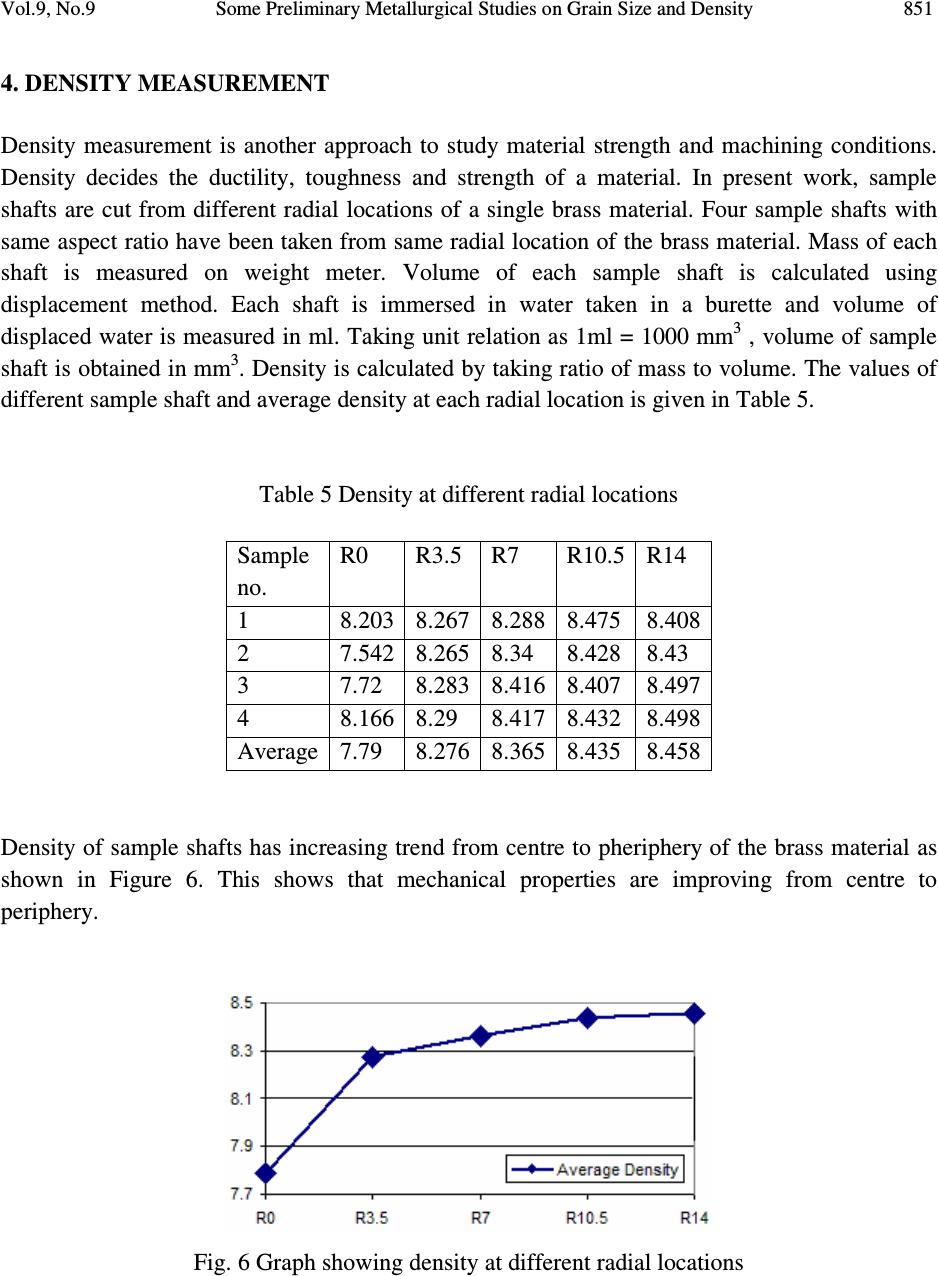 Vol.9, No.9 Some Preliminary Metallurgical Studies on Grain Size and Density 851 4. DENSITY MEASUREMENT Density measurement is another approach to study material strength and machining conditions. Density decides the ductility, toughness and strength of a material. In present work, sample shafts are cut from different radial locations of a single brass material. Four sample shafts with same aspect ratio have been taken from same radial location of the brass material. Mass of each shaft is measured on weight meter. Volume of each sample shaft is calculated using displacement method. Each shaft is immersed in water taken in a burette and volume of displaced water is measured in ml. Taking unit relation as 1ml = 1000 mm 3 , volume of sample shaft is obtained in mm 3 . Density is calculated by taking ratio of mass to volume. The values of different sample shaft and average density at each radial location is given in Table 5. Table 5 Density at different radial locations Sample no. R0 R3.5 R7 R10.5 R14 1 8.203 8.267 8.288 8.475 8.408 2 7.542 8.265 8.34 8.428 8.43 3 7.72 8.283 8.416 8.407 8.497 4 8.166 8.29 8.417 8.432 8.498 Average 7.79 8.276 8.365 8.435 8.458 Density of sample shafts has increasing trend from centre to pheriphery of the brass material as shown in Figure 6. This shows that mechanical properties are improving from centre to periphery. Fig. 6 Graph showing density at different radial locations 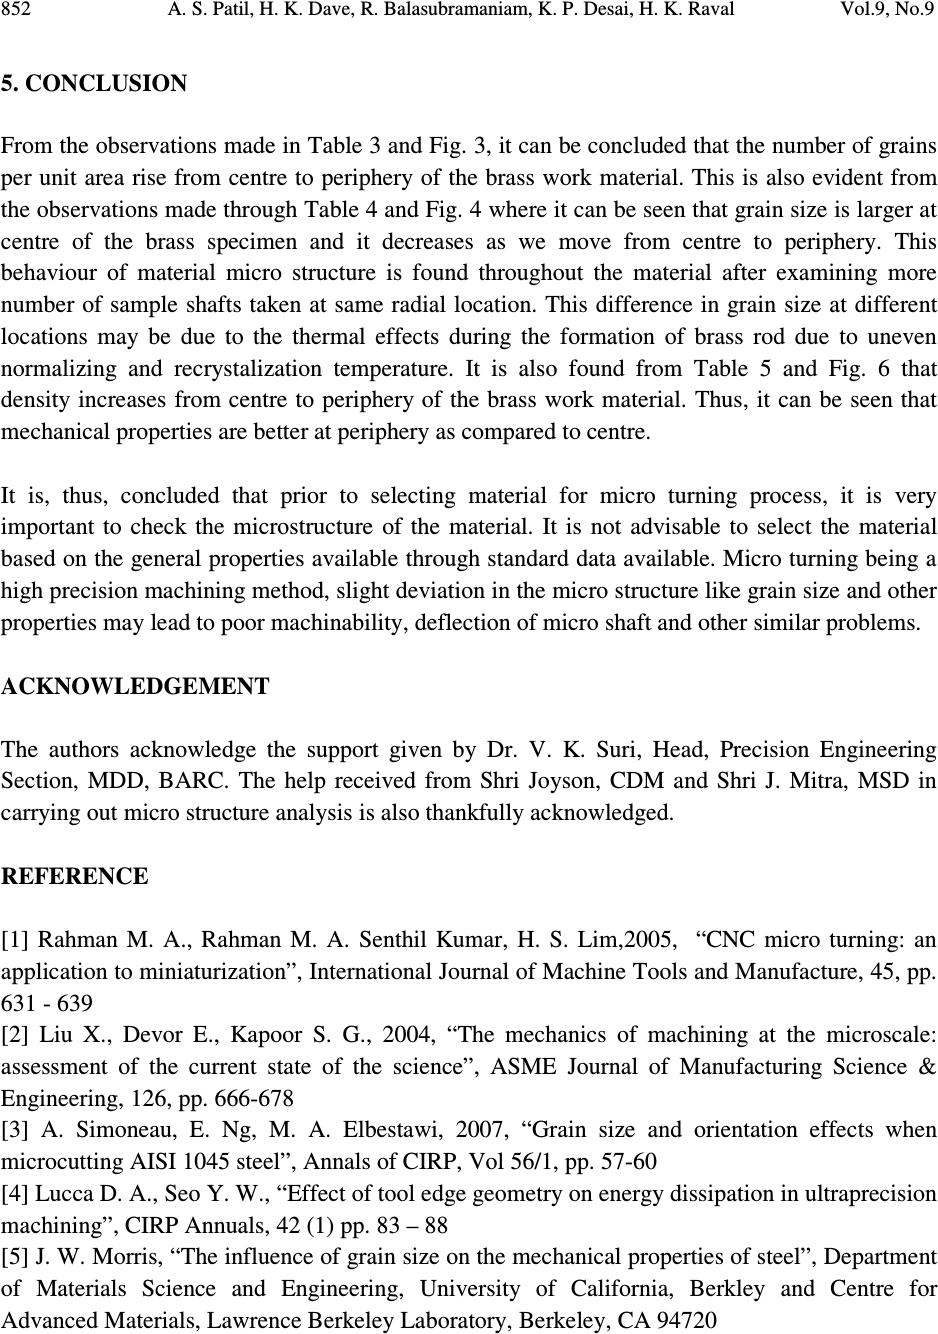 852 A. S. Patil, H. K. Dave, R. Balasubramaniam, K. P. Desai, H. K. Raval Vol.9, No.9 5. CONCLUSION From the observations made in Table 3 and Fig. 3, it can be concluded that the number of grains per unit area rise from centre to periphery of the brass work material. This is also evident from the observations made through Table 4 and Fig. 4 where it can be seen that grain size is larger at centre of the brass specimen and it decreases as we move from centre to periphery. This behaviour of material micro structure is found throughout the material after examining more number of sample shafts taken at same radial location. This difference in grain size at different locations may be due to the thermal effects during the formation of brass rod due to uneven normalizing and recrystalization temperature. It is also found from Table 5 and Fig. 6 that density increases from centre to periphery of the brass work material. Thus, it can be seen that mechanical properties are better at periphery as compared to centre. It is, thus, concluded that prior to selecting material for micro turning process, it is very important to check the microstructure of the material. It is not advisable to select the material based on the general properties available through standard data available. Micro turning being a high precision machining method, slight deviation in the micro structure like grain size and other properties may lead to poor machinability, deflection of micro shaft and other similar problems. ACKNOWLEDGEMENT The authors acknowledge the support given by Dr. V. K. Suri, Head, Precision Engineering Section, MDD, BARC. The help received from Shri Joyson, CDM and Shri J. Mitra, MSD in carrying out micro structure analysis is also thankfully acknowledged. REFERENCE [1] Rahman M. A., Rahman M. A. Senthil Kumar, H. S. Lim,2005, “CNC micro turning: an application to miniaturization”, International Journal of Machine Tools and Manufacture, 45, pp. 631 - 639 [2] Liu X., Devor E., Kapoor S. G., 2004, “The mechanics of machining at the microscale: assessment of the current state of the science”, ASME Journal of Manufacturing Science & Engineering, 126, pp. 666-678 [3] A. Simoneau, E. Ng, M. A. Elbestawi, 2007, “Grain size and orientation effects when microcutting AISI 1045 steel”, Annals of CIRP, Vol 56/1, pp. 57-60 [4] Lucca D. A., Seo Y. W., “Effect of tool edge geometry on energy dissipation in ultraprecision machining”, CIRP Annuals, 42 (1) pp. 83 – 88 [5] J. W. Morris, “The influence of grain size on the mechanical properties of steel”, Department of Materials Science and Engineering, University of California, Berkley and Centre for Advanced Materials, Lawrence Berkeley Laboratory, Berkeley, CA 94720  Vol.9, No.9 Some Preliminary Metallurgical Studies on Grain Size and Density 853 [6] Napolitanio R. E., “Measurement of ASTM Grain Size Number”, Material Science and Engineering, Iowa State University, available online on http://mse.iastate.edu |