Energy and Power Engineering
Vol.5 No.3(2013), Article ID:31001,16 pages DOI:10.4236/epe.2013.53019
A Model for Regional Energy Utilization by Offline Heat Transport System and Distributed Energy Systems —Case Study in a Smart Community, Japan
1Department of Civil Engineering and Architecture, Zhejiang University, Hangzhou, China
2Department of Architecture, The University of Kitakyushu, Kitakyushu, Japan
Email: happylamb68@hotmail.com
Copyright © 2013 Liyang Fan et al. This is an open access article distributed under the Creative Commons Attribution License, which permits unrestricted use, distribution, and reproduction in any medium, provided the original work is properly cited.
Received March 2, 2013; revised April 5, 2013; accepted April 17, 2013
Keywords: Smart Community; Demand Side Response; Distributed Energy System; Reutilize Factory Exhaust Heat; Offline Heat Transport System
ABSTRACT
Under the Kyoto Protocol, Japan was supposed to reduce six percent of the green house gas (GHG) emission in 2012. However, until the year 2010, the statistics suggested that the GHG emission increased 4.2%. What is more challenge is, after Fukushima crisis, without the nuclear energy, Japan may produce about 15 percent more GHG emissions than 1990 in this fiscal year. It still has to struggle to meet the target set by Kyoto Protocol. The demonstration area of “smart community” suggests Japanese exploration for new low carbon strategies. The study proposed a demand side response energy system, a dynamic tree-like hierarchical model for smart community. The model not only conveyed the concept of smart grid, but also built up a smart heat energy supply chain by offline heat transport system. Further, this model promoted a collaborative energy utilization mode between the industrial sector and the civil sector. In addition, the research chose the smart community in Kitakyushu as case study and executed the model. The simulation and the analysis of the model not only evaluate the environmental effect of different technologies but also suggest that the smart community in Japan has the potential but not easy to achieve the target, cut down 50% of the CO2 emission.
1. Introduction
Distributed energy systems (DES) have been drawing increasing attention as a substitute for grid in the lowcarbon society development [1,2]. Compared with the traditional centralized energy supply system, the distributed energy generations are easy for renewable energy using and can avoid the loss in energy delivery as well. However, as the integration of distributed energy generation become major concerns, one problem occurred that the conventional energy supply model, the unidirectional top-down grid could hardly be multipurpose to it [3]. It can only support the energy flow from the energy station to static users. A much smarter energy supply system will be desirable to support multi-direction energy flows that can dynamically switch between the user and local energy providers. It needs for more observable, accessible, and controllable network infrastructures. The future energy system, termed as smart grid, is the system emerging as these requires. It can intelligently and automatically control and optimize operations.
The Japanese motivation toward “smart grid” can be suggested in its new energy strategies (decided on Dec. 30th, 2009). Four areas are conducted to be the demonstration trial sites, known as “smart community”. In its concept, smart community is the basic unit in the smart evolution for the country [4]. The three main aspects of the smart community were distributed energy generation (DEG), distributed energy storage (DES), and demand side response (DSR) [5].
The DEG referred to the energy generation in the smart community, which is distributed into the power grid, including PV systems, micro-turbines and combined heat and power (CHP) plants. The prevailing of the distributed renewable resource was the focus for the Europe smart grid development. In some sense, the DEG can be the fundamental element that the energy generation and consumption can be carried out in an islanded manner. In another words, it is expected that the smart community only import a small amount of electricity from the outside, or even export their energy surplus to the neighborhood. Mathiesen et al. presented the analysis and results of a 100% renewable energy system by the year 2050 including transport. It revealed that 100% renewable energy systems would be technically possible in the future, and may be economically beneficial compared to the business-as-usual energy system [6].
The DES under the DSR control is a key underpinning of smart grid [5]. The intelligently controlled DES can serve to shift the electricity demand away from the peak periods, making the energy supply system more efficiently. Elma et al. developed model for stand-alone house that only supported by the renewable resource such as PV and wind system [7].
The energy system model for the smart community (grid) should convey the concept of DEG, DES and DSR. M. Welsch et al. demonstrated the flexibility and easeof-use of open source energy modeling System with regard to modifications of its code. It may therefore serve as a useful test-bed for new functionality in tools with widespread use and larger applications, such as MESSAGE, TIMES, MARKAL, or LEAP [8]. B. B. Alagoz et al. draw a framework for the future digital power grid concept and assess its viability in relation to volatile, diverse generation and consumption possibilities [5].
It can be found that the models mentioned above are mostly focused on electricity supply chain, among which the heat supply system hardly be mentioned. The heat supply should also convey the concept of DEG, DES and DSR. It can make use of onsite exhaust heat, such as recovery heat of CHP plant and nearby factory exhaust heat (FEH) [9]. It should be a dynamic controllable as well, which can smooth out the heat fluctuation.
In this paper, the research introduced a smarter heat supply infrastructure into the smart community, paralleled with the electricity supply system. The proposed district energy system includes the use of diverse renewable and untapped energy resource, demand-responsive intelligent management, and efficient energy delivery. It not constructed an intelligent distributed electricity supply chain system with PV and CHP plants, but also promoted DEG, DES and DSR concept on heat supply chain system.
An intelligent heat supply chain system should have efficient heat storage, delivering system for the heat sharing between buildings. Not like the electricity, the heat delivering always faced to two mean problems. With the traditional pipe system, it will be limited by the delivering distance because of the high infrastructure fee and heat lost during the way. Further, the traditional pipe system can hardly use the temperature lower than 90˚C. To come over these two problems, in this research, the model introduced the offline heat supply system (PCM) to realize the DEG, DES and DSR concept of heat.
Offline heat transport system is a truck with a container that full of phase change material. It was firstly developed by the German National Aerospace Laboratory in 1980, and put into practical use in the year 2001 by a chemical company in Frankfurt [10]. There were many researches that use the PCM material as a heat storage component in the buildings or other area [11-13]. Japan introduced this technology in 2003, and creatively used it as heat supply system [10]. In Aomori, the PCM heat transport system was firstly put into trial in the year 2008. It collected the exhaust heat from a sewage factory, transported and supplied to a fishing center. Now it becomes a business for the SANKI Company, termed as “Heat home delivery”. H. Kiyoto proposed the PCM system for exhaust thermal energy utilization [14]. As the smart system expect, this system can intelligently response to the demand side, switching between the energy provider and energy storage. It can collect the heat from the buildings where have surplus heat, store and then transport to the buildings where have heat demand.
This paper presented a model of a controllable, demand-responsive and balanced distributed energy systems network under the concept of smart community in Japan. Various technologies such as PV, CHP plant and PCM system were considered in the model. As a case study, the model was conducted into one demonstration smart community in Kitakyushu, Japan. Through the execution of the model, the research evaluated the environmental effect of every technology and estimated the potential of the smart community that whether the place can finally cut off 50% CO2 emission as it set.
2. Concept, Definition and Modeling
2.1. The Demand-Response Network Model
The demand-response network (DRN) model for smart community is a tree-like hierarchical model that comprises the community energy management system (CEMS), energy station (ES) and building energy management system (BEMS).
Figure 1 demonstrated the hierarchical model. The end users (managed by BEMS) reside at the bottom of the hierarchy. They will be prioritized and organized into groups. Every group is managed by one ES. The ES is at the lowest rank unit for the energy strategies decision that controls the introduction of DEG, DES and DSR. The ES collect information of the energy generation and consumption in the group and send signals to the CEMS. The CEMS connected with each other and formed city energy net work, which organized in a topological structure. ES is assumed to have two modes, the energy surplus mode (SUR) and the energy insufficient mode (INS). The ES can dynamically switching its mode depending
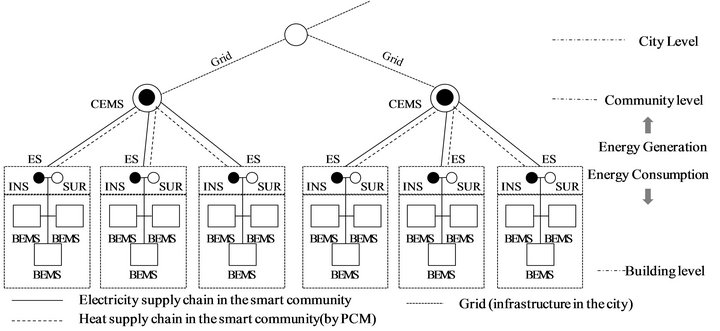
Figure 1. The tree-like hierarchy of DRS.
on the energy generation and consumption in the group. There mode signal will send to CEMS who collected and distribute the energy.
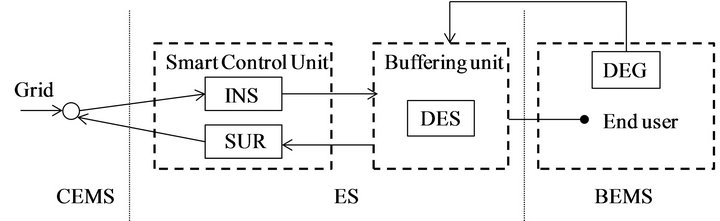
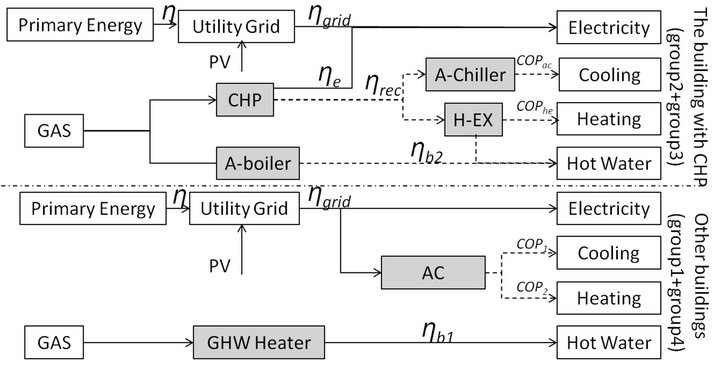
The proposed DRN system in this research is different from the smart grid that it not only has electricity supply chain but also has heat supply chain as well. Figure 2(a) illustrated the electricity supply chain. The DES in DRN system only acts as a back up and the buffer unit. The energy produced by DEG is supplied to the end users from the buffer unit. When the energy generated by DEG is more than the energy consumption in the group, the ES will in SUR mode and become an energy supplier to other ES. Oppositely, the ES will in INS mode when the energy generated by DEG is less than the energy consumption, and become an energy consumer. Figure 2(a) illustrated the heat supply chain. Similar with the electricity supply chain, it has a buffering unit that comprises the PCM tank and the heat exchanger. Under the INS mode, the CEMS will transport heat to the ES by trucks that with PCM tank. Under the SUR mode, the tank in the buffer unit will collect the surplus heat and be transported to other ES when it received the order from the CEMS. The mode signals in the heat supply and that in the electricity supply are self-governed.
2.2. District Energy Using Concept and Operation Hypothesis
As the DRN system illustrated before, the building in the community will be divided into Groups. Every group is managed by ES, the basic unit to make energy strategies. Figure 3 described the district energy using concept.
• Introduction of the renewable energy: all the buildings will be introduced with PV system. The electricity generated by PV system will be preferentially used by the building themselves and the left electricity will be sent back to the grid.
• Introduction of the CHP system: The CEMS will characterize buildings by their demand types. The buildings have both high electricity consumption and heat consumption (such like commercial buildings and public buildings) will be introduced with the CHP system, named as CHP group. The capacity of the CHP system is set as electricity peak load of the group. The buildings without CHP system is considered as Non-CHP (NCHP) group. The electricity produced by CHP plant will satisfy them first and then send the left electricity to NCHP system. The CHP group will generate all their own demand beside PV. Therefore, as the DRN described before, the electricity of these groups are only in SUR mode. The NCHP group will be in INS mode if PV cannot afford their electricity consumption.
The CEMS will manage the model signal, control and dispatch the electricity. It will preferentially use the DEG, thus maximum the output of CHP plant. The electricity produced by PV can sell back to grid but the electricity produced by CHP plant cannot. In that case, when the electricity generated by CHP more than the district electricity demand, the CEMS will restrict the CHP output. It will preferentially chose the CHP plant with higher efficiency and lower down the CHP plant with low efficiency. If the efficiencies of the CHP plants are the same, CEMS will cut down the CHP plants in same rate.
• Reutilization of the onsite exhausts heat and the FEH: the recovery heat of the CHP system will be preferentially used by the group first. However, if the recovery heat is more than the heat demand, the heat supply mode of the ES will turn to SUR. This part of heat surplus will be collected by PCM.
Further, the CEMS will select out the FEH resource
 (a)
(a)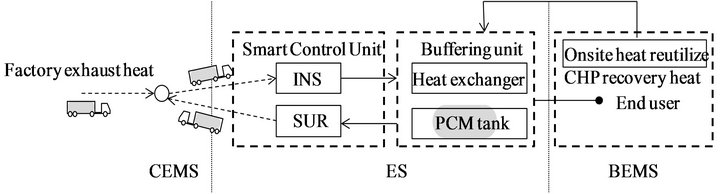 (b)
(b)
Figure 2. DRN system energy supply chain; (a) Electricity supply chain; (b) Heat supply chain.
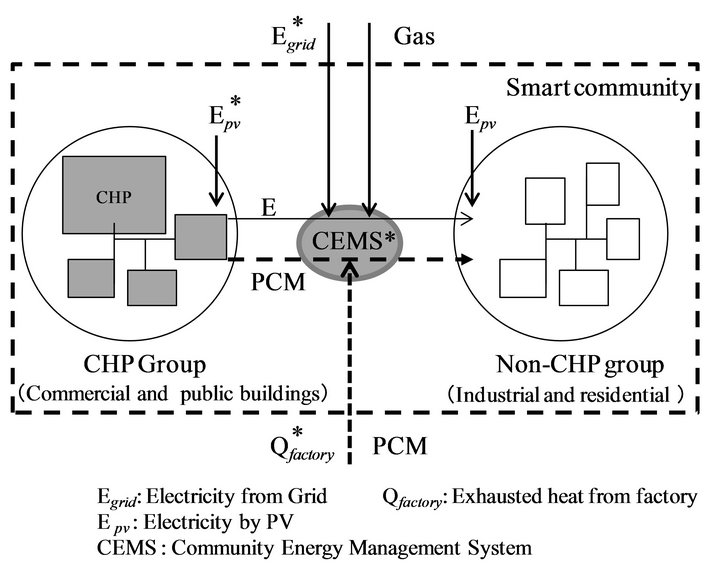
Figure 3. District energy using concept.
based on the characteristic of the PCM system, which collects the FEH and utilizes it in the community.
The onsite CHP exhaust heat and the FEH stored in the PCM system will be preferentially used. The CEMS will distribute the heat according to the SUR signal from the ES. It will be sent to the ES which have the higher heat insufficient amount.
2.3. Energy Balance Management and Simulation Modeling
The energy balance management and the simulation flow are conducted as Figure 4. The simulation of the DRN system is also a bottom-up model. Firstly, based on the district zoning, the research will estimate the building energy consumption and described profiles by groups. As the tree-like hierarchy described in the second part, buildings in one group will be managed by one ES. Secondly, the CEMS will characterize the groups by its energy consumption character and introduce proper DEG in every ES, some are with CHP system but some are not. The simulation separated them into CHP group and the NCHP group. Thirdly, the research executed the simulation.
During the simulation, ES will dynamically switch between the INS mode and the SUR mode by estimating the energy consumption and the generation. Finally, the research will calculate the primary energy consumption and evaluate the environmental effect of the every technology as well as the whole community.
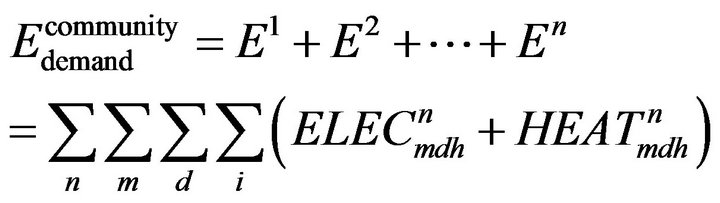
1) Estimation of district energy consumption The energy consumption of the whole community
 is calculated as Equation (1)
 (1)
(1)
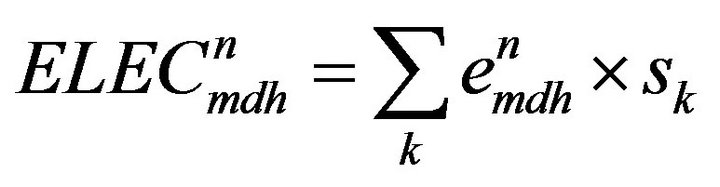
 is hourly electricity load, calculated as Equation (2)
 (2)
(2)
 is hourly heat load, calculated as Equation (3)
 (3)
(3)
n is the group number;
m is month; d is date, h is hour;
E1 En is the energy consumption of every group;
 and
and  is the energy consumption unit in Kyushu area, Japan [15];
k is the building function;
sk is the building area for one function (k).
2) The electricity balanced management
Figure 5 illustrated the simulation model for the electricity balance. The buildings will preferentially use the electricity produced by PV. The electricity produced by PV system in one group  is calculated as Equation (4):
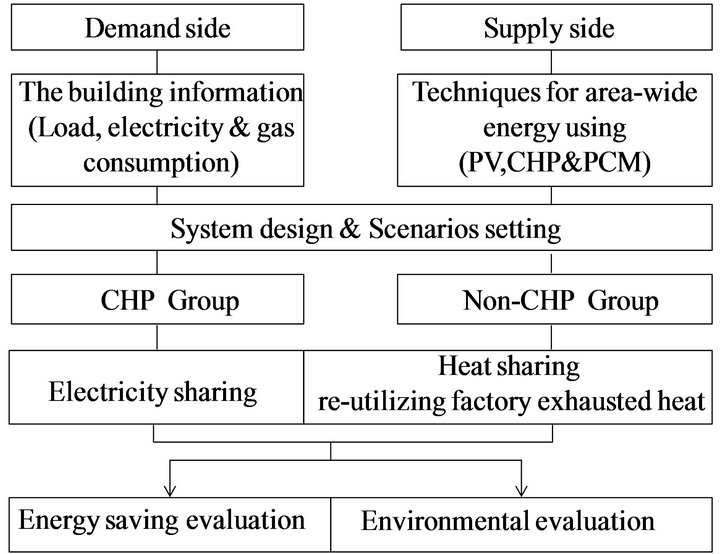
Figure 4. The simulation flow.
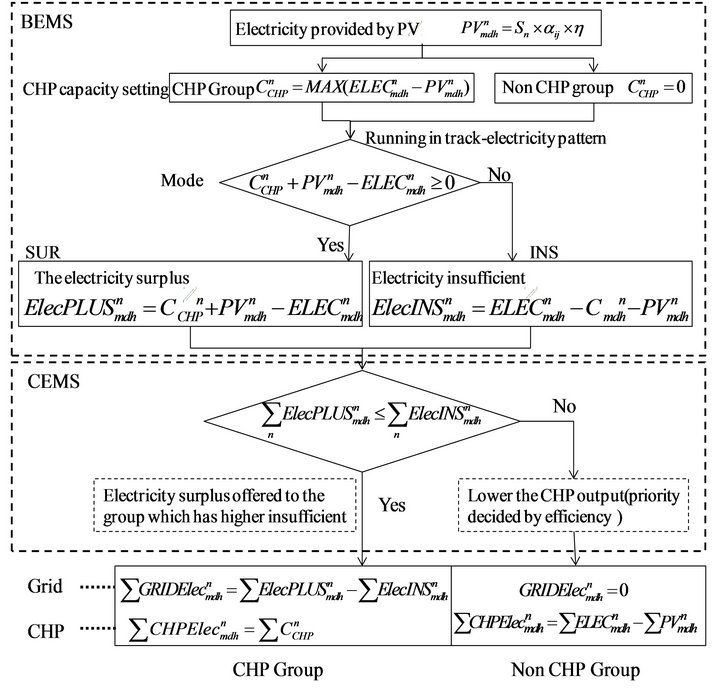
Figure 5. The electricity balanced model.
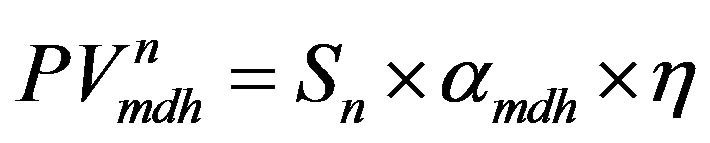 (4)
(4)
sn is the area for PV penal in a group (n);
 is the hourly sun radiation rate [16];
η is the efficiency of the PV penal [16].
The CHP capacity  is decided as Equation (5):
 (5)
(5)
The ES will decide the mode by the prediction of electricity load profile of the CHP system, PV system and electricity demand.
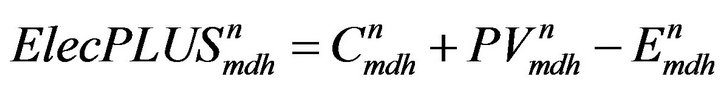
When , the group is in SUR mode. The expected surplus electricity
  is calculated as Equation (6)
 (6)
(6)
On the contrary, when the group is in INS model, the expected electricity insufficiency  is calculated as Equation (7)
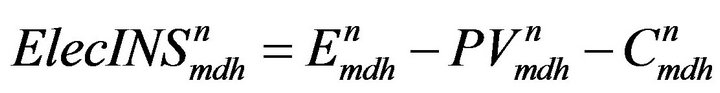 (7)
(7)
If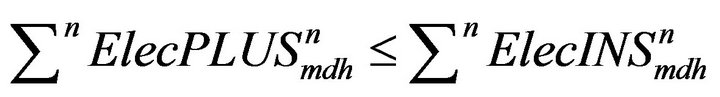 , CEMS would lower down the total CHP output (prior use the equipment with higher efficiency). Under this situation, there was no electricity supplement from the grid. The electricity generated by CHP plant
  is calculated as Equation (8):
 (8)
(8)
If , the surplus electricity from CHP group will be offered to the NCHP group. Under this situation, the electricity from the grid
 is calculated as Equation (9):
 (9)
(9)
Electricity offered by CHP is calculated as Equation (10):
 (10)
(10)
3) The design and modeling for the PCM system
• PCM for collecting the FEH According to the system parameter, economically the system can utilize heat with in 135 km and 20 km round trip [14]. The CEMS will economically select out the possible utilized rescource, and make a plan for the PCM system. The collecting schedule of the PCM trucks should match with the factory working hour. It will become more complecate as the factory heat resource increase. Considering the various factors for making the plan, the research assumed that the FEH collected would be transported to the demand side and used in the following day.
The number of the tanks for collecting FEH used in one day (x) is desided by the capacity (listed in Table 1 [17]). It should satisfy equation (11):
 (11)
(11)
 is the capacity for the PCM tank;
 is the daily factory exhaust of the selected resources;
The exhaust heat that can be used in the demand side is limited by the energy lost during the heat storage, transport and heat exchange. CEMS will estimate it and select out the proper resource. The amount of the heat  that can use in the demand side is as Equation (12)
 (12)
(12)
 is the overall efficiency of the PCM system, set as 0.9 in this research [16].
• PCM for the heat delivery between the groups ES will use the estimated consumption pattern for the consistent prediction and send the mode signal to CEMS.
For every group, CHP recovery heat  is as Equation (13):
 (13)
(13)
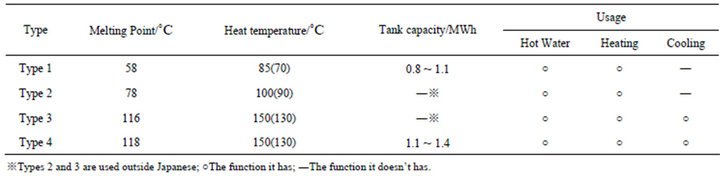
Table 1. The type and parameters of the PCM tank.
 is the electricity generating efficiency of CHP plant;
 is the heat recovery efficiency of CHP plant;
If , the ES is in SUR mode and the expected value of heat surplus
  is as Equation (14):
 (14)
(14)
If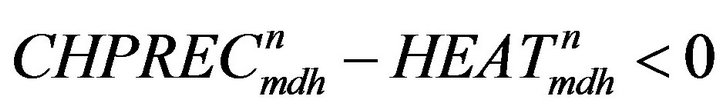 , the ES is in INS mode and the expected value heat insufficient
  is as Equation (15):
 (15)
(15)
Every day, the PCM system will carry the FEH and input into the community from the first peak time in the morning, set as h0. During the day, the system will preferentially use the heat stored in the PCM and release it before the next day. Therefore, every day at the time h0, the heat amount stored in the PCM system is reset.
The amount of stored heat energy in the PCM that can be supplied to the ES in SUR mode at  time in one group
  is as Equation (16)
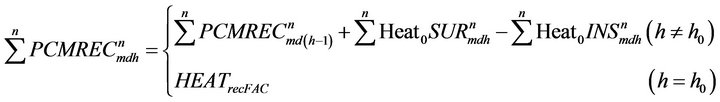 (16)
(16)
The total amount of PCM truck (p) should satisfy Equation (17)
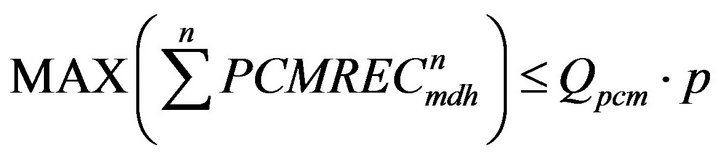 (17)
(17)
 is an function to determine the maximum value of the stored heat in PCM system by the expected value.
4) The heat balanced management
Figure 6 illustrated the heat balanced management.
The collected heat in the PCM system including the recovery heat of CHP system and FEH are used for heating, cooling and hot water in the community. It is also managed by CEMS following total quantity priority that supplied to the group, which had lager amount of heat insufficient, MAX .
.
With the use of the waste heat that collected by the PCM system, the heat insufficient  is as Equation (18):
 (18)
(18)
When , the heat demand can be satisfied with the onsite exhaust heat reutilization that the heat-source equipment
  is not required as Equation (19):
 (19)
(19)
When , the heat-source equipment is used as supplement. The heat offered by the heat-source equipment is as Equation (20):
 (20)
(20)
 is the efficiency of heat source equipment.
2.4. Assessment Index Setting
1) Energy saving ratio ESR is energy saving ratio, defined as Equation (21):
 (21)
(21)
For CHP system, the primary energy input is as Equation (22):
 (22)
(22)
 is the electricity input in CHP system;
 is the gas input to the CHP plant and boiler.
For conventional system, the primary energy input is as Equation (23):
 (23)
(23)
 is the electricity input in conventional system;
 is the gas input to conventional system for hot water;
 is primary energy consumption unit of grid in Japan (11.4 MJ/kWh);
  is the primary energy consumption unit of gas (45 MJ).
2) CO2 reduction ratio
 is CO2 reduction ratio, defined as Equation (24):
 is CO2 emission for CHP system, calculated as Equation (25);
 (25)
(25)
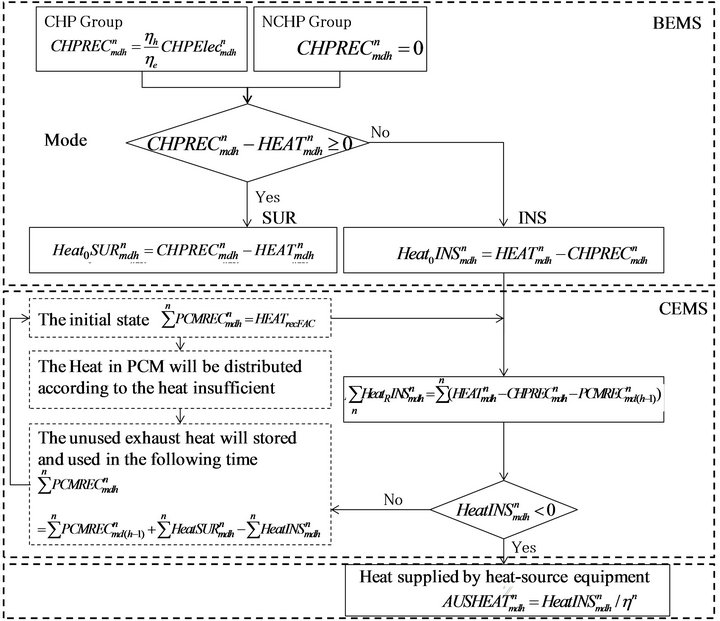
Figure 6. Heat supply calculation flow.
 is CO2 emission for conventional system, calculated as Equation (26).
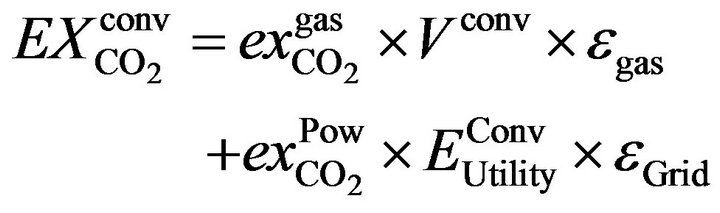 (26)
(26)
 is the CO2 emission unit for gas in Japan (13.8 g-C/MJ);
 is the CO2 emission unit for grid in Japan (153 g-C/kwh).
3. Numerical Study
3.1. Research Site
Kitakyushu lied in the northern part of Kyushu, the westernmost of the four main islands in the Japanese archipelago. It used to be one of Japan’s four leading Industrial regions and contributed greatly to the rapid economic growth of Japan.
The smart community creation project is newly launched in Yahata Higashisa district, where used to be the factory district of the steel company. The government invested 16.3 billion yen over the five-year period from 2010 to 2014. It has already cut 30% of the CO2 emission compared with the other place in the city. However, the target for the smart community was to cut 50% of the existing emission, still 20% need to get [4].
3.2. Energy Load
Detailed knowledge about energy end-use loads is important for the energy system design and optimization. In this study, the hourly load demand for electricity, cooling, heating and hot water have been calculated according to the energy consumption unit (the system in Japan that displays energy consumption intensities) of various buildings in Kyushu, Japan [15]. As the method descried in part 2, the whole community is divided into 4 groups. Figure 7 displayed the image of community and district zoning.
Figure 8 described the detailed hourly load profiles for every group in summer (Aug.), winter (Jan.), spring and autumn time (May). The energy consumption profile firmly related with the building function.
1) The group4 is the residential area, thus the peak of the energy consumption comes during the night. The group1 also has considerably higher energy consumption compared with groups2 and 3, because there is a hotel in the group.
2) The commercial group (group2) has a higher energy consumption during the day, but almost no energy consumption during the night.
3) The hot water load is higher in residential group (group4), but lower in groups2 and 3.
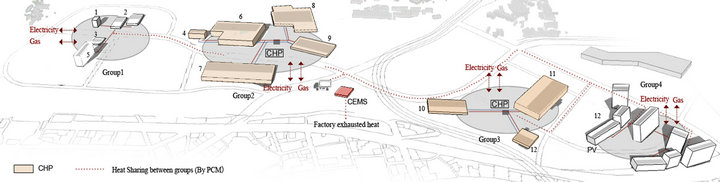
Figure 7. The community model and energy system.
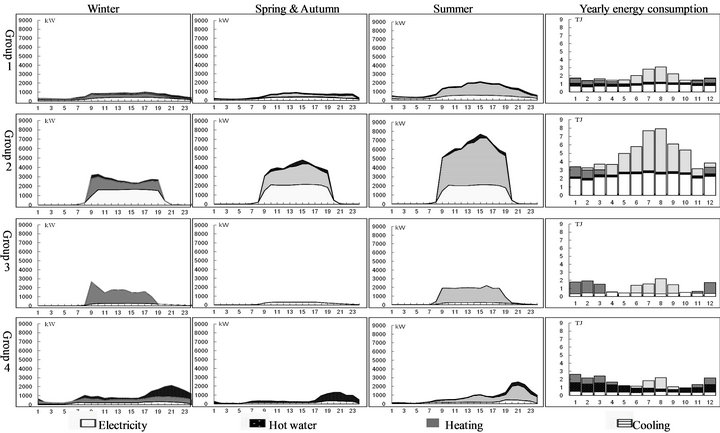
Figure 8. The district energy consumption.
3.3. FEH Load
It is reported that the factory exhaust heat in Japan can satisfy the heat consumption of all the residential buildings for five years [17]. In that case, there is a great potential to make use of the factory exhaust heat. It can cut the energy consumption on the civil side as well as the CO2 emission on the factory side.
Another important input to the energy system is the reutilization of the FEH. It collected by PCM system and used in the community for heating, cooling and hot water. The study adopted the database of the FEH based on GIS built in the research before and selected out the four potential factory resources (within 20 km) [18]. Usually, the temperature for FEH is higher than 300˚C and daily exhaust heat is around 38.9 GJ. The tank type with the capacity of 1.4 MWh will be introduced into the system. As this research only discussed the environmental effect of the PCM system, thus it is supposed that there are enough tanks for collecting all the exhaust heat (the heat of the factory and the unused CHP recovery heat).
3.4. DEG Technologies and District Energy System
This district is the demonstration area that the latest technologies are expected to be introduced into the area. The smart community is also undertaken the Kitakyushu Hydrogen Town project. The project marks as the worldfirst attempt to use a pipeline recycling the hydrogen generated in the iron manufacturing and operating the fuel cells as an energy supply to the district. The demonstration testing is processed jointly by Fukuoka Prefectural and city gas utilities [19]. The pipeline connected with the hydrogen station and hydrogen fuel cells that installed in buildings in this district. These fuel cells generate electricity by combining hydrogen and oxygen. Table 2 showed DEG technologies assumed in this study and their properties, including gas engine (GE), fuel cell (FC), Hydrogen fuel cell (HFC) and PV. All equipments are city gas fired.
3.5. Setting of Cases
In order to investigate the effect of technologies in the DRN, the following cases are assumed for analysis.
Base case: conventional system. Base case indicated conventional energy supply system. The electricity load is satisfied by grid. The buildings also used air conditioner for heating and cooling. The commercial buildings, office and public buildings use multiple air-conditioning systems and residential buildings use room air-conditioner. The hot water load is satisfied by gas boiler fired by city gas.
Case 1: The conventional system combined with PV systems. In this case, the community still keeps the conventional system, but facilitated with PV. The electricity will be supplied by PV system, or by grid, or by combined of both. The electricity from the PV system will be used by the buildings themselves, and left electricity will be send back to the grid.
Case 2: Individually introduced DEG systems, displayed in Figure 9(a). In case 2, the CHP plants with GE are introduced in groups2 and 3. The CHP plants and PV systems can satisfy the electricity load of these two groups. The thermal load can also be supplied by the recovery heat of the CHP plants and the deficiency supplemented by gas boiler. In this case, the electricity and recovery heat of the CHP plants cannot supply to other groups or return back to the grid. Therefore, the NCHP groups still get electricity from the PV and grid, keep as the conventional system.
Case 3: DRN system without using factory exhaust heat, described in Figure 9(b). In the DRN system, the community uses the same DEG technologies with case 2, but controlled and managed by CEMS. Under the CEMS, the electricity produced by the CHP plants not only be used for the CHP group but also supplied to the NCHP group as well. The recovery heat of the CHP group will be used in the CHP group first and then recycled by the PCM system. The CEMS distributed the heat that stored in the PCM system with thermal insufficient and surplus profile of every group.
Case 4: DRN system with the utilization of the FEH, as Figure 9(b). Besides the technologies and DRN system that assumed in cases 3 and 4 also make use of the FEH by PCM system. The PCM system collected the exhaust heat from the factory resource that set in part 3
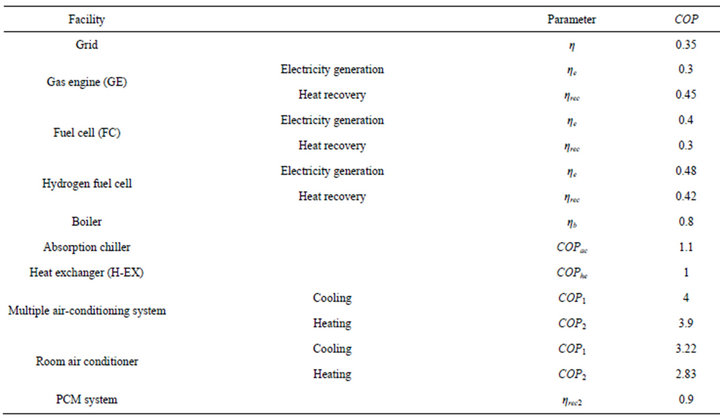
Table 2. Technical parameters of system.
 (a)
(a)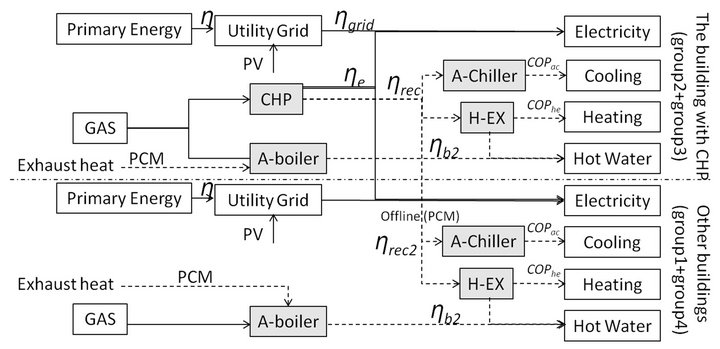 (b)
(b)
Figure 9. Case setting.
and transport it to the CEMS in the community. Besides the surplus CHP recovery heat, this part of heat will also be distributed by CEMS.
Cases 5 and 6: the DRN system with the CHP plants of FC and HFC. Beyond the DRN systems that build in cases 4 and 5 introduced the CHP plant of FC and case 6 introduced HFC.
4. Results and Discussions
4.1. The Effect of Electricity Sharing in DRN System
Figure 10 is the electricity balance in the community with the individually introduced DEG systems (case 2) and the DRN system (case 3). Both of the cases use CHP plant with GE and PV. The comparison between the two cases can show the effect of the electricity sharing between them. It can suggest that PV system can provide 35% of the community electricity consumption and the individual CHP plant can produce 41% electricity. By electricity sharing, the CHP group can offer 2 GWh electricity to the Non CHP Group, which occupied 52% of their electricity consumption. As a whole, the community
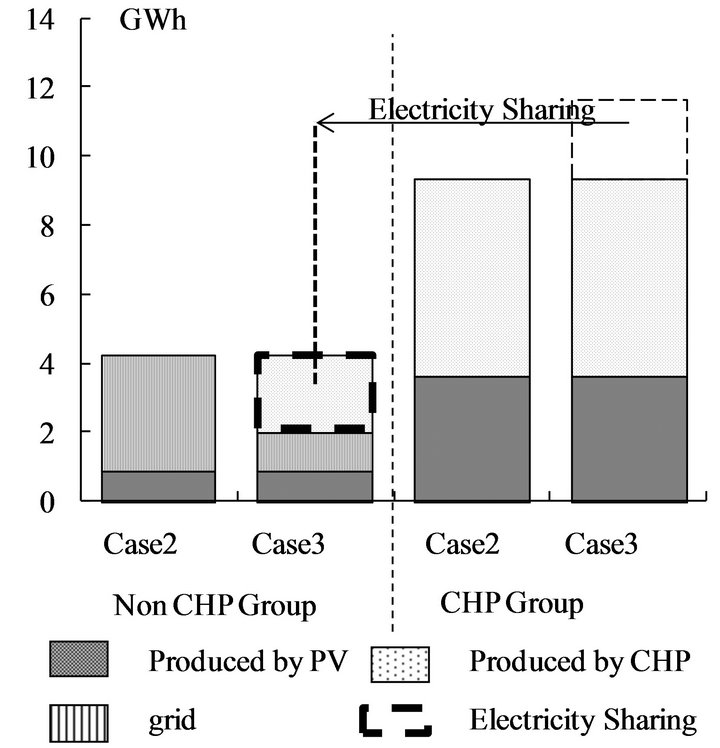
Figure 10. Yearly electricity balances of cases 2 and 3.
can produce 58% of the electricity by CHP, and only 7% from the grid, while the individual system need 24%.
As we know, the electricity produced by DEG has less energy loss during the electricity delivery. Therefore, the system can save more energy as it gets less electricity from the grid. In the DRN system, the CEMS can operate the CHP plants and distribute the electricity to the whole community. Therefore, it will increase the output and working hours of the CHP plant reduce the electricity from the grid.
The electricity sharing used in DRN system can shift the electricity demand from the peak. Just as Figure 11 suggested, without CHP plant, the peak hour should come during the noontime, but now it shift to 8 o’clock in the morning and 18 o’clock in the afternoon. Further, from the city level, the less relay on the grid will alleviate electricity shortage especially during the peak hours. That means with the DRN, the city can smooth out the electricity flucuate.
4.2. The Effect of Heat Sharing in DRN System
The DEG with CHP plants not only reduce the energy loss, but can make use of the recovery heat as well. In case 2, the individually CHP system can only use the recovery heat by the CHP group itself. However, under the CEMS, in case 3, the DRN system can distribute the recovery heat to other group with the PCM system. In that case, it improved the utilization rate of the recovery heat. As Figure 12 illustrated, the individual CHP has 37.9 GWh recovery heat every year and 31.1 GWh is used for thermal consumption in CHP group. In DRN system, the yearly CHP recovery heat is 47.3 GWh, among which 6.4 GWh heat is offered to the NCHP group. This part of heat occupied 33.8% of heat consumption in NCHP. Under this condition, 85% of the CHP recovery heat can be reused which possessed 68.8% of the community heat demand.
Figure 13 illustrates the daily heat balance in the community, taking the wintertime as example. The plus value means the heat surplus of each group. Groups2 and 3 are the CHP groups and their heat surplus means the left heat after their own utilization. PCM system can collect this part of heat and used for heat supply in other groups. The minus part means the heat insufficient. For Groups2 and 3, it means the heat deficient after utilizing the CHP recovery heat. Figure 13 can suggest that the first peak of the heat insufficient comes on 9 o’clock in the morning and the peak of the heat surplus comes on 19 o’clock. Groups2 and 3 have no heat demand from 19 o’clock to the next 9 o’clock, thus during this time all the CHP recovery heat will be supplied to NCHP group. From the 9 o’clock to 19 o’clock, group3 has the largest heat insufficient, thus the stored heat in the PCM system will be preferentially supplied to group3. That means the heat sharing not only between the CHP group and NCHP group, but also between the CHP groups. After the CEMS collects the heat and stores in the PCM system, it only distributes the heat according to the heat insufficient volume.
4.3. The Effect of Using Factory Exhausted Heat
Until now, the city of Kitakyushu still has 1412 factories and industries, which have exhaust heat. The existing research put forwards questionnaire to all the factories, estimating and setting up a database by GIS for the yearly exhaust heat. As the result, the yearly exhausted thermal energy is about 18,000 TJ.
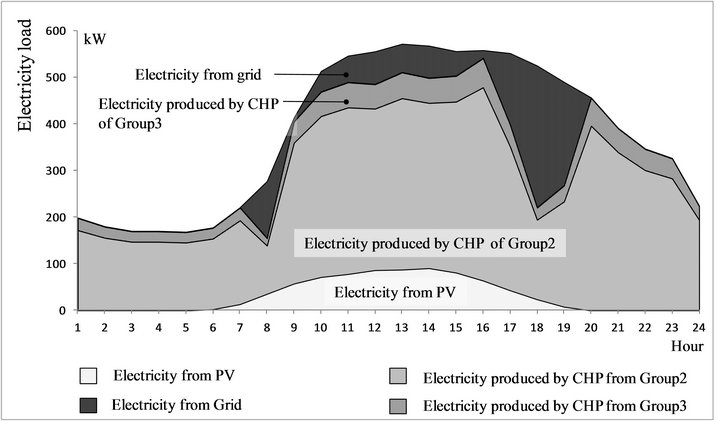
Figure. 11. Daily electricity balance of group1 (summer).
For this community, four factories were set as the resources and the total yearly heat amount that can offer to the community was 14.2 TJ (38.9 GJ per day) [18].
In this research, it is set that exhaust heat will be averagely supplied to the community from the first peak hour in the set time range. Figure 14 is the relationship between time range and the heat volume, as well as the energy saving result. It can suggest that in this case, 6 hours is the optimal time range and it can cut 42.8% of primary energy beyond the PV and CHP system.
4.4. The Effect of Introduction of Different CHP Plant
As the techniques of CHP plant improved, the environmental performance of the system changed as well. The gas engine and the fuel cell have already been widely used in Japan. As a trial project, the community introduced hydrogen fuel cell. Figure 15 is the energy saving ratio of these three kinds of CHP plant. The fuel cell and gas engine had similar effect when the capacity is low, but after 1000 kW, the fuel cell improved obviously. The hydrogen fuel cell had a higher efficiency on both electricity generating (48%) and heat recovery (42%), thus the system can reach an optimal energy saving ratio around 53%.
4.5. The Assessment of Environmental Effect from the Community Side
Figure 16 is the low carbon ratio for every technology. By introduced the PV system and the CHP plant (gas engine), it can cut off 29.4% of the carbon emission. The networking CHP system can reduce energy consumption
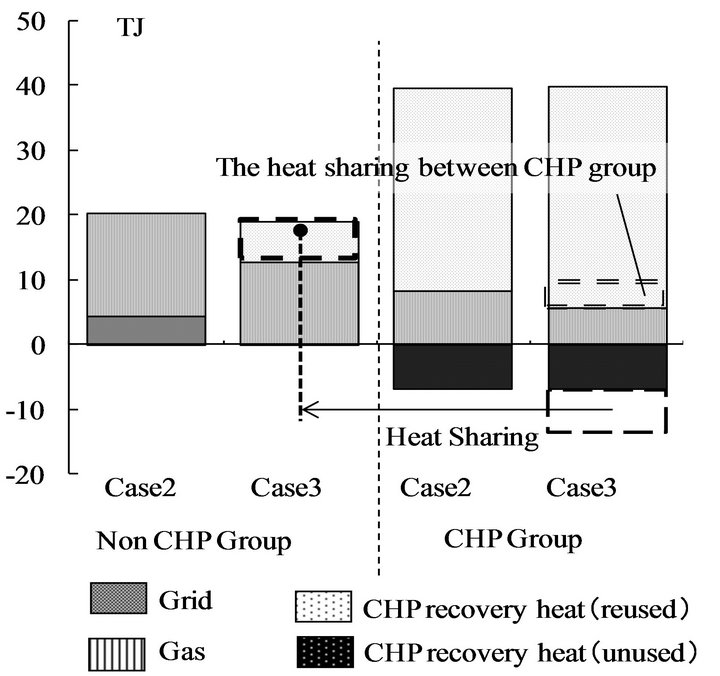
Figure 12. Yearly heat balances of cases 2 and 3.
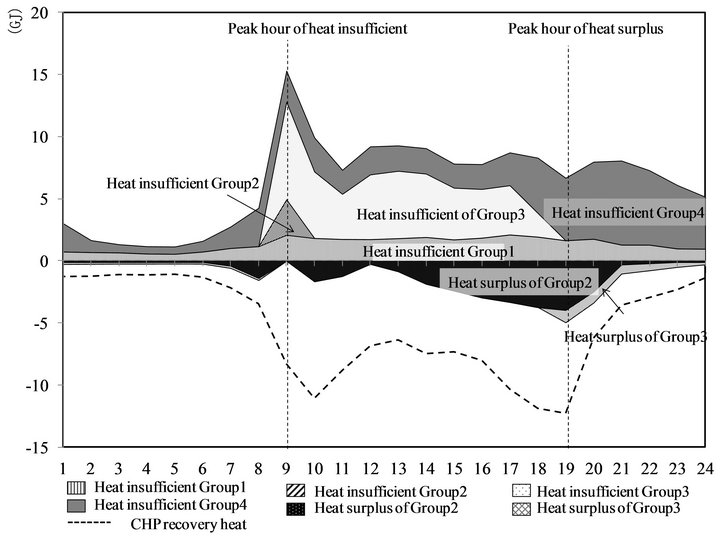
Figure 13. Daily heat balances of the community.
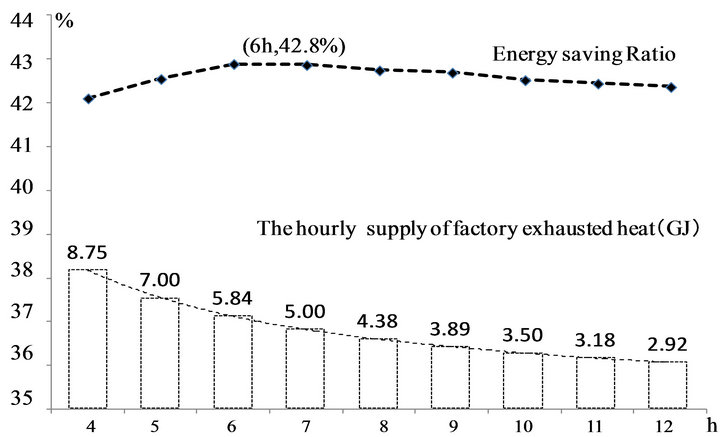
Figure 14. Energy saving ratio and the supply span of factory exhaust heat.
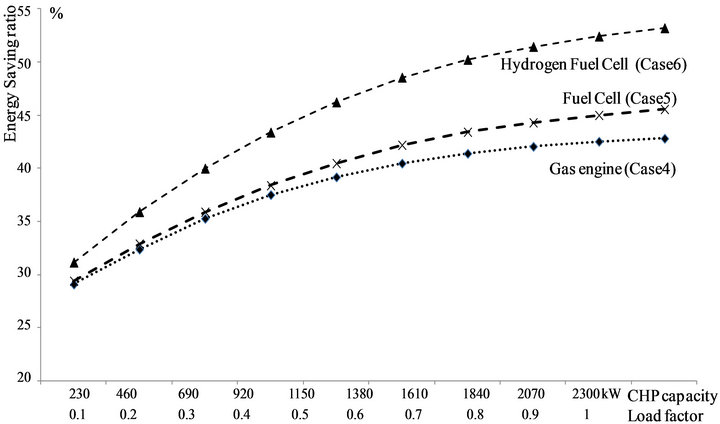
Figure 15. Energy saving ratio with different kind of CHP plant.
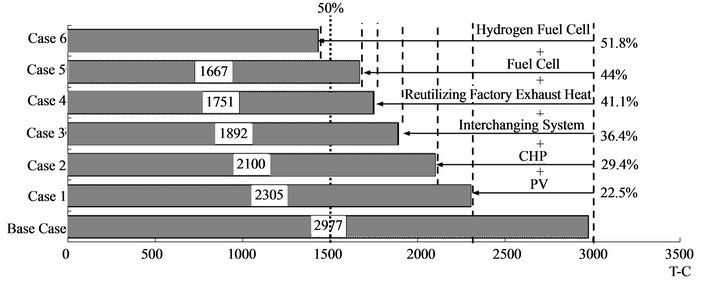
Figure 16. Yearly CO2 emissions for cases.
and cut off another 7% carbon emission. Beside these, the reusing of factory rejected heat energy can cut off 41.1% CO2 emission. With the introduction of fuel cell and hydrogen fuel cell, it is proved that the community can get 51.8% CO2 emission reduction ratio.
5. Conclusions
The study proposed a DRN energy system model for smart community in Japan. One innovation is that the model not only has a smart grid but also has a smart heat energy supply chain by PCM system. The PCM system controlled by CEMS conducted the heat sharing between buildings. In that way, it can maximize onsite use of CHP recovery heat. Further, this model promoted a collaborative energy utilization mode between the industrial sector and the civil sector. The introduced PCM system will also collected the exhaust heat from the nearby factory.
1) The CEMS can dispatch the energy, including heat and electricity in the district, by the information received from the ES. The electricity sharing between the groups can improve the working hour and output of the CHP system. In that case, the distributed energy system can satisfy 93% of electricity consumption by itself. It enhances the reliability and independence of the energy system, shift the energy consumption away from the peak hour as well. The heat sharing can also enhances the independence of the energy system and satisfy the 68.8% of the thermal demand by CHP recovery heat.
2) There are different kinds of CHP plants, as gas engine and fuel cells. They have different characteristics, different electricity generation efficiency and heat recovery efficiency. The latest HFC, firstly under trail in this district, is the new kind CHP plant that can obviously improved the environmental effect of the system.
3) In general, the introduction of nature energy resource (PV) can cut 22% of the CO2 emission. The introduction of CHP systems can cut around 30% CO2 emission. Beyond that by DRN control, the district energy sharing can cut 36.4% CO2 emission. The using of factory exhausted heat and the development of the CHP plant can help the district finally reach the target, that cut more than 50% of the primary energy consumption and the CO2 emission.
REFERENCES
- C. Sollia, R. Anantharaman, A. H. Strømmana, X. Zhanga and E. G. Hertwicha, “Evaluation of Different CHP Options for Refinery Integration in the Context of a Low Carbon Future,” International Journal of Greenhouse Gas Control, Vol. 3, No. 2, 2009, pp. 152-160. doi:10.1016/j.ijggc.2008.07.008
- R. Evans, “Environmental and Economic Implications of Small-Scale CHP,” Energy Policy, Vol. 21, No. 1, 1993, pp. 79-91. doi:10.1016/0301-4215(93)90211-W
- M. Wissner, “The Smart Grid—A Saucerful of Secrets?” Applied Energy, Vol. 88, No. 7, 2011, pp. 2509-2518. doi:10.1016/j.apenergy.2011.01.042
- Government’s New Growth Strategy. http://www.kantei.go.jp/jp/sinseichousenryaku/sinseichou01.pdf
- B. B. Alagoz, A. Kaygusuz and A. Karabiber, “A UserMode Distributed Energy Management Architecture for Smart Grid Applications,” Energy, Vol. 44, No. 1, 2012, pp. 167-177. doi:10.1016/j.energy.2012.06.051
- B. V. Mathiesen, H. Lund and K. Karlsson, “100% Renewable Energy Systems, Climate Mitigation and Economic Growth,” Applied Energy, Vol. 88, No. 2, 2011, pp. 488-501. doi:10.1016/j.apenergy.2010.03.001
- O. Elma and U. S. Selamogullari, “A Comparative Sizing Analysis of a Renewable Energy Supplied Stand-Alone House Considering Both Demand Side and Source Side Dynamics,” Applied Energy, Vol. 96, 2012, pp. 400-408. doi:10.1016/j.apenergy.2012.02.080
- M. Welsch, M. Howells, M. Bazilian, J. F. DeCarolis, S. Hermann and H. H. Rogner, “Modelling Elements of Smart Grids—Enhancing the OSeMOSYS (Open Source Energy Modelling System) Code,” Energy, Vol. 46, No. 1, 2012, pp. 337-350. doi:10.1016/j.energy.2012.08.017
- R. S. Adhikari, N. Aste and M. Manfren, “Multi-Commodity Network Flow Models for Dynamic Energy Management—Smart Grid Applications,” Energy Procedia, Vol. 14, 2012, pp. 1374-1379. doi:10.1016/j.egypro.2011.12.1104
- Introduction of Offline Heat Transport System, SANKI. http://www.sanki.co.jp/product/thc/thc/point.html
- R. Niemi, J. Mikkola and P. D. Lund, “Urban Energy Systems with Smart Multi-Carrier Energy Networks and Renewable Energy Generation,” Renewable Energy, Vol. 48, 2012, pp. 524-536.
- Heat Supply System Offline Using the Latent Heat Storage Material-Heat Transformer Container System, 2009.3, JEFMA No. 57, pp. 53-55.
- M. Medrano, M. O. Yilmaz, M. Nogués, I. Martorell, J. Roca and L. F. Cabeza, “Experimental Evaluation of Commercial Heat Exchangers for Use as PCM Thermal Storage Systems,” Applied Energy, Vol. 86, No. 10, 2009, pp. 2047-2055. doi:10.1016/j.apenergy.2009.01.014
- H. Kiyoto, “Study on the Exhaust Thermal Energy Utilization by Using the PCM Transportation System,” Summaries of Technical Papers of Annual Meeting Architectural Institute of Japan, 20 July 2008, pp. 747-748.
- O. Lab, “Consumption Unit of Electricity, Heating, Cooling and Hot Water,” Waseda University, Tokyo, 2002.
- H. Ren, “Effect of Carbon Tax and Electricity Buy-Back on the Optimal Economic Adoption of PV System for Residential Buildings,” Journal of Environmental Engineering, Vol. 622, 2007, pp. 49-55.
- Introduction of Offline Heat Transport System, SANKI. http://www.sanki.co.jp/product/thc/thc/point.html
- L. Y. Fan, “Potential Analysis on the Area-Wide Factory Exhaust Thermal Energy Utilization by PCM Transportation System in a Recycling-Oriented Community,” Summaries of Technical Papers of Annual Meeting, Architectural Institute of Japan, Kyushu Chapter, Vol. 51, 1 March 2012, pp. 341-344.
- Highlighting JAPAN July 2011, “Stepping Stones to ‘Smart’ ness,” 2011. dl.gov-online.go.jp/public_html/gov/pdf/hlj/.../12-13.pdf