Open Journal of Energy Efficiency
Vol.2 No.2(2013), Article ID:33002,10 pages DOI:10.4236/ojee.2013.22010
Energy Efficiency Analysis of White Button Mushroom Producers in Alburz Province of Iran: A Data Envelopment Analysis Approach
Department of Agricultural Machinery Engineering, Faculty of Agricultural Engineering and Technology, University of Tehran, Karaj, Iran
Email: *atabfat@ut.ac.ir
Copyright © 2013 Habib Reyhani Farashah et al. This is an open access article distributed under the Creative Commons Attribution License, which permits unrestricted use, distribution, and reproduction in any medium, provided the original work is properly cited.
Received January 1, 2013; revised February 4, 2013; accepted March 1, 2013
Keywords: Energy; Technical Efficiency; Data Envelopment Analysis; White Button Mushroom Production
ABSTRACT
The aim of this study was to determine energy consumption pattern and specifically to measure and benchmark the efficiency for white button mushroom production in Alburz province of Iran. The data used in this study were collected by interviewing mushroom producers in the region. In the surveyed farms, average yield and total energy consumption were calculated as around 208.46 kg∙ton−1 compost and 133.25 MJ∙ton−1, respectively. The results revealed that fossil fuel (40.43%), compost (30.45%) and electricity (27.42%) consumed the bulk of energy. The results of DEA approach also showed that 12 and 14 farmers had efficiency score of unity. Electricity and fossil fuel were found to be used in excess in target mushroom production farms. Moreover, we came to the conclusion that the total energy consumption can be reduced to 120.15 MJ∙ton−1 for mushroom production in which diesel fuel energy (50.89 MJ∙ton−1), FYM (37.32 MJ∙ton−1) and electricity (30.34 MJ∙ton−1) energies were considerably significant.
1. Introduction
Button mushroom (Agaricus bisporus) is regarded as a high protein, low-calorie food with medicinal properties [1]. It is the most widely cultivated, harvested, and distributed mushroom in the world. Mushrooms contain substances of high nutritional value such as minerals and a variety of vitamins. White button mushroom is the most prevalent mushroom in the world [2] and needs to be fresh or dried for various uses in the food industry. Mushrooms also have very low energy levels; five medium-sized button mushrooms added together only have twenty calories (80 kilojoules).
Agricultural sector between other parts has a significant place in producing food requirements of the growing population of the world. On the other hand, agriculture itself uses a large amount of energy in form of inputs in order to produce larger amounts of energy output. Based on these facts, a harmony between resource scarcity and food safety is needed in practice. Namely, sustainability should be introduced to today’s agricultural systems. A sustainable agriculture, like all other sustainable development, must meet the needs of the present without diminishing opportunities for the future.
Energy use in agriculture has developed in response to increasing populations, a limited supply of arable land, and a desire for an increasing standard of living. As the population continues to rise, the agricultural sector may face the risk of breaking down in the near future from a lack of energy. However, reducing the dependence on fossil fuels will gain in importance as efforts continue to reduce GHG emissions and as fuel supplies eventually do dwindle. Fortunately, the development of alternative farming methods and advances in biotechnology and mechanization of production systems will likely achieve this end. An example of fossil fuel use in agriculture is to manufacture inputs such as fertilizers, pesticides, and herbicides and also to power industrial farm machinery.
Apart from the above mentioned factors in regard of energy importance, increasing input costs consisting fuel cost, irrigation cost, application of chemicals and transportation cost has caused high a raise in energy costs.
Although considerable data exist in the literature regarding the energy consumption for energy consumption in button mushroom production system such as kiwi [3], apple [4,5], grapes [6], sunflower [7,8], oilseed [9], greenhouse vegetable production [10,11], little information is available on the analysis of energy consumption in white button mushroom production.
Efficiency was defined by Sherman [12] as the ability to produce the outputs using a required minimum resource level. In production, efficiency is defined as the ratio of weighted sum of outputs to inputs or as the actual output to the optimal output ratio. The weights for inputs and outputs are estimated to the best advantage for each unit so as to maximize relative efficiency. In order to measure the optimal input or output amounts, it is necessary to first specify the production frontier [13].
Iranian agricultural sector needs taking a serious look at the ways of energy expenditure and improving efficiency on farms to reduce their ongoing costs and accordingly improve their bottom line. A wrong belief among farmers causing the inefficient use of energy sources is the excess use of resources to get higher productivity, particularly when they are priced low, free or accessible in plenty [14].
One of the proposed and well-established ways to evaluate the relative technical efficiency (TE) of entities by some mathematical programming models is Data Envelopment Analysis (DEA) [15]. By applying this approach firstly the efficient and inefficient decision making units (DMUs) would be detected and then the optimized amount of inputs use can be decided [16].
In recent years, DEA has become renowned in agricultural researches. Recently, Sefeedpari [16] used DEA to assess the technical efficiency in industrial dairy farms of Tehran province in Iran. In this study the efficiency of farmers based on the constant and variable returns to scale models were found to be 0.88 and 0.93, respectively. It was also concluded that DEA was a useful tool to improve the productive efficiency of farms. In another study [17], DEA was applied to investigate the efficiency of individual farmers and identify the efficient units in citrus production in Spain. Mousavi-Avval et al. [18] optimized energy use and energy costs for apple production using data envelopment analysis. They reported that 54% of farmers are technically efficient. The technical efficiency score was calculated as 0.78. Kiwi production was investigated by Mohammadi et al. [19] from the view of energy efficiency. The technical, pure technical and scale efficiencies of farmers were calculated as 0.942, 0.993 and 0.948, respectively. In spite of the careful literature review on DEA application in agricultural production systems, no study was found with this criterion in edible mushroom production.
Considering the importance of efficient use of energy in Iran, the main objective of the present study was to investigate the energy efficient farms during operations of white button mushroom production in Alburz province of Iran. To achieve this, as the first step, energy use pattern for button mushroom was specified. Also, it ranks efficient and inefficient farmers and sketches the optimum footprints of input use and its potential to energy saving.
2. Material and Methods
2.1. Case Study Region Selection and Data Collection
This study was conducted in Alburz province of Iran within 35˚31' and 36˚32' north latitude and 50˚18' and 51˚18' east longtitude with total area of 17,953 km2 (1.09% of total country area) [20]. This province is situated 1300 meter above sea levels. Karaj is the central city of this province. Constitution of the farms of agricultural products in this city has caused the upgradability of this sector in recent years. The adjacency to markets of Tehran province and its geographical location can be enumerated as the main reasons of high demand for agricultural and livestock products in Alburz province [21].
Required data used in this study were obtained from all button mushroom producers in Alburz province, Iran. The survey to collect quantitative information was conducted on energy inputs used for the production of white button mushroom in the production period of October 2011-December 2011. In fact, this period is a representative of a production period of button mushroom which takes about two months and the collected data were then converted and so they can be attributed to the average input use in a whole year. To achieve this, a comprehensive and definite questionnaire was provided and completed by farmers. In order to use the needed software programs (DEA Solver), we were supposed to collect sufficient data in accordance to number of input and output parameters (at least 20 DMUs). Hence, questionnaires were sent to the whole white button mushroom production units (26 units).
2.2. Energy Balance Analysis Method
Data collection included the quantity of various inputs use in the form of chemicals, chemical fertilizers, farmyard manure (FYM), diesel fuel, natural gas, electricity, water for irrigation, human labor or machinery and equipment. A standard procedure was used to convert each agricultural input and output into energy equivalents. The energy equivalent may thus be defined as the energy input taking into account all forms of energy in agricultural production. The energy equivalents were computed for all inputs and outputs using the conversion factors (obtained from previous studies) indicated in Table 1. Accordingly, the energy equivalents were calculated by multiplying the quantity of the inputs used and output

Table 1. Energy equivalent coefficients of inputs and output in white button mushroom production in Alburz, Iran.
harvested per hectare with their conversion factors.
It should be noted here that energy equivalent of human labor varies considerably, depending on the approach chosen; it must be adapted to the actual living conditions in the target region [28]. In this study the energy coefficient of 1.96 MJ∙h−1 was applied. It means only the muscle power used in different field operations of crop production. Also, in order to make an analysis of the embodied energy in the farm machinery, it was assumed that the embodied energy of tractors and agricultural machinery be depreciated during their economical life time [29]; Also, the embodied energy in machinery was calculated by multiplying the depreciated weights of machinery (kg∙ha−1) with their energy equivalents (MJ∙kg−1) using the following Equation (1) [30]:
 (1)
(1)
where ME is the machinery energy per unit area (MJ∙ha−1); G is the machine mass (kg); Mp the production energy of machine (MJ∙kg−1), t is the time that machine used per unit area (h∙ha−1) and T is the economic life time of machine (h).
For compost energy, we did not find any energy equivalent coefficient indicating energy content coefficient of compost fertilizer as a significant input in white button mushroom production. For this reason, we in study were supposed to measure this coefficient. For this purpose, the compost production process was thoroughly investigated and its energy use was determined. The energy inputs to compost production were human labour, diesel fuel, electricity, stationary equipment, wheat straw, animal manure, urea fertilizer and water. Here, also, each input use amount has been multiplied by their energy equivalents and finally the energy consumption for each kilogram of compost was found.
2.3. Data Envelopment Analysis Technique
In this study, in order to evaluate the technical, pure technical and scale efficiencies of individual farmers, a nonparametric method of DEA was employed. It is believed that farmers use similar inputs and produce the same product (white button mushroom) and operate in a relatively homogeneous region (e.g., topography, soil type, climatic conditions, etc.). In the above methodology, the energy consumed from different energy sources including: human labor, machinery, diesel fuel, fertilizer, chemicals, water for irrigation, electricity and natural gas were defined as input variables; while, the white button mushroom yield was the single output parameter; also each farmer called a DMU. Data analysis was done by DEA Solver software.
In DEA, two models would be applied in this study including CCR and BCC models. Charnes et al. [31] developed the CCR DEA model by and assumes constant returns to scale. On the other hand, the BCC model developed by Banker et al. [32] and assumes variable returns to scale conditions. Also applying each model would lead to a specific efficiency value. Efficiency score obtained from CCR model is called technical efficiency and the efficiency value calculated by BCC model is pure technical efficiency. Scale efficiency gives quantitative information of scale characteristics; it is the potential productivity gain from achieving optimal size of a DMU. In Equation (2), scale efficiency is calculated by the relation between technical and pure technical efficiencies as below [33]:
 (2)
(2)
In DEA, there are two different analyses for converting an inefficient unit to efficient one. An inefficient DMU can be made efficient either by minimizing the input levels while maintaining the same level of outputs (input oriented), or, symmetrically, by increasing the output levels while holding the inputs constant (output oriented). In fact, the input-oriented is commonly utilized in DEA applications because efficiency profitability depends on the efficiency of operations. Besides that, a farmer is able to take the control of inputs use more easily than output level [15,34].
Let the DMUj to be evaluated on any trial be designated as DMUo (o =1, 2, ∙∙∙, n). To measure the relative efficiency of a DMU based on a series of n DMUs, the model is structured as a fractional programming problem as follows [35]:
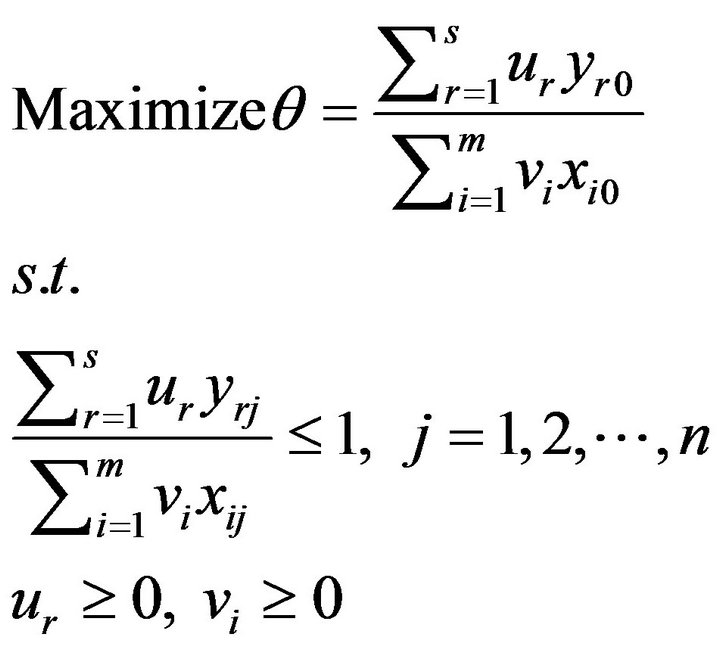 Model (1)
Using a linear programming (LP) problem, Model (1) can be equivalently written as follows [35]:
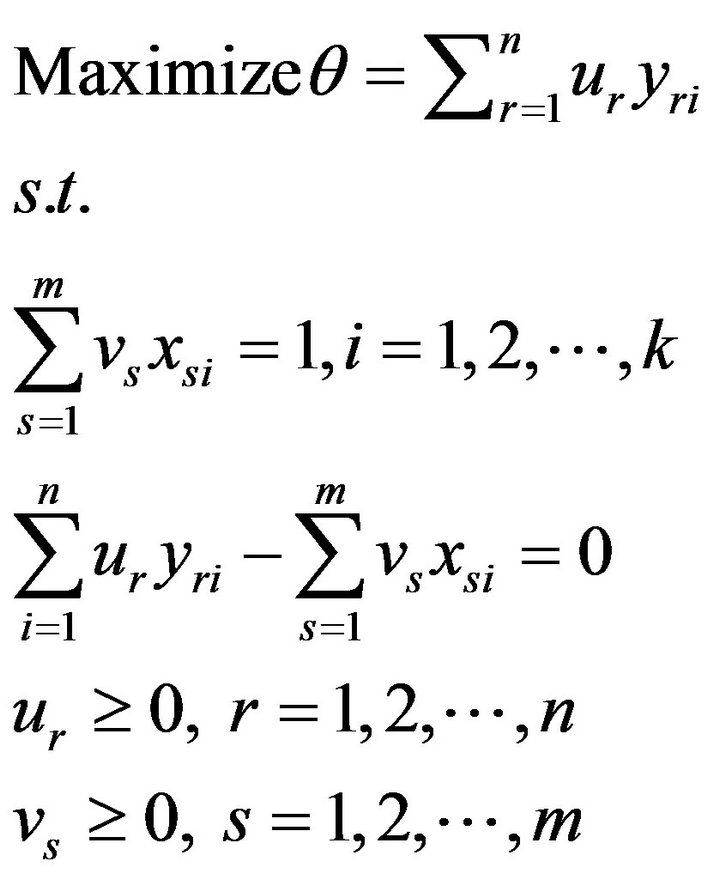 Model (2)
where θ is the technical efficiency. Dual linear programming (DLP) problem is simpler to solve than Model (2) due to fewer constraints. Mathematically, the DLP can be written in vector matrix notation [35]:
 Model (3)
where yo is the s × 1 vector of the value of original outputs produced and xo is the m × 1 vector of the value of original inputs used by the oth DMU. Y is the s × n matrix of outputs and X is the m × n matrix of inputs of all n units included in the sample. λ is a n × 1 vector of weights and θ is a scalar with boundaries of one and zero which determines the technical efficiency score of each DMU. Model (3) is known as the input-oriented CCR model. It assumes constant returns to scale (CRS), inferring that an increase in inputs would lead in a proportionate increase in outputs.
The results of DEA models divide the DMUs into two sets of efficient and inefficient units; the inefficient units can be ranked according to their efficiency scores. Since DEA lacks the capacity to discriminate among efficient units; a number of methods are in use to enhance the discriminating capacity of DEA [36]. In this study, the benchmarking method was applied to overcome this problem. In this method, an efficient unit which is chosen as a useful target for many inefficient DMUs, and so appears frequently in the referent set, is highly ranked.
For the purpose of estimating the optimized energy input level of each input for inefficient units, λ coefficient was applied. The optimal input use calculation can be defined as follows (Equation (3)):
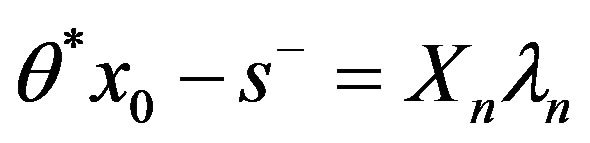 (3)
(3)
where θ* is technical efficiency score of inefficient units, x0 energy input of nth referent DMU and s− is input slack of inefficient units compared to efficient DMUs [37].
In this study for data analysis, the Microsoft Excel spreadsheet and the DEA Solver programs were employed.
3. Results and Discussions
3.1. Energy Balance Analysis for White Button Mushroom Production
Prior to energy use pattern analysis of white button mushroom production, energy use amount in compost production (among the most important inputs of white button mushroom production) was estimated. Table 2 shows the inputs use and their energy use equivalent values.
As the result of energy use pattern analysis, the amounts of energy inputs use, mushroom yield and their energy equivalents were determined. These results are presented in Table 3.
As it is obvious from Table 3, total energy consumption in white button mushroom production is about 133 MJ/kg of product. Based on the results, fossil fuels, compost fertilizer and electricity are mostly contributed inputs to energy consumption in which fossil fuels (diesel fuel and natural gas) had the first rank (40.43%). Fossil fuel was normally used for heating. It should be noted here that the fossil fuel energy input to compost production process has been focused in our formerly calculations. Moreover, energy input of mushroom seed was not considerable for energy analysis. As a matter of fact, ten kilograms of seed is normally required for one ton of compost. Due to the short planting period of mushroom
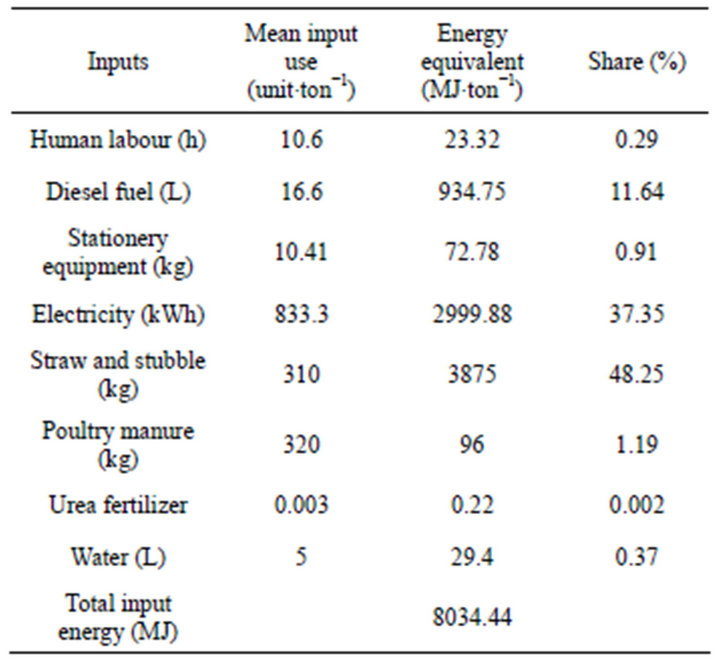
Table 2. Mean input use and energy equivalent values in compost production process in Alburz, Iran.

Table 3. Mean input use and energy equivalent values in white button mushroom production process in Alburz, Iran.
and the need for keeping the temperature at 25 ̊C, too, there is a high need to fossil fuel use in mushroom production farms for heating purposes. Moreover, since mushrooms do not require oxygen in their first month, air ventilation is not essential unless carbon dioxide content rise from its usual and standard rate. Hence, isolation of planting places would eventually lead in energy saving. Compost was reported as the second high contributing input to energy consumption amount in this study. The amount of compost use was 4.86 kg per ton of yield (white button mushroom) with energy input of 40.57 MJ∙ton−1 (30.45%).
In the study conducted by Ghojebeig [38] in greenhouse products of Tehran province, total energy input use was calculated to be 1.57 MJ for each kilogram of cucumber. They also reported fuel (for heating the greenhouses) and animal manure as the high energy consuming inputs in cucumber production. Moreover, Banaeian et al. [39] investigated energy use pattern in 25 greenhouses of strawberry production in Tehran province, Iran. In our study, results indicated that a total energy of 121891.33 MJ∙ha−1 (about 2 MJ∙ton−1) was consumed in greenhouse units. Diesel fuel (78%), chemical fertilizers (10%) and electricity (4.5%) were the highest energy consuming inputs. On the contrary, water for irrigation contribution was relatively low (0.47%). This is mainly due to lower water need of mushroom in contrast with other products.
3.2. Data Envelopment Analysis Findings
3.2.1. Technical Efficiency Analysis
Data obtained from questionnaire approach performed in white button mushroom farms were analyzed for the purpose of measuring farmers’ technical efficiency in light of energy use by applying data envelopment analysis approach. In the following sections, the efficient and inefficient farmers, their efficiency scores and the required changes for the better resources use management strategies are given. It should also be noted here that both explained DEA models (BCC and CCR models) have been utilized in the present study.
Figure 1 illustrates technical efficiency scores of applied data using CCR and BCC models. The results revealed that, from the total of 26 farmers considered for the analysis, 14 farmers (53.8%) had the pure technical efficiency score of 1. Moreover, from the technically efficient farmers 12 farmers (27.66%) had the technical efficiency score of 1; showing that they were globally efficient and were operating at the most productive scale size of production [40]. In addition, 9 and 7 farmers had their technical efficiency and pure technical efficiency score in the 0.9-1 range, respectively. Both DEA models, reported 5 farmers in the efficiency range of 0.8 - 0.9. It can be derived from Figure 1 that the BCC model reduces the number of feasible units compared to the CCR model and yields a comparatively higher number of efficient DMUs.
Table 4 specifies the mean value of the three efficiency types (technical efficiency (TE), pure technical efficiency (PTE) and scale efficiency (SE)) for inefficient farmers. The results showed that these average values
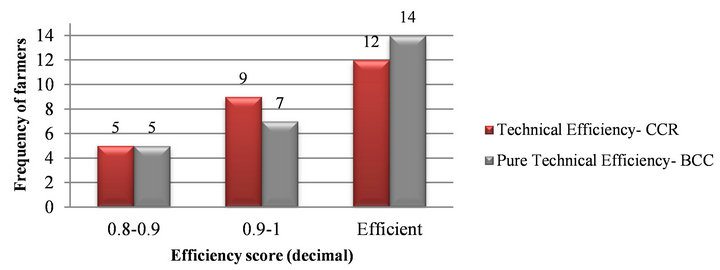
Figure 1. Frequency distribution of farmers from CCR and BCC models in white button mushroom production.
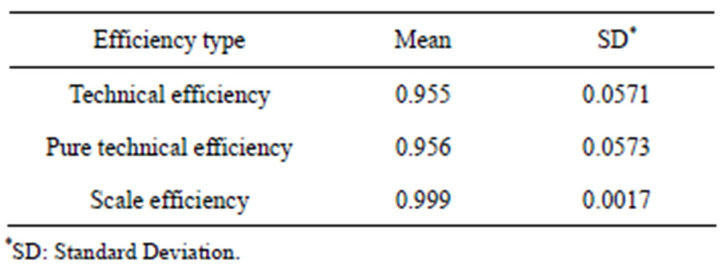
Table 4. Mean value of efficiency types for white button mushroom farmers.
were 0.955, 0.956 and 0.999 respectively. These inefficient DMUs were in the efficiency range of 0.8 - 0.99. PTE had the highest variation indicating the farmers were not fully aware of the right optimal quantity and production techniques or did not applied them at the proper time.
Omid et al. [37] applied the nonparametric approach of DEA to determine the technical, pure technical and scale efficiencies of farmers in some selected greenhouses production in Iran. They considered 18 greenhouse units and 6 of them had the efficiency score of unity. They reported that the TE of the inefficient DMUs, on average, was calculated as 91.5%. In another study [19], the technical, pure technical and scale efficiency of kiwi fruit farmers were calculated as 0.942, 0.993 and 0.948, respectively.
3.2.2. Prioritization of Efficient Units
In this study for ranking the efficient farmers, the number of times they appear in a referent set based on CCR model was counted [36]. The efficient DMUs can be selected by inefficient DMUs as best practice DMUs, making them a composite DMU instead of using a single DMU as a benchmark. The results revealed that farmers No. 13, 9 and 22 with the average cross efficiency scores of 1 had the highest appearance times in referent set (Table 5). Therefore, after this step, these farms can be used as terms of benchmarking and establishing the best practice management.
3.2.3. Input Slacks Analysis
We know that when the pure TE score of a producer is less than one, at present, he is using more energy than required from the different sources. Therefore, it is desired to suggest realistic levels of energy to be used from each source for every inefficient grower in order to avoid energy wastes without reducing the yield level (input-oriented). This can be done by using the value of slacks. Table 6 demonstrates the results of applying BCC model (input-oriented) for estimating the overuses and the slacks for the inputs amount. The slack values indicate that apart from reducing inputs by the amount of (1-θ), the inefficient DMUs have to reduce their inputs by the amounts indicated by the respective slacks in order to become allocatively efficient. The sources of allocative inefficiency at the white button mushroom production units were identified as the overuse of electricity and diesel fuel. Equipment and water for irrigation sources had the right proportions of input use by all the DMUs (zero slacks). This implies the fact that white button mushroom producers have put emphasis on optimal use of water. Optimized water use is generally due to the specific water requirement amount of mushroom; hence, farmers do their best for optimal consumption of water.
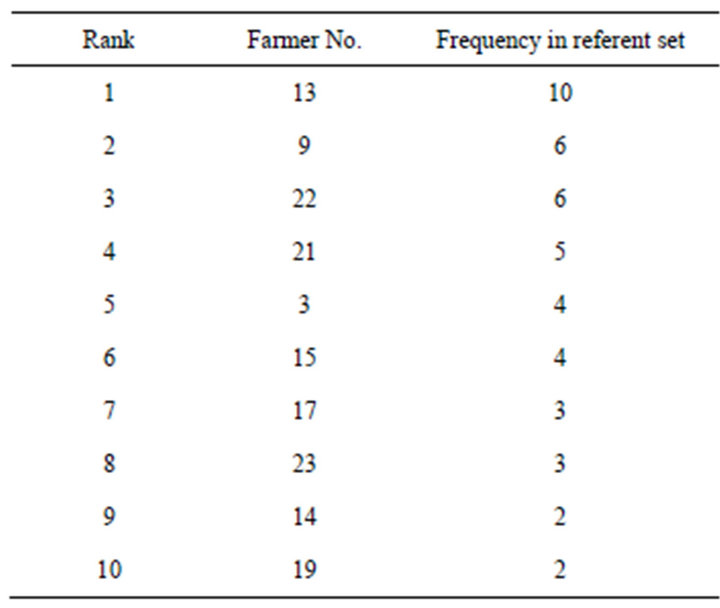
Table 5. Ranking 10 superior efficient farmers in white button mushroom production.

Table 6. Input slacks in BCC model.
On the basis of given results in Table 6, a single unit found with overuse of compost fertilizer. The high buildings and planting room with more stories was the potential reason for inefficient performance of compost resource use in such units. It is worth mentioning that the input orientation of analysis caused the output slacks of all units to be zero in the last column of Table 6.
3.2.4. Setting Realistic Input Levels for Inefficient Producers
In order to calculate the total energy input saving, the average pure technical efficiency of inefficient farmers (0.955) was multiplied by the present use of energy inputs (133 MJ/kg) (Equation (3)). Namely, the total energy input should be reduced about 16%. Table 7 shows the optimum energy requirement for white button mushroom production, based on the results of BCC model. Also the quantity and percentage of energy saving with respect to present use of energy is illustrated. As can be seen, optimum energy requirement for diesel fuel energy (50.89 MJ∙ton−1) was the highest, followed by FYM (37.32 MJ∙ton−1), electricity (30.34 MJ∙ton−1) energies.
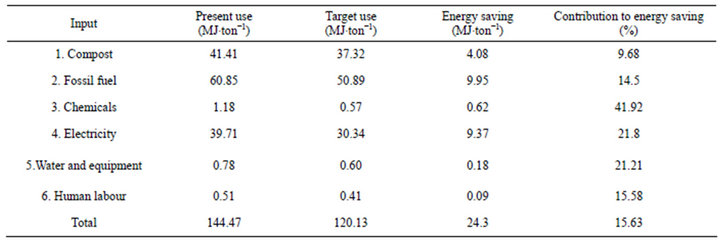
Table 7. Energy optimization from different sources of energy provided following the results of this study.
The total optimum energy requirement for mushroom production was calculated to be 120.15 MJ∙ton−1. In the last column of Table 7 the contribution of each energy input in energy saving is presented. It is evident that 41.92% of chemicals energy, 21.8% of electricity energy and 21.21% of water for irrigation and equipment energy, which had the highest inefficiencies, could be saved. The high percentage of chemicals energy saving resulted from the low efficiency of chemical fertilizer while it is more than plant needs. There was a common belief between the farmers that increased input use especially chemical fertilizers and chemicals will increase the yield. Moreover, energy usage from human labour, machinery, fossil fuels and compost inputs could be saved by 15.58%, 14.5%, 9.68%, respectively. The results also showed that total energy input for mushroom production could be saved by 15.63% (24.3 MJ∙ton−1), if the recommendations of this study are followed.
Figure 2 shows the shares of the various sources from total input energy saving. It is evident that the highest contribution to the total energy saving was 42% for fossil fuel energy. This shows that in the case of fossil fuel energy, there is a greater scope to increase the efficiency of energy consumption. It was due to the relatively high contribution of fossil fuel energy from total energy consumption in present condition. Apart from fossil fuel energy, it is evident that, the contributions of compost and electricity energy inputs from total energy saving were 31% and 25%, respectively. Also, energy saving from human labour had the lowest share from total energy saving.
4. Conclusions
To sum it up, the results of DEA application suggested that there was a great potential for improving energy and economical efficiencies of edible mushroom producers in Alburz, Iran. Based on the performed analysis in this study the following results were drawn:
· Fossil fuels (53.87 MJ∙ton−1), compost fertilizer
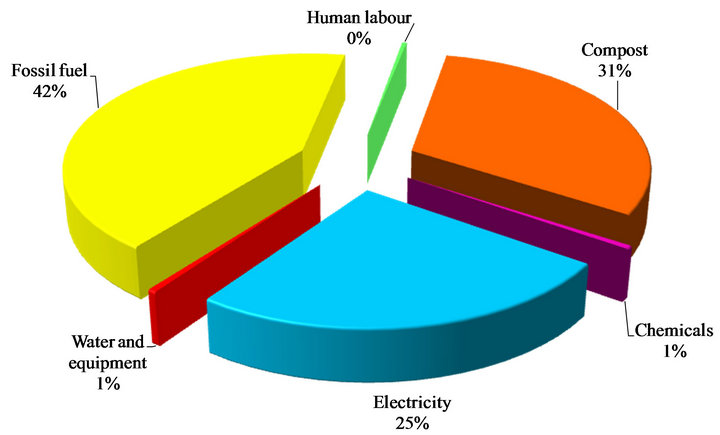
Figure 2. Distribution of energy inputs in energy saving for white button mushroom production.
(40.57 MJ∙ton−1) and electricity (40.57 MJ∙ton−1) are mostly contributed inputs to energy consumption in which fossil fuels (diesel fuel and natural gas) had the first rank (40.43%).
• From the total of 26 farmers, 14 farmers had the pure technical efficiency score (BCC model) of 1. Moreover, from the technically efficient farmers (CCR model) 12 farmers had the technical efficiency score of unity.
• The results showed that the average values of TE, PTE and SE were 0.955, 0.956 and 0.999, respectively.
• Efficient farmers No. 13, 9 and 22 with had the highest appearance times in referent set.
• The sources of allocative inefficiency (with overuse) at the white button mushroom production units were identified as electricity and diesel fuel.
• The total optimum energy requirement for mushroom production was calculated to be 120.15 MJ∙ton−1 in which diesel fuel energy (50.89 MJ∙ton−1), FYM (37.32 MJ∙ton−1) and electricity (30.34 MJ∙ton−1) energies were in the highest degree.
As a result of this study, effectiveness of use of all inputs can be achieved in an informed and efficient production system. In this regard, extension programs toward the development of such systems should be taken into consideration. Here, the extension officers of agricultural institutions would be striking for managing and establishing the energy and economically efficient and environmentally sensitive edible mushroom production systems in this and other similar socio-economic regions. Moreover, providing farmers with suitable compost fertilizer can lead to highly efficient producers.
REFERENCES
- S. G. Walde, V. Velu, T. Jyothirmayi and R. G. Math, “Effects of Pretreatments and Drying Methods on Dehydration of Mushroom,” Journal of Food Engineering, Vol. 74, No. 1, 2006, pp. 108-115. doi:10.1016/j.jfoodeng.2005.02.008
- M. Goltape and I. Pourjam, “Principles of Button Mushrooms,” Tarbiat Modares Univesity Publication, Tehran, 2001. (in Persian)
- A. Mohammadi, S. Rafiee and S. Mohtasebi and H. Rafiee, “Energy Inputs—Yield Relationship and Cost Analysis of Kiwifruit Production in Iran,” Renewable Energy, Vol. 35 No. 5, 2010, pp. 1071-1075. doi:10.1016/j.renene.2009.09.004
- R. Fadavi, A. Keyhani and S. S. Mohtasebi, “Estimation of a Mechanization Index in Apple Orchard in Iran,” Journal of Agricultural Science, Vol. 2, 2010, pp. 180- 185.
- S. Rafiee, S. H. Mousavi Avval and A. Mohammadi, “Modeling and Sensitivity Analysis of Energy Inputs for Apple Production in Iran,” Energy, Vol. 35, No. 8, 2010, pp. 3301-3306. doi:10.1016/j.energy.2010.04.015
- B. Ozkan, C. Fert and C. F. Karadeniz, “Energy and Cost Analysis for Greenhouse and Open-Field Grape Production Grape Production,” Vol. 32, 2007, pp. 1500-1504.
- M. Uzunoz, Y. Akcay and K. Esengun, “Energy InputOutput Analysis of Sunflower Seed (Helianthus annuus L.) Oil in Turkey,” Energy Sources Part B-Economics Planning and Policy, Vol. 3, No. 3, 2008, pp. 215-223. doi:10.1080/15567240701231834
- L. Kallivroussis, A. Natsis and G. Papadakis, “The Energy Balance of Sunflower Production for Biodiesel in Greece,” Biosytems Engineering, Vol. 81, No. 3, 2002, pp. 347-354. doi:10.1006/bioe.2001.0021
- S. H. Mousavi Avval, S. Rafiee, A. Jafari and A. Mohammadi, “Investigating the Energy Consumption in Different Operations of Oilseed Productions in Iran,” Journal of Agricultural Technology, Vol. 7, No. 3, 2011, pp. 557- 565.
- M. Canakci and I. Akinci, “Energy Use Pattern Analyses of Greenhouse Vegetable Production,” Energy, Vol. 31, No. 8-9, 2006, pp. 1243-1256. doi:10.1016/j.energy.2005.05.021
- S. A. Hatirli, B. Ozkan and C. Fert, “Energy Inputs and Crop Yield Relationship in Greenhouse Tomato Production,” Renewable Energy, Vol. 31, No. 4, 2006, pp. 427- 438. doi:10.1016/j.renene.2005.04.007
- H. D. Sherman, “Service Organization Productivity Management,” The Society of Management Accountants of Canada, Hamilton, 1988.
- K. Mukherjee, “Energy Use Efficiency in the Indian Manufacturing Sector: An Interstate Analysis,” Energy Policy, Vol. 36, No. 2, 2008, pp. 662-672. doi:10.1016/j.enpol.2007.10.015
- G. Singh, S. Singh and J. Singh, “Optimization of Energy Inputs for Wheat Crop in Punjab,” Energy Conversion and Management, Vol. 45, No. 3, 2004, pp. 453-465. doi:10.1016/S0196-8904(03)00155-9
- P. Sefeedpari, “Assessment and Optimization of Energy Consumption in Dairy Farm: Energy Efficiency,” Iranica Journal of Energy & Environment, Vol. 3, No. 3, 2012, pp. 213-224.
- P. Sefeedpari, S. Rafiee and A. Akram, “Selecting Energy Efficient Poultry Egg Producers: A Fuzzy Data Envelopment Analysis Approach,” International Journal of Applied Operational Research , Vol. 2, No. 2, 2012, pp. 77- 88.
- E. Reig-Martínez and A. J. Picazo-Tadeo, “Analysing Farming Systems with Data Envelopment Analysis: Citrus Farming in Spain,” Agricultural Systems, Vol. 82, No. 1, 2004, pp. 17-30. doi:10.1016/j.agsy.2003.12.002
- S. H. Mousavi-Avval, S. Rafiee and A. Mohammadi, “Optimization of Energy Consumption and Input Costs for Apple Production In Iran Using Data Envelopment Analysis,” Energy, Vol. 36, No. 2, 2011, pp. 909-916. doi:10.1016/j.energy.2010.12.020
- A. Mohammadi, S. Rafiee, S. S. Mohtasebi, S. H. Mousavi Avval and H. Rafiee, “Energy Efficiency Improvement and Input Cost Saving in Kiwifruit Production Using Data Envelopment Analysis Approach,” Renewable Energy, Vol. 36, No. 9, 2011, pp. 2573-2579. doi:10.1016/j.renene.2010.10.036
- H. Reyhani Farashah, “Study on Energy Efficiency and Assessment of Economical Indices of the Button Mushroom Production Units in The Provinces of Alborz Using Data Envelopment Analysis (DEA) Approach,” M.S. Thesis, University of Tehran, Tehran, 2012. (in Persian)
- Jamshidi, “Sustainability Analysis of Greenhouse Systems in Alburz Province of Iran,” M.S. Thesis, University of Tehran, Tehran, 2011. (in Persian)
- D. Pimentel and M. Pimentel, “Food, Energy and Society,” Resource and Environmental Science Series, Edward Arnold Publ., London, 1979.
- M. Canakci, M. Topakci, I. Akinci and A. Ozmerzi, “Energy Use Pattern of Some Field Crops and Vegetable Production: Case Study for Antalya Region, Turkey,” Energy Conversion and Management, Vol. 46, No. 4, 2005, pp. 655-666. doi:10.1016/j.enconman.2004.04.008
- S. Singh and J. P. Mital, “Energy in Production Agriculture,” Mittal Pub, New Delhi, 1992.
- Kitani, “CIGR Handbook of Agricultural Engineering,” Vol. V, Energy and Biomass Engineering, ASAE Publication, ST Joseph, 1999.
- S. Rafiee, S. H. Mousavi Avval and A. Mohammadi, “Modeling and Sensitivity Analysis of Energy Inputs for Apple Production in Iran,” Energy, Vol. 35, No. 8, 2010, pp. 3301-3306. doi:10.1016/j.energy.2010.04.015
- M. Ghafarpour, A. Houshyarrad, H. Kiyanfar and B. Bani Eqbal, “Nutrients Album,” Nutrition World Pub., Institute of Nutritional and Food Science, 2007.
- S. R. Moore, “Energy Efficiency in Small-Scale Biointensive Organic Onion Production in Pennsylvania, USA,” Renewable Agriculture and Food Systems, Vol. 25, No. 3, 2010, pp. 181-188. doi:10.1017/S1742170510000098
- B. Tabar, A. Keyhani and S. Rafiee, “Energy Balance in Iran’s Agronomy (1990-2006),” Renewable and Sustainable Energy Reviews, Vol. 14, No. 2, 2010, pp. 849-855. doi:10.1016/j.rser.2009.10.024
- I. Gezer, M. Acaroglu and H. Haciseferogullari, “Use of Energy and Labor in Apricot Agriculture in Turkey,” Biomass & Bioenergy, Vol. 24, No. 3, 2003, pp. 215-219. doi:10.1016/S0961-9534(02)00116-2
- A. Charnes, W. W. Cooper and E. Rhodes, “Measuring the Efficiency of Decision Making Units,” European Journal of Operational Research, Vol. 2, No. 6, 1978, pp. 429-444. doi:10.1016/0377-2217(78)90138-8
- R. D. Banker, A. Charnes and W. W. Cooper, “Some Models for Estimating Technical Scale Inefficiencies in Data Envelopment Analysis,” Management Science, Vol. 30, No. 9, 1984, pp. 107-192. doi:10.1287/mnsc.30.9.1078
- S. M. Nassiri and S. Singh, “Study on Energy Use Efficiency for Paddy Crop Using Data Envelopment Analysis (DEA) Technique,” Applied Energy, Vol. 86, No. 7-8, 2009, pp. 1320-1325. doi:10.1016/j.apenergy.2008.10.007
- S. H. Mousavi-Avval, S. Rafiee, A. Jafari and A. Mohammadi, “Improving Energy Use Efficiency of Canola Production Using Data Envelopment Analysis (DEA) Approach,” Energy, Vol. 36, No. 5, 2011, pp. 2765-2772. doi:10.1016/j.energy.2011.02.016
- L. M. Cooper, L. M. Seiford and K. Tone, “Introduction to Data Envelopment Analysis and Its Uses,” Springer, New York, 2006.
- N. Adler, L. Friedman and Z. Sinuany-Stern, “Review of Ranking Methods in the Data Envelopment Analysis Context,” European Journal of Operational Research, Vol. 140, No. 2, 2002, pp. 249-265. doi:10.1016/S0377-2217(02)00068-1
- M. Omid, F. Ghojabeige, M. Delshad and H. Ahmadi, “Energy Use Pattern and Benchmarking of Selected Greenhouses in Iran Using Data Envelopment Analysis,” Energy Conversion and Management, Vol. 52, No. 1, 2011, pp. 153-162. doi:10.1016/j.enconman.2010.06.054
- F. Ghojebeig, “A Decision Support System for Optimizing Energy Consumption in Vegetable Production Greenhouses,” M.S. Thesis, University of Tehran, Karaj, 2010.
- N. Banaeian, M. Omid and H. Ahmadi, “Energy and Economic Analysis of Greenhouse Strawberry Production in Tehran Province of Iran,” Energy Conversion and Management, Vol. 52, No. 2, 2011, pp. 1020-1025. doi:10.1016/j.enconman.2010.08.030
- S. H. Mousavi-Avval, S. Rafiee, A. Jafari and A. Mohammadi, “Optimization of Energy Consumption for Soybean Production Using Data Envelopment Analysis (DEA) Approach,” Applied Energy, Vol. 88, No. 11, 2011, pp. 3765- 3772. doi:10.1016/j.apenergy.2011.04.021
NOTES
*Corresponding author.