American Journal of Climate Change
Vol.1 No.2(2012), Article ID:20394,40 pages DOI:10.4236/ajcc.2012.12007
Development of a Low Carbon Economy in Wuxi City
1Research Center for International Environmental Policy, School of Environment, Tsinghua University, Beijing, China
2Rheinisch Westfälisches Institut für Wirtschaftsforschung, Essen, Germany
3Jiangnan University, Wuxi, China
Email: oberheitmann@tsinghua.edu.cn
Received April 6, 2012; revised May 6, 2012; accepted May 18, 2012
Keywords: Climate Change; Low Carbon Economy in Cities; China; Carbon Intensity; Combined Heat and Power Generation
ABSTRACT
The development of a Low Carbon Economy is a vital instrument to encounter climate change and take into account the growing challenges of an increasing urbanization in China. Wuxi City in East China’s Jiangsu Province is starting to implement a Low Carbon City Plan for safeguarding a sustainable development of the city until 2020 and beyond. This paper aims at estimating the impact of the Low Carbon City plan for Wuxi’s energy demand and CO2-emissions until 2050. Using an econometric energy supply and demand model to estimate and forecast the Wuxi energy and CO2-balance aggregates until 2050, it compares a scenario without specific Low Carbon City measures to reduce sectoral CO2-intensities to a Low Carbon scenario implementing these measures according to the Low Carbon City Plan until 2020 and beyond. The decomposition of the Kaya-identity reveals that the increase of per capita income has the largest impact on the growth of CO2-emissions and the decrease of energy intensity of Gross Value Added the largest impact on the reduction of CO2-emissions in Wuxi. A decrease of population and CO2-intensity of Primary energy supply only have average contributions. The decrease of energy intensity of Gross Value Added is due to energy efficiency gains in the single economic sectors, but to a large extent due to structural changes of the economy away from energy intensive sectors such as iron and steel, chemical industry or cement industry towards the energy extensive service sectors. A growing residential sector also reduces the industrial share of energy demand. Only following the assumed national trend with a shift from CO2-intensive industries to a CO2-extensive service economy, the Low Carbon goal of a 50% reduction of CO2-intensity of Gross Value Added compared to 2005 cannot be reached in Wuxi. Specific sectoral CO2-intensity goals have to be successfully observed by the economic sectors in Wuxi, especially by the industry. The promotion of combined heat and power generation also has to contribute to the specific activities in Wuxi.
1. Introduction
Increasing urbanization and climate change are one of the greatest challenges in the 21st Century [1-5]. Cities cover only 1% of the Earth’s surface, but host about 50% of the Earth’s population, soon it will reach 60%. Hence, cities are highly vulnerable to the impact of climate change (sea level rise, droughts, extreme weather events etc.) especially in coastal regions. As cities use about three quarters of all energy and emit about 80% of the greenhouse gases, they are also one focal point of climate change mitigation measures, in recent times in Low Carbon City concepts and strategies all over the world [6-10].
Wuxi is a city on the Yangtze River with 6.4 Mill. inhabitants (2010) between Suzhou and Nanjing, located in the south of Jiangsu Province, half way between the cities of Shanghai and Nanjing, with Shanghai 128 km to its east and Nanjing 183 km to its west. In the south of Wuxi is Lake Tai (Tai hu) and to its north Yangtse River. Wuxi covers an overall area of 4787.6 km2. The urban district occupies an area of 216.5 km2 with 973 inhabitants per km2. This implies that Wuxi is densely populated, comparable to Beijing (1167.3 inhabitants per km2). Average population density in Jiangsu Province is 753 inhabitants per km2, the Chinese average is only 135 per km2. Wuxi’s economy has witnessed a considerable increase in recent years. The per capita GDP was 575.8 billion RMB in 2010, doubling that of 2005 and with an average annual growth rate of 13.5%. Per capita GDP (based on resident population) was over US $13,000 (90,355 RMB) [7].
In order to emphasize the high importance of urban areas for a low carbon development, the National Development and Reform Commission (NDRC) has selected five provinces and eight cities as low carbon pilot regions. These pilots include five provinces (Guangdong, LiaoningHubei, Shaanxi, Yunnan), and eight cities (Tianjin, Chongqing, Shenzhen, Xiamen, Hangzhou, Nanchang, Guiyang and Baoding), covering a total population of 350 million. Wuxi is not part of this initiative, but is part of the low carbon eco-city pilot initiative of the national Ministry of Housing and Urban-Rural Development (MOHURD), involving regulation for massive energy saving in buildings. In March 2010, Wuxi city government developed a Low Carbon City Plan in cooperation with Wuxi Low Carbon City Development Research Centre (WLCDRC) of Jiangnan University [12]. The Plan constitutes the key document for low carbon development in Wuxi and outlines, in line with strategies in other Chinese cities, strategic milestones and goals for the following sectors:
• Agriculture;
• Industry;
• Transport;
• Buildings (cooling, heating, ventilation, dehumidification, lighting);
• Residential consumption (hot water, cooking, electric appliances etc.).
For these sectors, the city government adopts different strategies. Quantitative aim of Wuxi government is to reduce CO2-emissions per unit GDP by 50% in 2020 compared to 2005. This is going even beyond the national goal of 40% - 45% formulated by the central government.
Aim of this paper is to compare the development of CO2-emissions in Wuxi in a Low Carbon City scenario to a Business as Usual (BAU) scenario without specific Low carbon measures in the city, only following the trend in China. Chapter 1 describes the model and the sectoral development of energy consumption and CO2-emissions between 1994 and 2010. Chapter 2 analyses the Business as Usual scenario, Chapter 3 compares it to the Low Carbon City scenario. Chapter 4 summarizes the article.
2. Model Description and Development until 2010
2.1. Overview
Basis of the analysis is the energy balance of Wuxi City between 1994 and 2010. Data used is the Wuxi City Statistical Yearbook [13]. The energy balance is forecasted with an econometric model. The energy demand and supply in China had been modeled by using different approaches [14-16]. Söderholm [17] gives an overview of different models used.
Basis is the econometric bottom-up estimation of the final energy demand, transformation and primary energy supply (in PJ) in Wuxi (Table 1). Estimation approaches are based on Ordinary Least Squares (OLS)-regressions [18] and the Augmented Dickey-Fuller-Test on stationarity [19].
Between 1994 and 2010, total primary energy supply more than five-folded (478%) from 138 PJ to 798 PJ. Transformation of primary to secondary energy in Wuxi increased so that total primary energy imports grew slower (451%). Total final consumption in Wuxi increased by 396%, higher in the secondary (463%) and tertiary sector (810%), but slower in the residential sector (324%). Final energy consumption in the primary sector even decreased by 67% (Table 1). Within the industry sector, the largest increase of energy consumption was both in light industry (Clothes, Shoes and Hats Products: 4825%; Electric Equipment and Machinery Manufacturing: 4661%, Telecommunications, Computers and other Electronic Equipments Products: 1568%) and heavy industry (Chemical Fiber Manufacturing: 1979%; Plastic Products: 1898%; Smelting and Pressing of Nonferrous Metals: 1667%). Within the tertiary sector, all branches increased energy consumption more or less around the sector average. In the residential sector, the catching up of the rural areas in terms of income lead to a considerably higher growth of energy consumption (430%) compared to urban areas (271%). Non energy use of crude oil by chemical industry decreased from 4.864 PJ in 1994 to 2.319 PJ in 2010. In 2010, the primary energy supply mix was as follows: 80.8% coal, 9.3% imported coke, 3.2% oil, 3.1% gas, 3.0% imported electricity and 0.7% recovery of heat energy in combined heat and power generation.
In 2010, 99.9% of power generation input was coal, only a small fragment (0.4%) are diesel aggregates. Since 2009, coking gas is also used for power generation, but currently only to a very small extent (0.2%). Process heat (thermopower) is 100% coal generated. In 2010, the petroleum refineries in Wuxi can produce the city’s kerosene demand. The consumption of diesel has to a large extent be supplemented by imports (60.6%). Gasoline and fuel oil, however, are also produced for interregional exports.
In 2010, the final energy mix was 36.7% coal, 14.5% coke, 2.7% oil, 4.5% gas, 29.6% imported electricity and 12.1% heat energy The energy related CO2-emissions in Wuxi are calculated using the factors shown in Table 2.
The energy-related CO2-emissions in Wuxi follow the trend of energy consumption (Table 3). Between 1994 and 2010, total CO2-emissions of primary energy supply in Wuxi increased by 358% from 16.8 Mt to 77.0 Mt CO2. In 2010, 79.1% of CO2-emissions are coal, 2.2% oil, 1.8% gas and 0.8% recovery of heat energy. 9.2% total CO2 in the primary energy balance is imported coke, 6.8% imported electricity. To include imported secondary energy (also relevant for petroleum products) provides the problem of possible double counting, if the


Table 1. Wuxi energy balance (1994-2010, in PJ).

Table 2. CO2-emission factors.
analysis boundary would be widened e.g. on a provincial scale, as primary energy was used in other regions to produce the secondary energy in question. As we here only focus on Wuxi, it may be rational to account for produced and consumed secondary energy. 90% of CO2- emissions of final energy are in the secondary sector as described above for energy consumption in the different branches.
The Econometric Wuxi energy and CO2 model is a bottom-up estimation of the Wuxi City energy balance disaggregated by 17 energy sources and the 46 sectors listed above (including the sums for total final energy demand and final energy demand in the primary, secondary, tertiary and residential sector). Based on assumptions on input factors in the petroleum refinery sector and coking as well as capacities of petroleum refineries, electricity and heat generation, final energy demand is determining the production of oil products, heat and electricity in Wuxi City as well as the demand and supply for primary energy in terms of intra-provincial imports and exports. Based on assumed political goals for total primary energy CO2-intensity of Gross Value Added in Wuxi• Excess heat demand is produced with co-generation (recovery of energy);
• A further reduction of CO2-intensity down to the required level through the generation of renewable electricity.
As data on the mix of renewable energy is missing, only the total renewable energy generation is calculated.
For the estimation of the future energy balance, bunkers (refuelling of Chinese and foreign vessels, stock changes) are assumed to be zero as a net-value.
Statistical differences are calculated as: Primary Energy Supply + Total Transformation − Final Energy Consumption, e.g. for coal as:
WX_SD02 = WX_PES02 + WX_IT02 − WX_TFC02(1)
2.2. Final Energy Demand
Generally, final demand (WX_FC) of energy (i) of the different sectors (j) in the year (t) is estimated as
 (2)
(2)
with:
• CO2INT = assumed CO2-intensity goal of Gross Value Added (PJ/1000 RMB);
• GVA = Gross Value Added (Mill. RMB);
• POPWX = Population Wuxi (1000 inhabitants);
• T = Linear technical progress trend;
• OUTPx = Selected physical output of product x;
• D = Dummy variable (being 1 in year t and 0 in the other years).
A similar model for the estimation of the energy demand in China had been developed in [21]. For some sectors, in the estimated function, some coefficients (a, ∙∙∙, J) may be zero. The variable CO2INTj,t stands for political carbon intensity goals of sector (j) in Wuxi given in the observed time (t) until 2010 and set by the central government for the future. For 2020, Wuxi plans a reduction of the CO2-intensity of GDP by 50% compared to 2005. Until 2050 it is assumed to be gradually reduced further (65% by 2030, 70% by 2040, and 75% by 2050).
The variable GVA (Table 4) is a variable determining the value of the output in the different sectors (j) in Wuxi, whereas OUTP_x is the physical output of selected products (x).
In the model, the nominal output value had been deflated with the Wuxi city producer price index taking the base year of 2005. In 2010, Total Gross Value Added of 493,589 bn. RMB was dominated by Wholesale and Retail (72,278 bn. RMB), Telecommunications, Smelting and Pressing of Ferrous Metals (35,178 bn. RMB), Computers and Other Electronic Equipments Products (32,714 bn. RMB), Electric Equipment and Machinery Manufacturing (32,591 bn. RMB), Real Estate (30,889 bn. RMB), Transportation Equipment Manufacturing (25,322 bn. RMB), Raw Chemical Materials and Chemical Products (17,425 bn. RMB), Textile Industry (13,990


Table 3. Wuxi CO2 balance (1994-2010, in Mt CO2).


Table 4. Real gross value added (1994-2010, in Mill. RMB and prices of 2005).
bn. RMB) and Smelting and Pressing of Nonferrous Metals (14,114 bn. RMB) (Table 5).
Between 1994 and 2010, total population in Wuxi grew by 25.4% from 5.084 Mill. in 1993 to 6.376 Mill. in 2010 (Table 6). During the same period of time, urbanization increased considerably. Urban population grew by 190%, whereas rural population decreased by 22%.
According to the Population Census Wuxi, permanent population is calculated including migrant workers and their families from other regions not having a formal residence (hukou) in Wuxi.
Total Final Energy demand, e.g. for raw coal (WX_ TFC02) is defined as:
WX_TFC02 = WX_FCA02 + WX_FCI02
+ WX_FCN02 + WX_FCV02 + WX_FCW02 (3)
+ WX_FCZ02 + WX_FCR02 with WX_FCA02 = Agriculture (PJ);
WX_FCI02 = Industry (PJ);
WX_FCN02 = Construction (PJ);
WX_FCV02 = Transportation, Telecommunications, Postal (PJ);
WX_FCW02 = Commerce, Hotel and Catering Service (PJ);
WX_FCZ02 = Other Tertiary (PJ);
WX_FCR02 = Residential (PJ).
2.3. Transformation of Primary Energy
In the energy balance model, primary energy inputs in the transformation sectors are calculated as follows:
• Primary energy inputs for power generation are calculated on the basis of their input factors or partial efficiencies (effic_power_rawcoal). e.g. the input of raw coal (WX_ITTP02) is calculated as WX_ITTP02 = (WX_ITTP22/
(effic_power_rawcoal/100)) * (4)
Output of electricity generated in Wuxi (WX_ITTP22) is calculated as the product of the capacity of power generation (CAPTP_22), the utilization hours per year (8760 h * 0.7) and the calculation of TWh to PJ (1/8.141)/1000 * 29.308) as:
WX_ITTP22 = CAPTP_22 * 8760 * 0.7
* (1/8.141)/1000 * 29.308(5)
Excess electricity demand in Wuxi has to be “imported” from the East China Grid.
• The same rationale applies for the coal input of heat generation (WX_ITHS02) and the heat output (WX_ IHS02) calculated with the heat generation capacity (CAPHP_21) and the parameters mentioned above:
WX_ITHS02 = (WX_ITHS21/
(effic_heat_rawcoal/100)) * −1 (6)


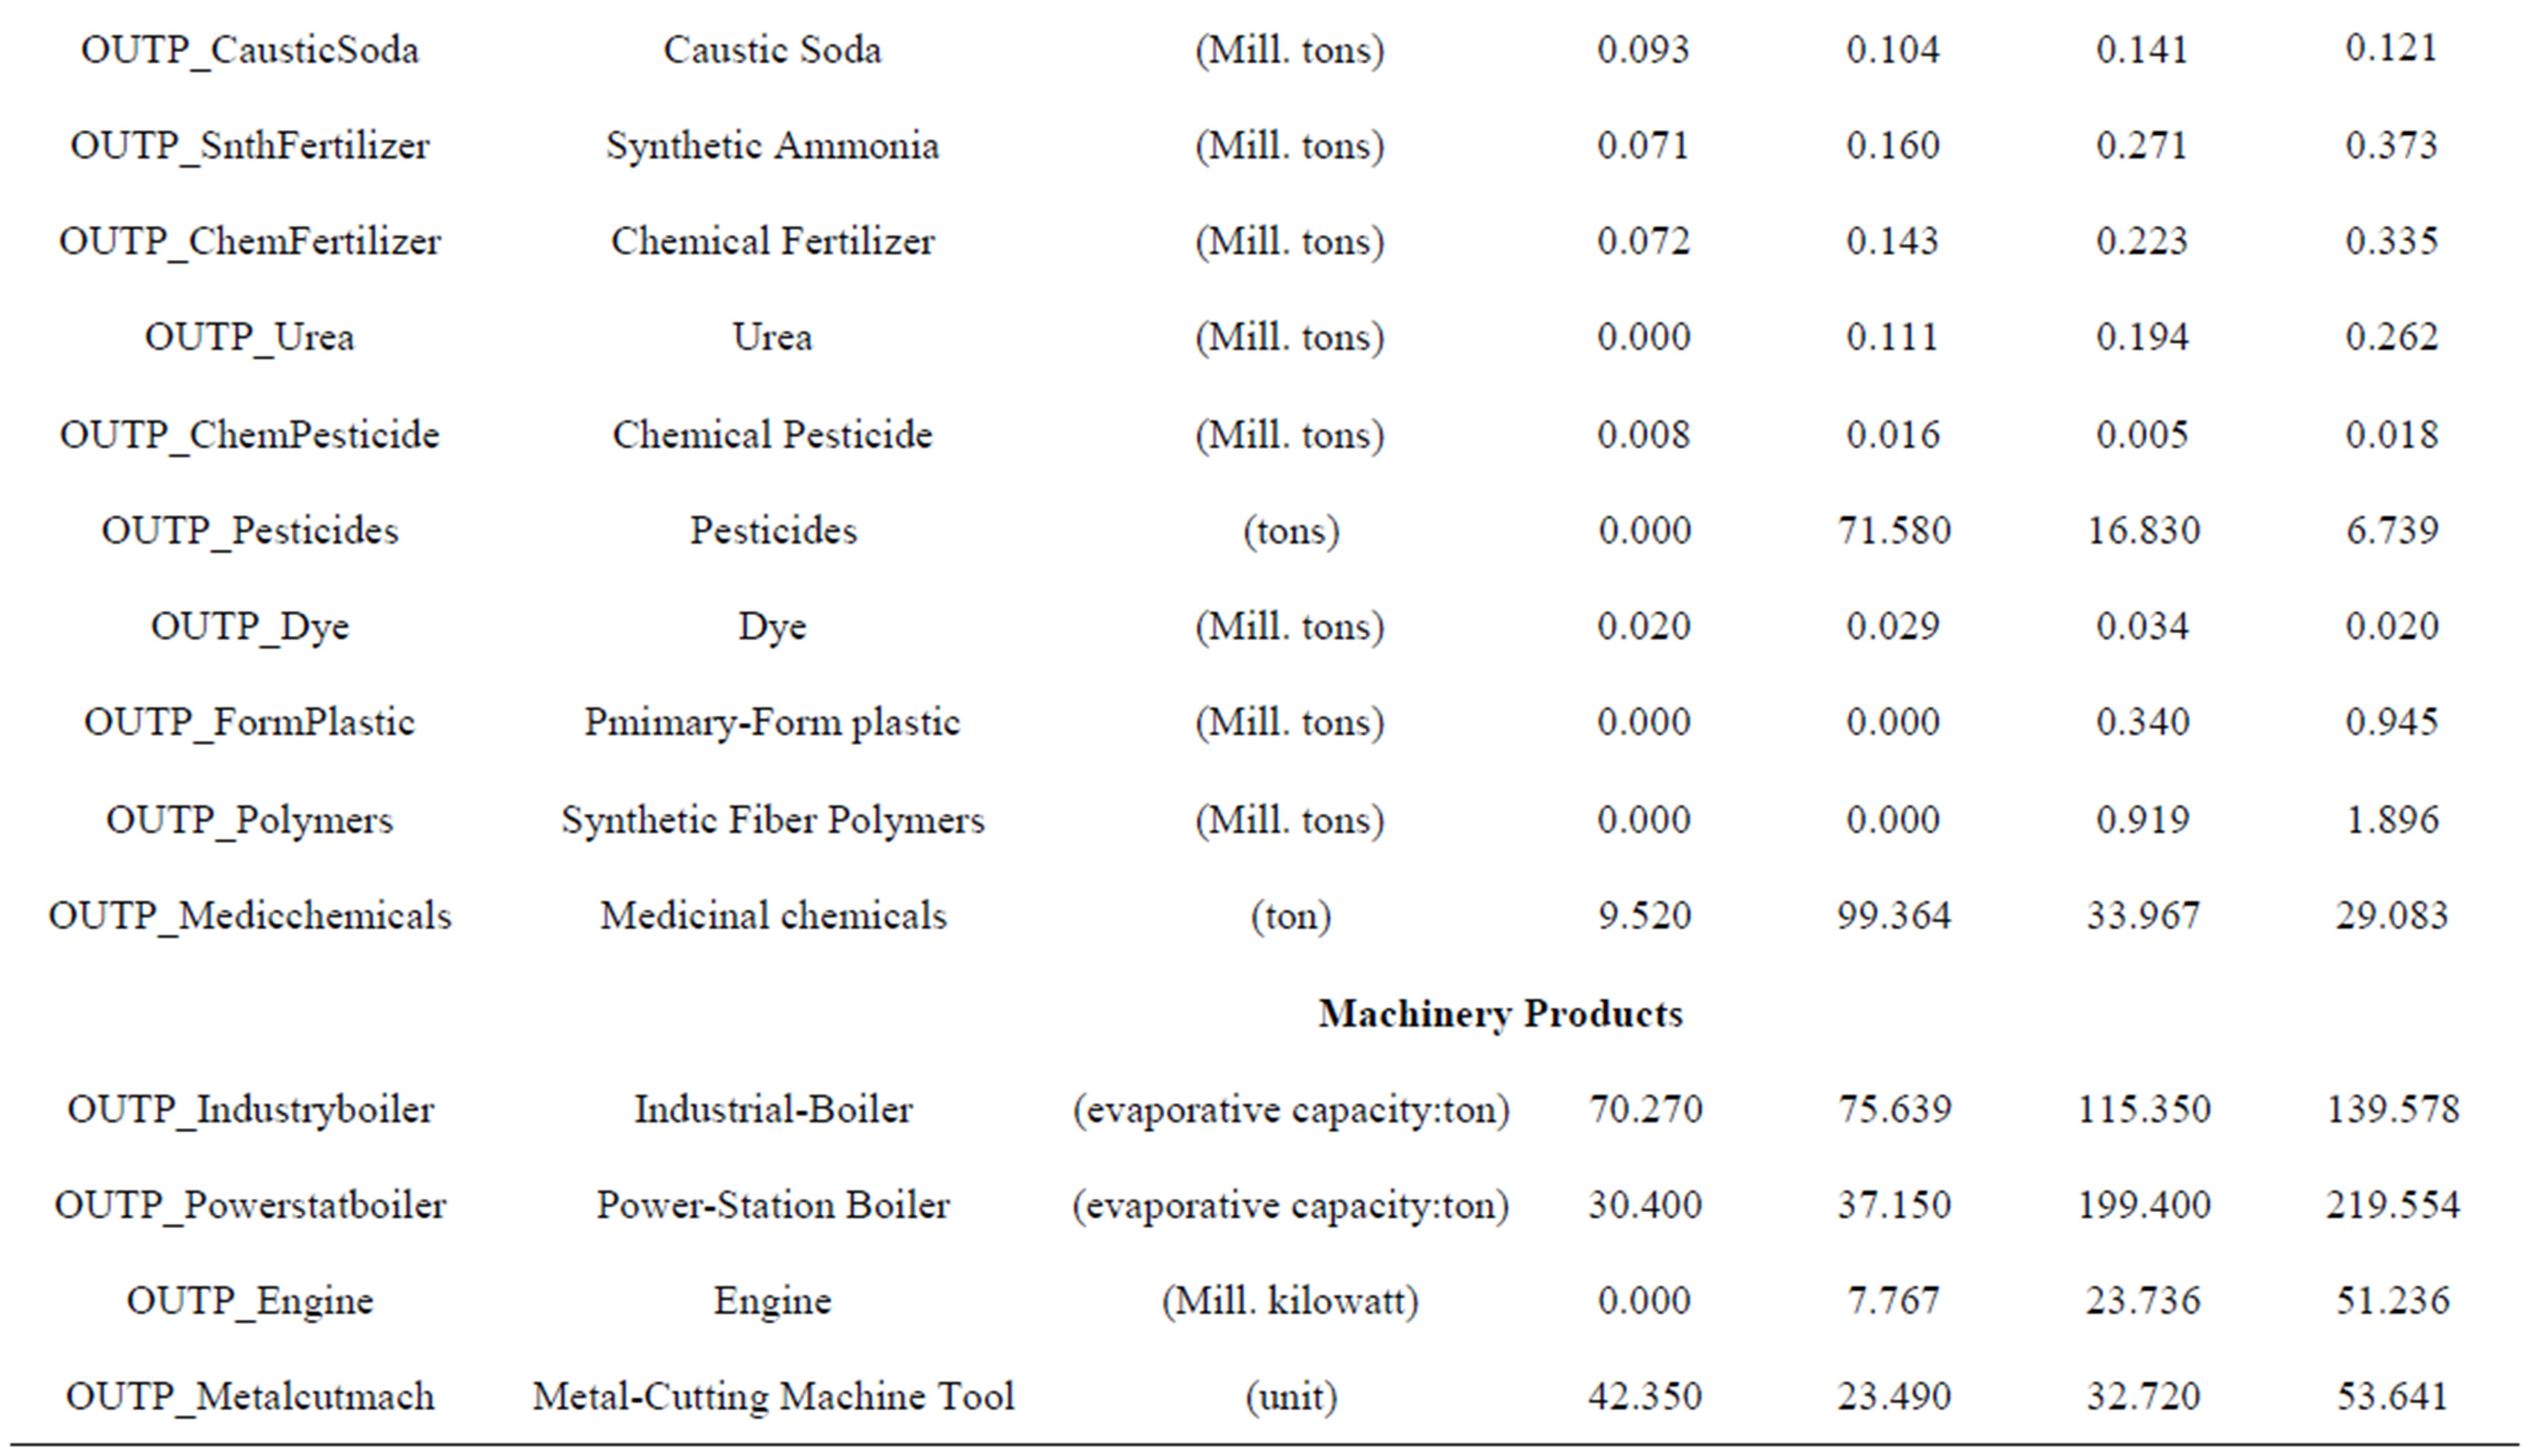


Table 5. Output of selected industrial products (1994-2010, in physical units).

Table 6. Population Wuxi (1994-2010, in 1000).
and WX_ITHS21 = CAPHP_21 * 8760 * 0.58
* (1/8.141)/1000 * 29.308(7)
Excess heat demand in Wuxi is modeled to be generated with combined heat and power generation (recovery of energy).
• The input of coal for the production of coke (WX_ ITC02) is calculated on the basis of its input factor (IC_02_06) for the output of coke (WX_ITC06) as WX_ITC02 = WX_ITC06 * IC_02_06 * −1(8)
• The output of petroleum products (gasoline, kerosene, diesel, fuel oil, LPG) from refineries, are calculated on the basis of their output factors (or the reverse of their input factors), e.g. for fuel oil (WX_ITPR15) as WX_ITPR15 = WX_ITPR11 * (1/IC_11_15) * −1(9)
The capacities of the oil refineries (CAP_ITPR11) and their capacity factor (Capfactor_ITPR11) determine the amount of petroleum products which can be produced in Wuxi city as:
WX_ITPR11 = CAP_ITPR11
* Capfactor_ITPR11 * −1 (10)
Excess demand of petroleum products has to be imported from other regions in China. As Wuxi does not produce crude oil, 100% of crude oil has to be imported from other regions in China. Imports from other countries are neglected here.
Total transformation, e.g. of raw coal (WX_IT02) is defined as WX_IT02 = WX_ITTP02 + WX_ITHS02
+ WX_ITCW02 + WX_ITC02
+ WX_ITPR02 + WX_ITGW02 (11)
+ WX_ITCI02 + WX_OTBQ02
+ WX_LOSS02 with WX_ITTP02 = Transformation Input Thermal Power (PJ);
WX_ITHS02 = Transformation Input Heating Supply (PJ);
WX_ITCW02 = Transformation Input Coal Washing (PJ);
WX_ITC02 = Transformation Input Coking (PJ);
WX_ITPR02 = Transformation Input Petroleum Refineries (=0) (PJ);
WX_ITGW02 = Transformation Input Gas Works (=0) (PJ);
WX_ITCI02 = Gas Works − Coke input (=0) (PJ);
WX_OTBQ02 = Transformation Input Briquettes (=0) (PJ);
WX_LOSS02 = Losses in Transformation (PJ).
Transformation output of the input factor coal e.g. is realized in power and heat generation (see above).
Primary energy supply Primary energy supply, e.g. of coal (WX_PES02) is calculated as WX_PES02 = WX_PESIP02 + WX_PESREC02
+ WX_PESIIP02 + WX_PESIMP02
+ WX_PESCAS02 + WX_PESIEXP0212)
+ WX_PESEXP02 + WX_PESFAS02
+ WX_PESFC02 with:
WX_PESIP02 = Indigenous Production (PJ);
WX_PESREC02 = Recovery of Energy (PJ);
WX_PESIIP02 = Interprovincial Imports (+) (PJ);
WX_PESIMP02 = Import (+) (PJ);
WX_PESCAS02 = Chinese Vessels Refueling Abroad (+) (PJ);
WX_PESIEX02 Interprovincial Exports (−) (PJ);
WX_PESEXP02 = Export (−) (PJ);
WX_PESFAS02 = Foreign Vessels Refueling in China (−) (PJ);
WX_PESFC02 = Stock Change (increase: −; decrease: +) (PJ).
Indigenous production of electricity in Wuxi (WX_ PESIP22) is the sum of the production of nuclear power (WX_PESNP22), hydro power (WX_PESHP22) and other renewable energy (WX_PESREN22).
WX_PESIP22 = WX_PESHP22 + WX_PESNP22
+ WX_PESREN22(13)
Excess demand of electricity from the final energy sectors (WX_TFC22) which cannot be generated in thermal (WX_ITTP22) or non-fossil (WX_PESIP22) power plants in Wuxi has to be imported from other regions in China (WX_PESIIP22).
WX_PESIIP22 = WX_TFC22 − WX_ITTP22
− WX_PESIP22(14)
Excess demand of heat from the final energy sectors (WX_TFC21) which cannot be generated in thermal (WX_ITHP21) or non-fossil (WX_PESIP21 = 0) heat plants in Wuxi has to be produced by co-generation (WX_PESREC21).
WX_PESREC21 = WX_TFC21 − WX_ITHP21
− WX_PESIP21(15)
Assumptions for the forecast of primary energy supply and CO2-emissions.
The forecast of primary energy supply and CO2-emissions in Wuxi is based on assumptions on the development of
• Population;
• Gross Value Added;
• CO2-intensity of Gross Value Added and;
• Output of major industrial products in Wuxi.
The development of permanent population in Wuxi until 2050 is based on the estimated annual growth rates for Jiangsu Province by Wu [22]: 2011-2020: 0.1278%; 2021-2030: −0.3326%; 2031-2040: −0.5279% and 2041- 2050: −0.9795%.
Between 2010 and 2050, population in Wuxi is expected to decrease by 12.2% down to 5.597 Mill. urban population, however, is still growing by 33.8% to 4.421 mill following the prevailing urbanization trend in Wuxi. Against this background, rural population will decrease by 61.7% down to 1.175 Mill. inhabitants in 2050 (Table 7).
The speed of sectoral Gross Value Added growth is estimated with the growth rates in Wuxi between 2005 and 2009. As for selected sectors (paper industry, chemical industry, cement industry, iron and steel and aluminium industry as well as the primary, secondary and tertiary sector, output value growth is estimated with the respective GDP growth rates given in a study of the Energy Research Institute on China of NDRC on China’s Energy Demand and Greenhouse Gas Emission Scenarios in 2050 [23]. To reach the output values in the three sectors of the economy, the growth of Gross Value Added on the single branches are calibrated with correction factors. Table 8 shows the assumed development of Gross Value Added in Wuxi (2010 is observed data).
Figure 1 shows the assumed sectoral development in Wuxi between 2010 and 2050 and reveals a trend of tertiarization especially after 2030. By 2050, the agricultural sector almost diminished. In addition, within the industrial sector, production of energy intensive goods is decreasing sharply, as indicated in Jiang et al. (2008) [23] especially of products in paper industry, chemical industry, cement industry, iron and steel and aluminium industry.
The reduction of CO2-intensity of Gross Value Added is the most prominent goal in China to achieve a low carbon economy. The national goal for 2020 is a reduction of 40% - 45% against 2005. Wuxi City government is heading for an even higher goal: 50% in 2020. For the time after 2020, it is assumed to be gradually reduced further (65% by 2030, 70% by 2040, and 75% by 2050).
The output of major industrial products is one of the most important factors for the energy demand in Wuxi and reflects the development mentioned above. Its development in the main sectors again is estimated with data on China until 2050 (Table 9) from Jiang et al. [23].
As for Wuxi, the growth rate of physical output of the main products is estimated with the assumed national

Table 7. Development of population and age structure in Wuxi (2010-2050, in 1000).

Figure 1. Sectoral development in Wuxi (2010-2050 in percent of total Gross Value Added). Source: [13,23], own calculations. 2010 is observed data.


Table 8. Development of gross value added in Wuxi (2010-2050, in bn. RMB and prices of 2005).

Table 9. Products output in major sectors in China (2005-2050, in physical units).
development (Table 10).
Table 11 shows the output of major industrial products in Wuxi and reveals the trend of a decrease of energy intensive heavy industry products (steel, cement, copper, chemical products) in favor of less energy intensive light industrial products such as household washers or refrigerators.
Based on the assumptions of the Energy Research Center of the National Development and Reform Commission [23] on the growth of Gross Value Added in the key sectors in China are as shown in Table 11 presenting a mixed picture. Generally, there will be a structural

Table 10. Growth rates of physical product output in major sectors in China (2011-2050, in percent p.a.).


Table 11. Output of major industrial products in Wuxi (2005-2050, in physical units).
change away from energy intensive heavy (iron and steel, chemical industry etc.) to light industry. Textile industry output will decrease by 60% - 70% by 2050. However, other light industry machinery and electronic products will increase in output such as computers (1400%), electronic instruments and meters (1800%) or engines (2000%).
3. Development until 2050 without Implementation of the Low Carbon City Plan
3.1. Overview
For modeling the scenario without the implementation of a Low Carbon City plan un Wuxi, the variable CO2INTj,t is kept constant for the single sectors (j) after 2010.
Based on the assumptions of the model, total primary energy in Wuxi will increase by 93.7% in 2020 and by 244.7% in 2050 against the 2005 values (Table 12). Access demand for electricity and all other primary energy in Wuxi is imported. Primary energy imports increase by 76.7% in 2020 and 210.1% in 2050.
In 2010, 80.8% of primary energy was coal, 9.3% coke, 3.2% oil, 3.1% gas, 3.0% electricity imports and 0.7% recovery of heat energy through co-generation. By 2020, this fuel mix will already change considerably as electricity imports will grow to 156 PJ in 2020 and 665 PJ in 2050 (Table 13). In 2020, electricity imports will already have a 14.0% share of total primary energy supply. By 2050, the share of electricity will more than double to 33.6%. As co-generation and gas consumption will increase, in 2050 coal share will drop to 49.9%. To contribute to the overall reduction of CO2-intensity, by 2020, there will be renewable power generation of 0.084 PJ.
Table 14 shows the Wuxi CO2-balance until 2050. Until 2020, CO2-emissions increase by 103.1% to 121 Mt, until 2050 by 301.2% to 238 Mt. In the following sections, the development of the sectoral CO2-emissions are described in detail.
Most of the CO2-emissions are due to coal combustion and imported electricity (Table 15). In 2005, CO2-emissions per capita were 10.3 tons. By 2020, per capita emissions will reach 18.2 t, by 2050 42.6 t. Compared to the current consumption in 2010 [24] in the US (19.1 t), Germany (10.1 t) or the current Chinese average (6.4 t), this is very high. In a post Kyoto regime, the determination of per capita emissions may be important for the allocation of emission rights [25].
According to the Kaya Identity [26], CO2-emissions can be expressed as an ex-post identity of the following factors: population, Gross Value Added per capita, energy intensity of Gross Value Added and CO2-intensity of energy consumption. Here, we define it as:
CO2 = CO2/PES * PES/GVA * GVA/POP * POP (15)
with CO2 = CO2-emissions (Mt);
PES = Primary Energy Supply (PJ);
GVA = Gross Value Added (Mill. RMB);
POP = Population (Mill.).
Figure 2 shows the development of the factors in the Kaya Identity in Wuxi. Clearly, it can be seen that the energy intensity of Gross Value Added decreases over time according to the Low Carbon City plan in Wuxi. The same is for population and CO2-intensity of Primary Energy Supply. Per capita income, however increases considerably.
To show the impact of the different factors, the development is shown relative to the year 2005 (Figure 3). Kaya Identity factor decomposition shows that the increase of per capita income has the largest impact on the growth of CO2-emissions and the decrease of energy

Figure 2. Development of macro-economic variables in Wuxi without implementation of the Low Carbon City Plan (1991- 2050, in specific values). Source: Own calculation.

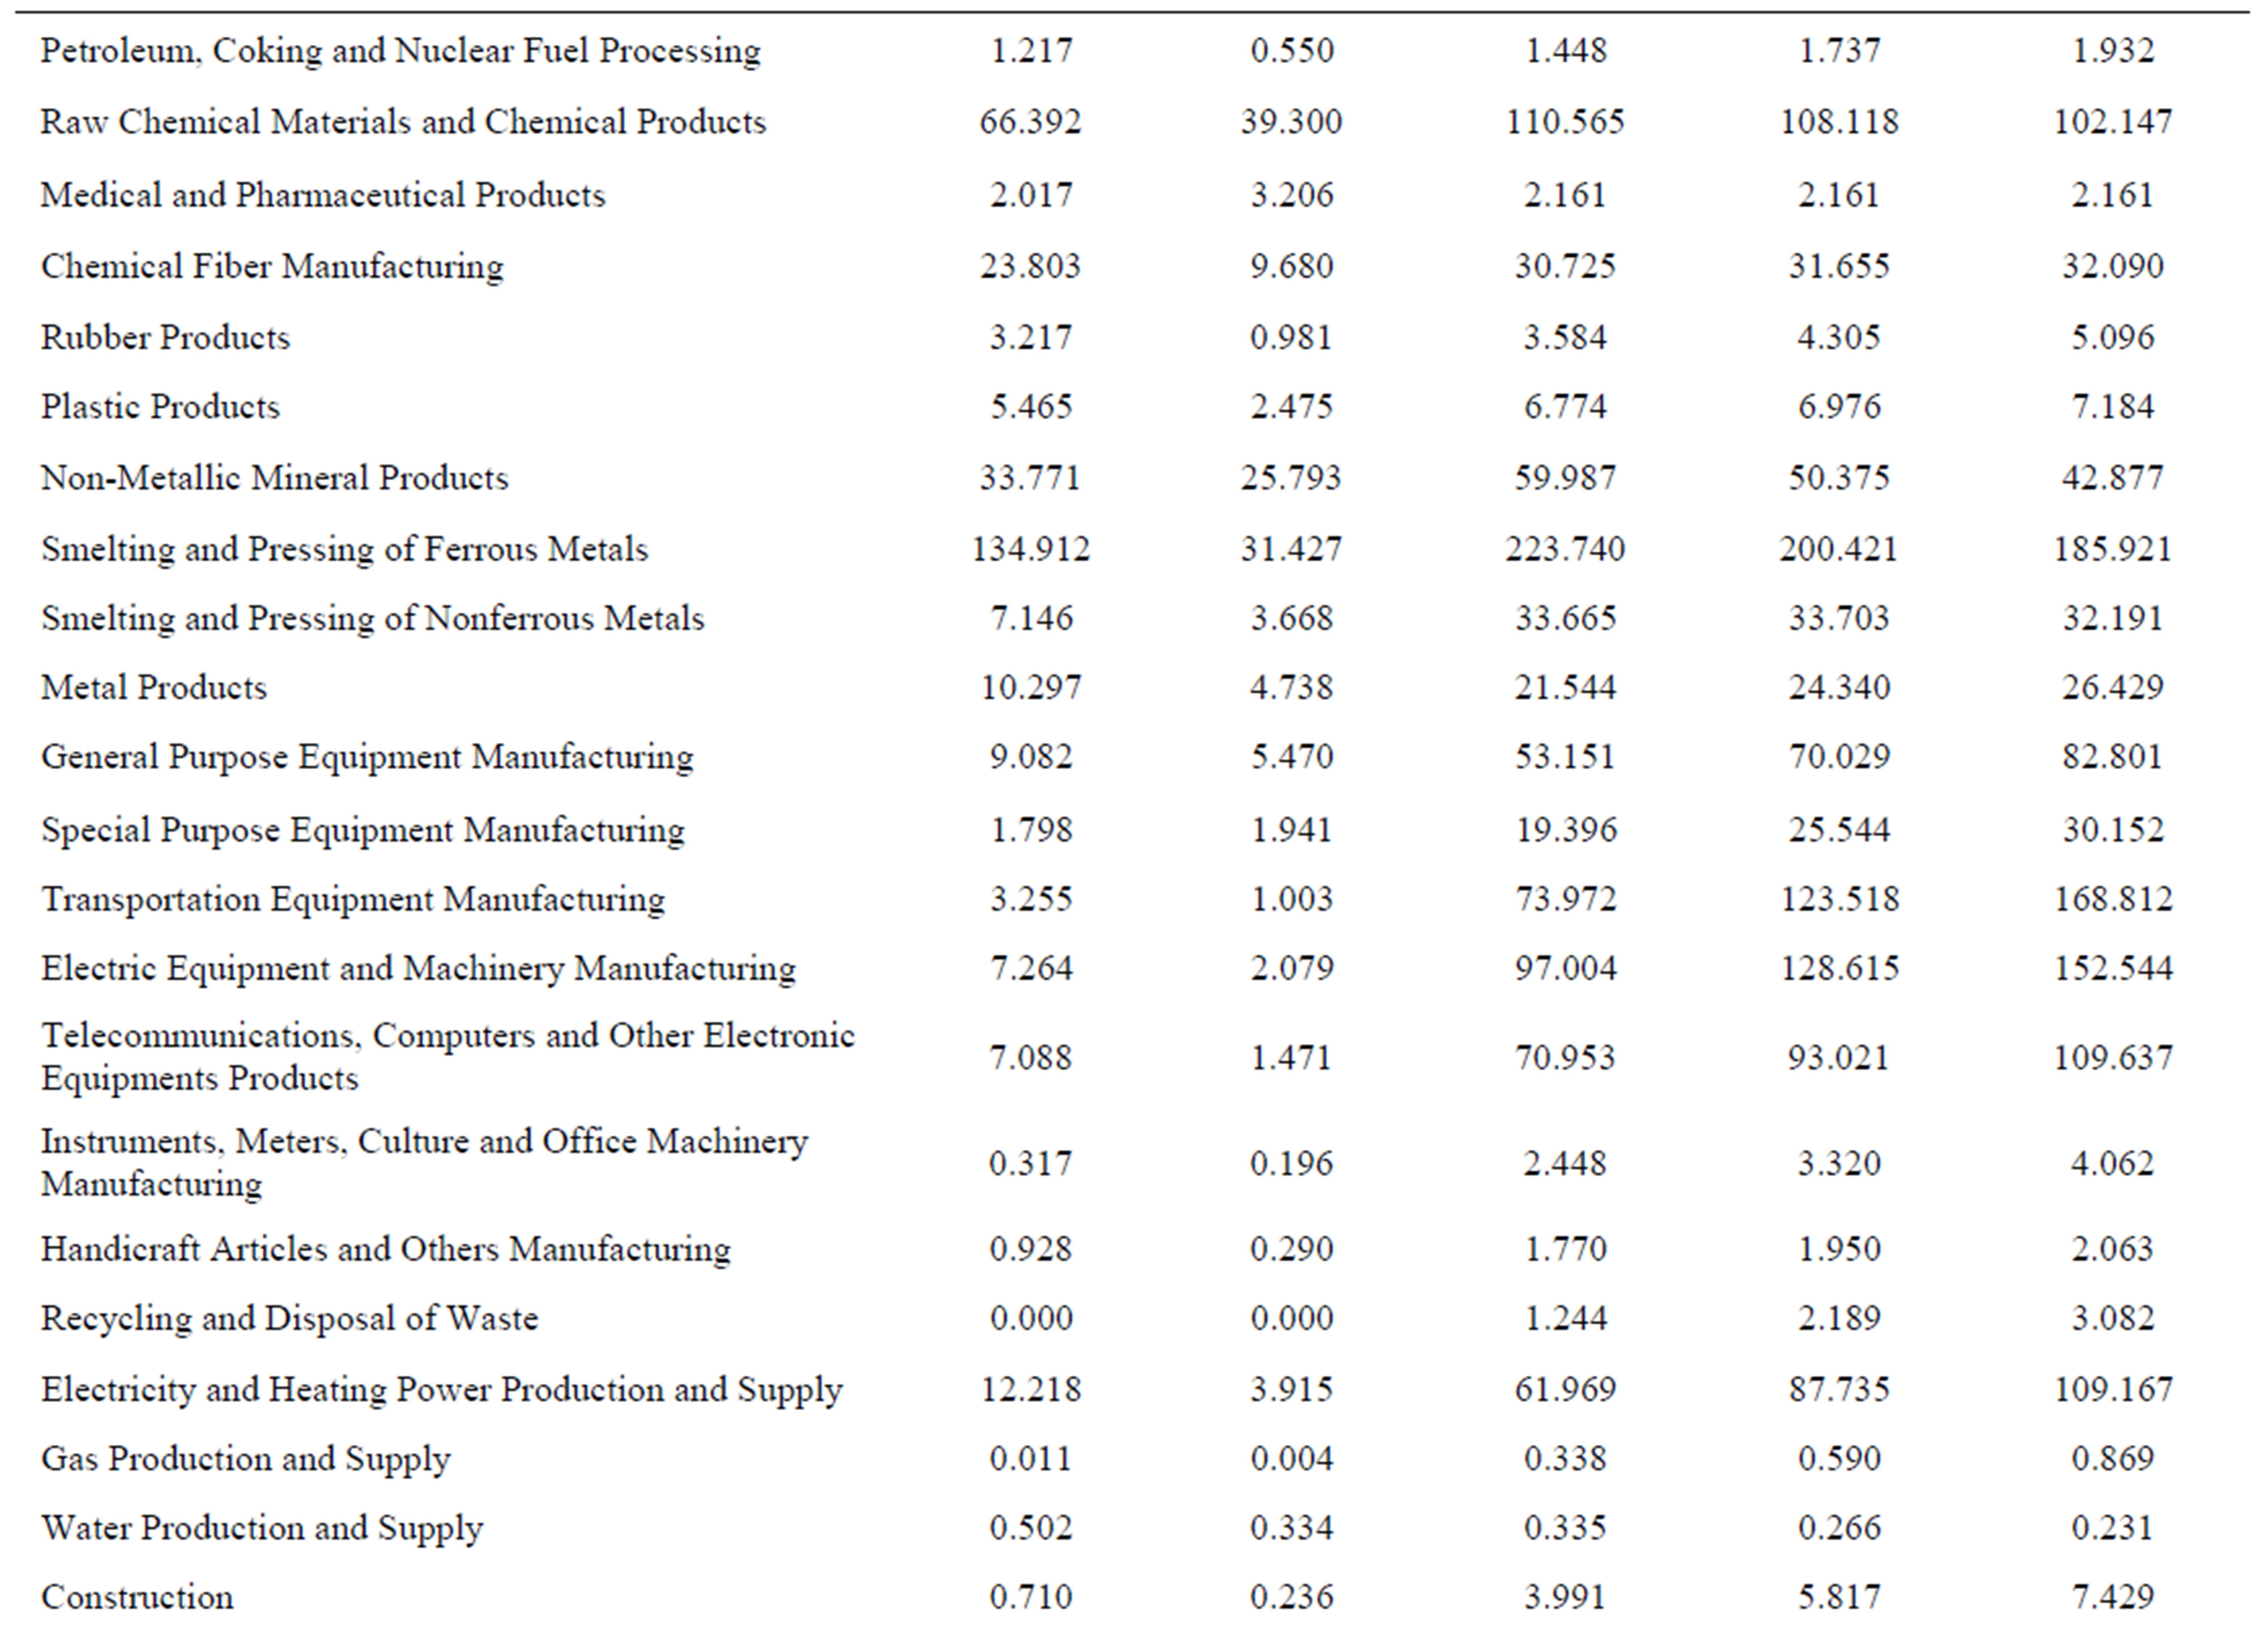

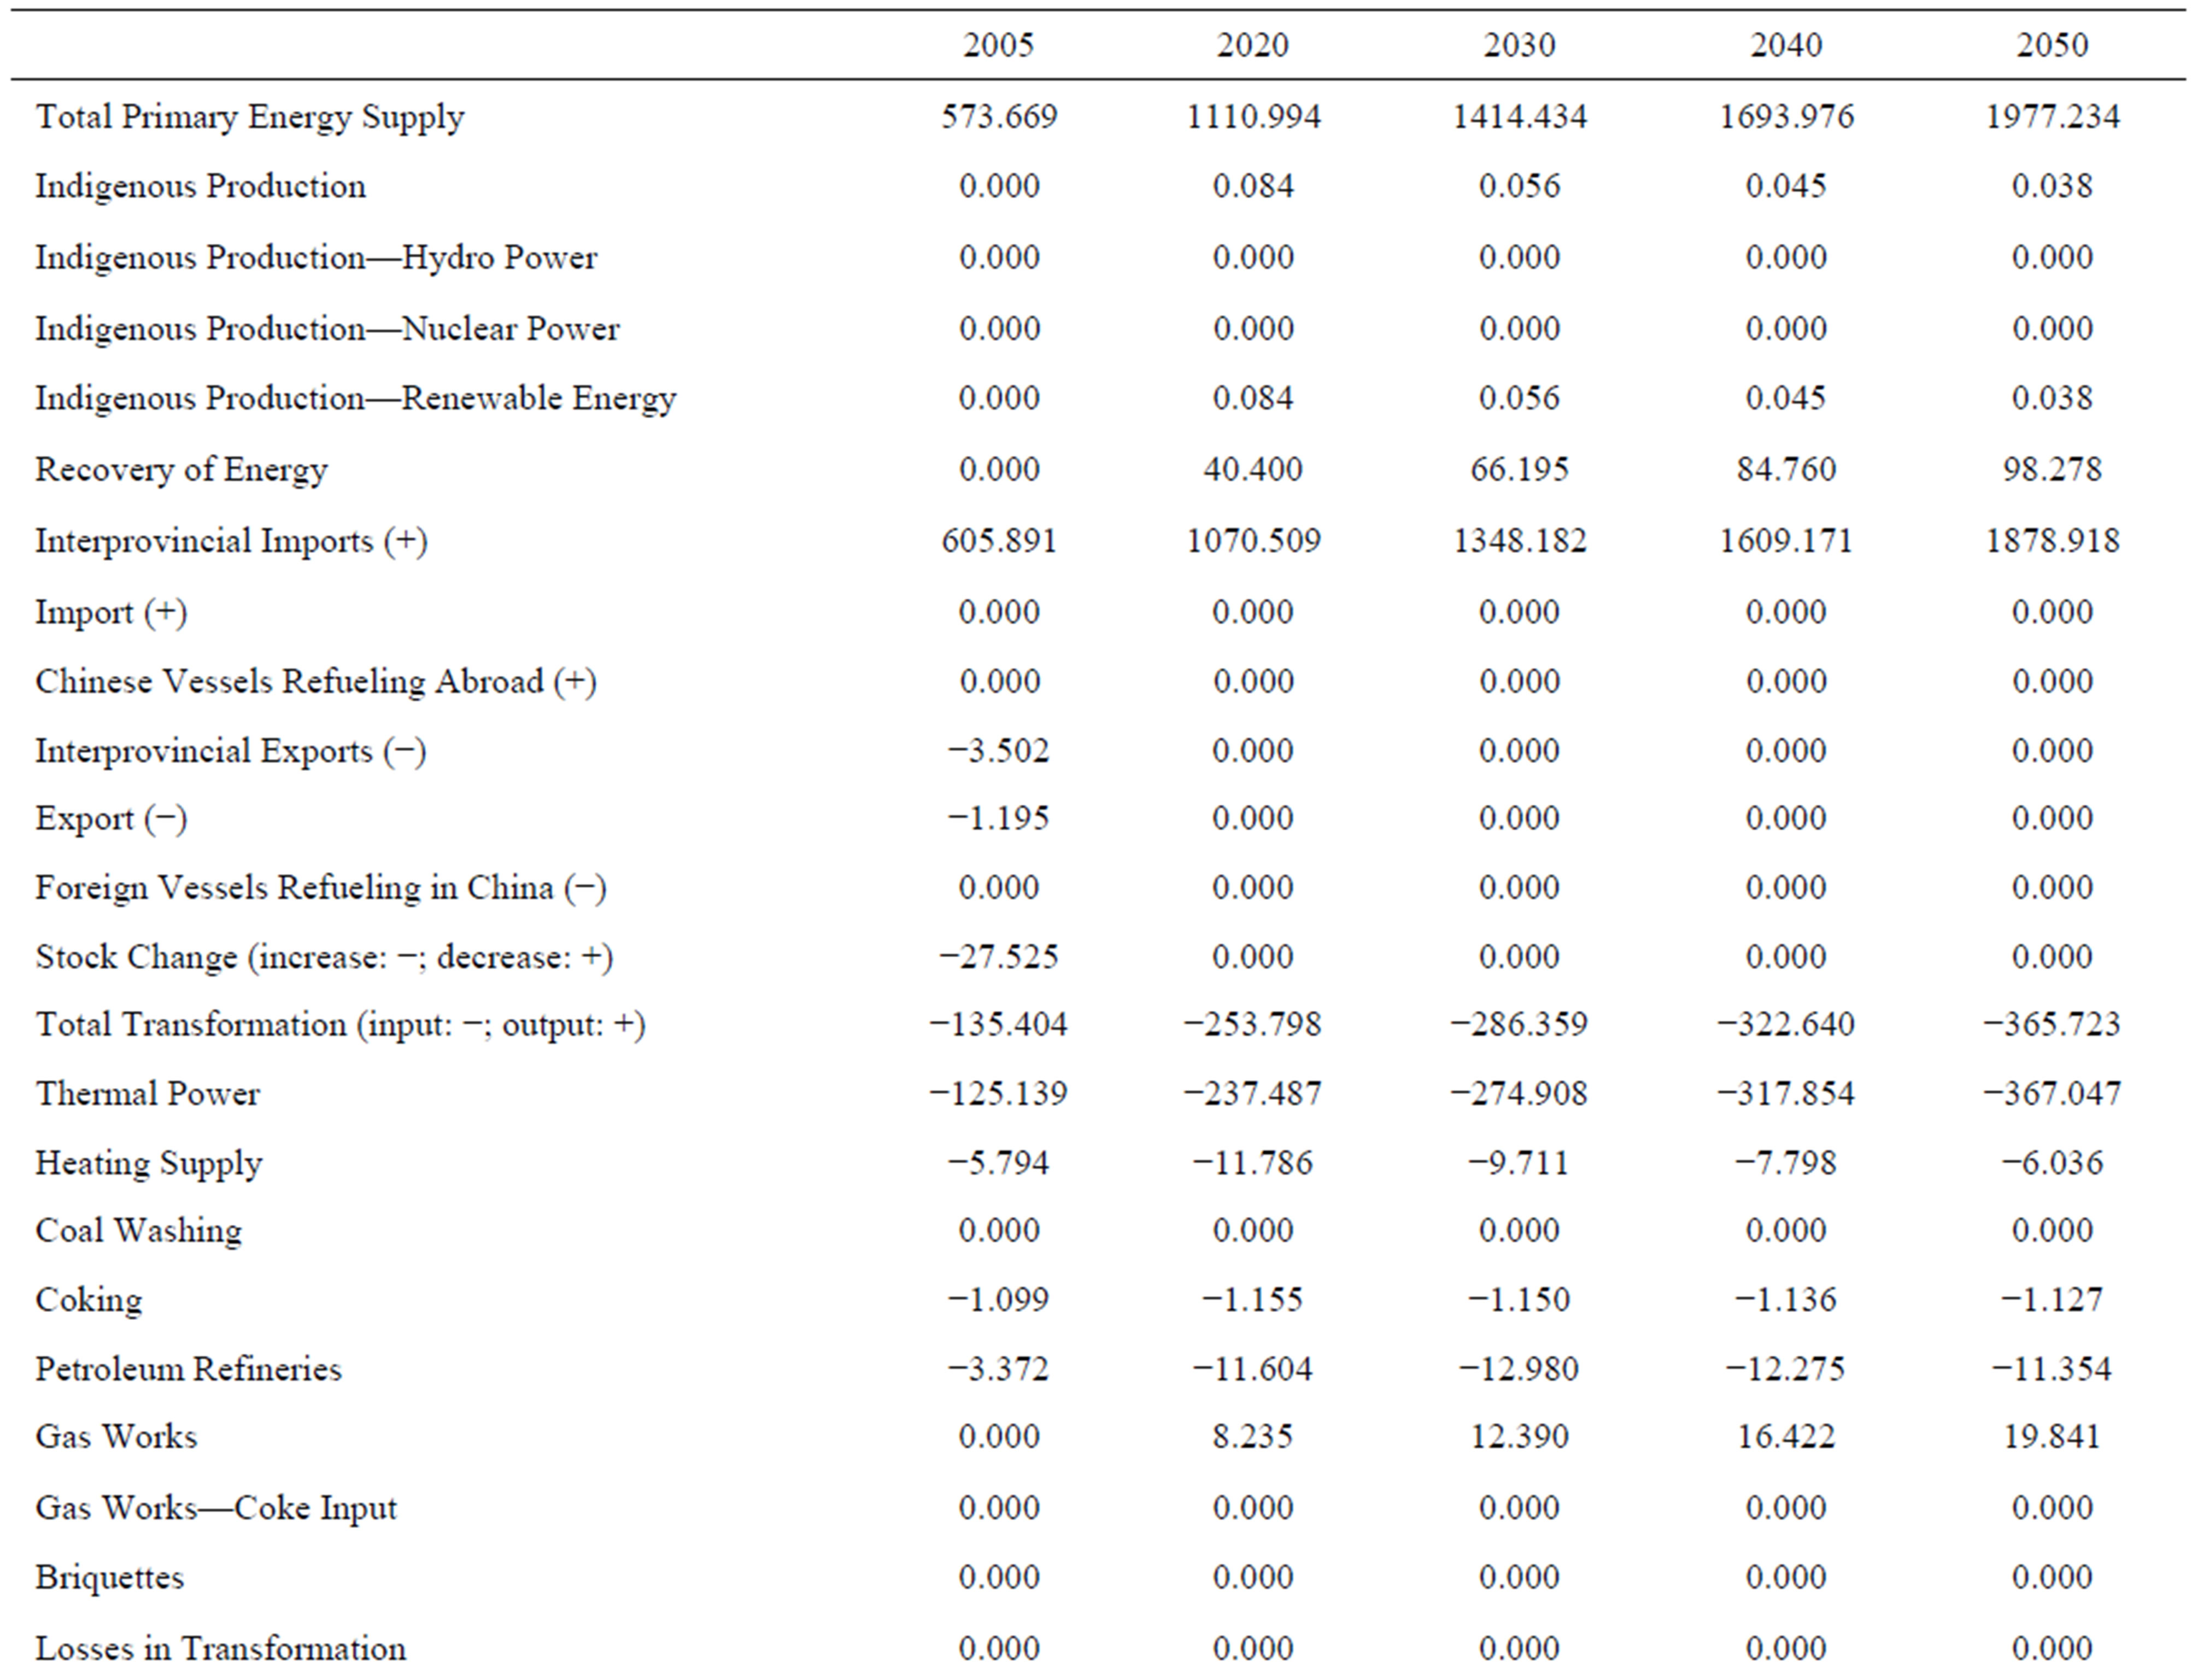
Table 12. Wuxi energy balance without implementation of the Low Carbon City Plan (2005-2050, in PJ).

Table 13. Primary energy mix Wuxi without implementation of the Low Carbon City Plan (2005-2050, in PJ).


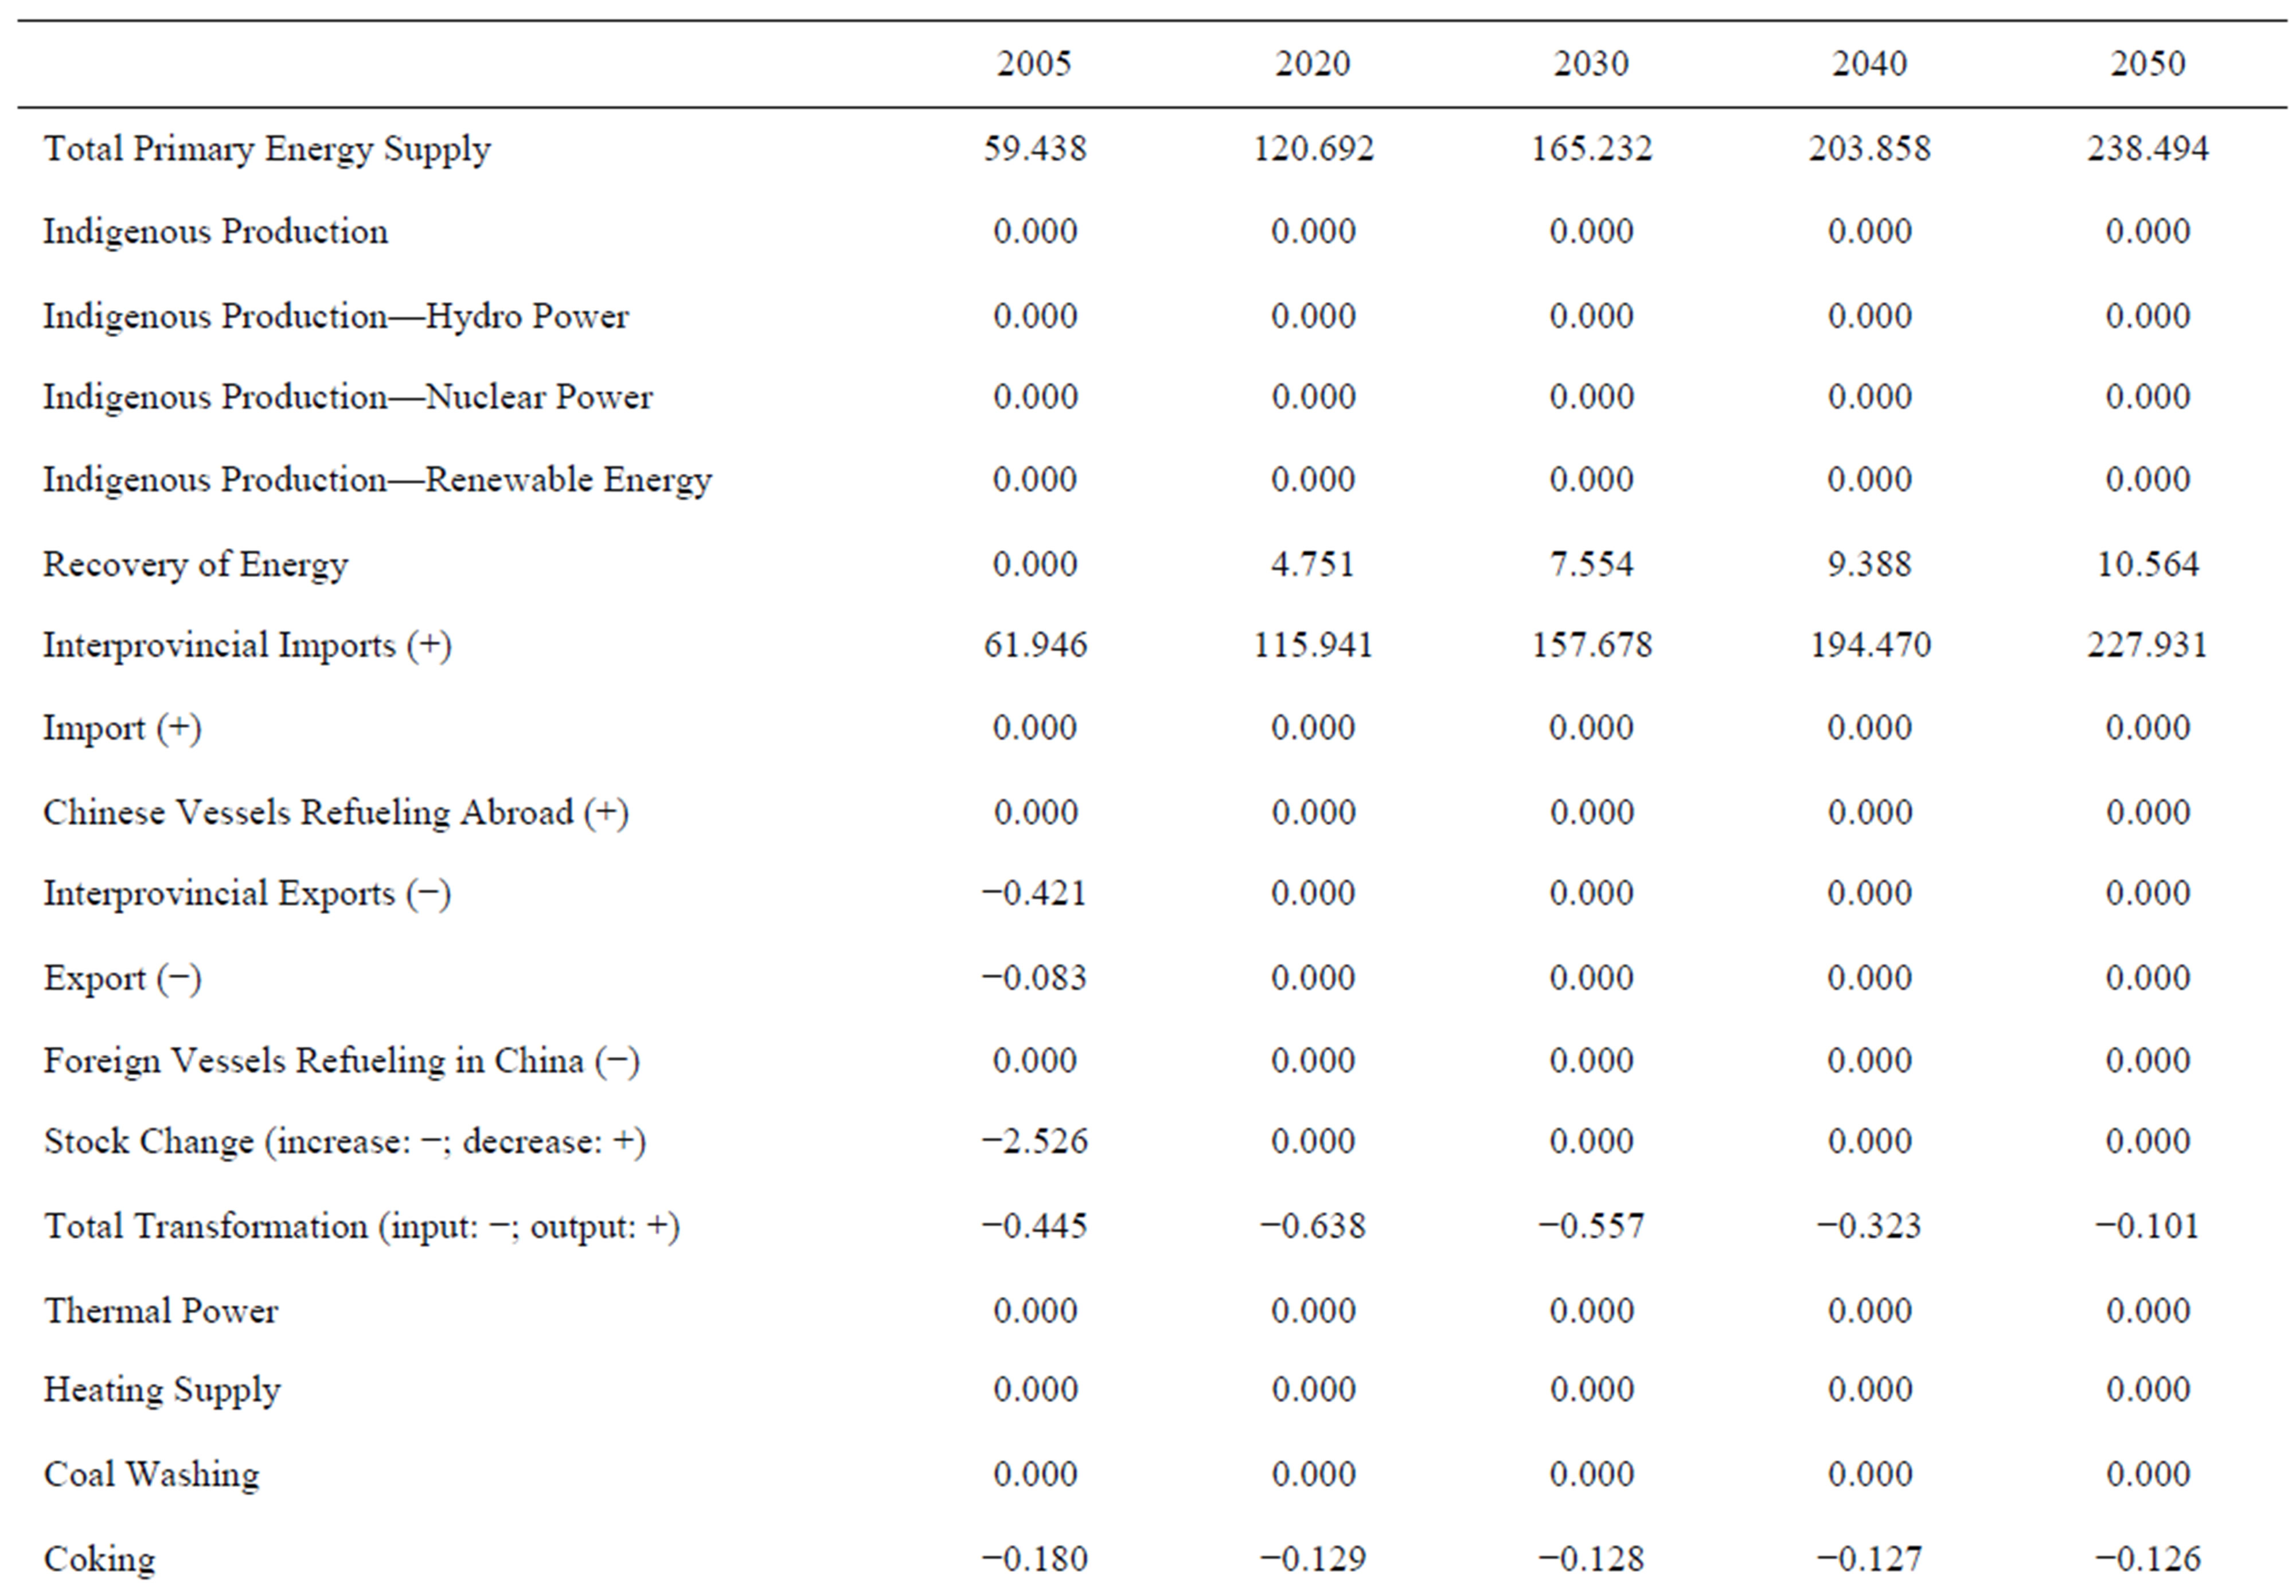
Table 14. Wuxi CO2-balance (2005-2050, in Mt).

Table 15. CO2-mix in Wuxi without implementation of the Low Carbon City Plan (2005-2050, in PJ).
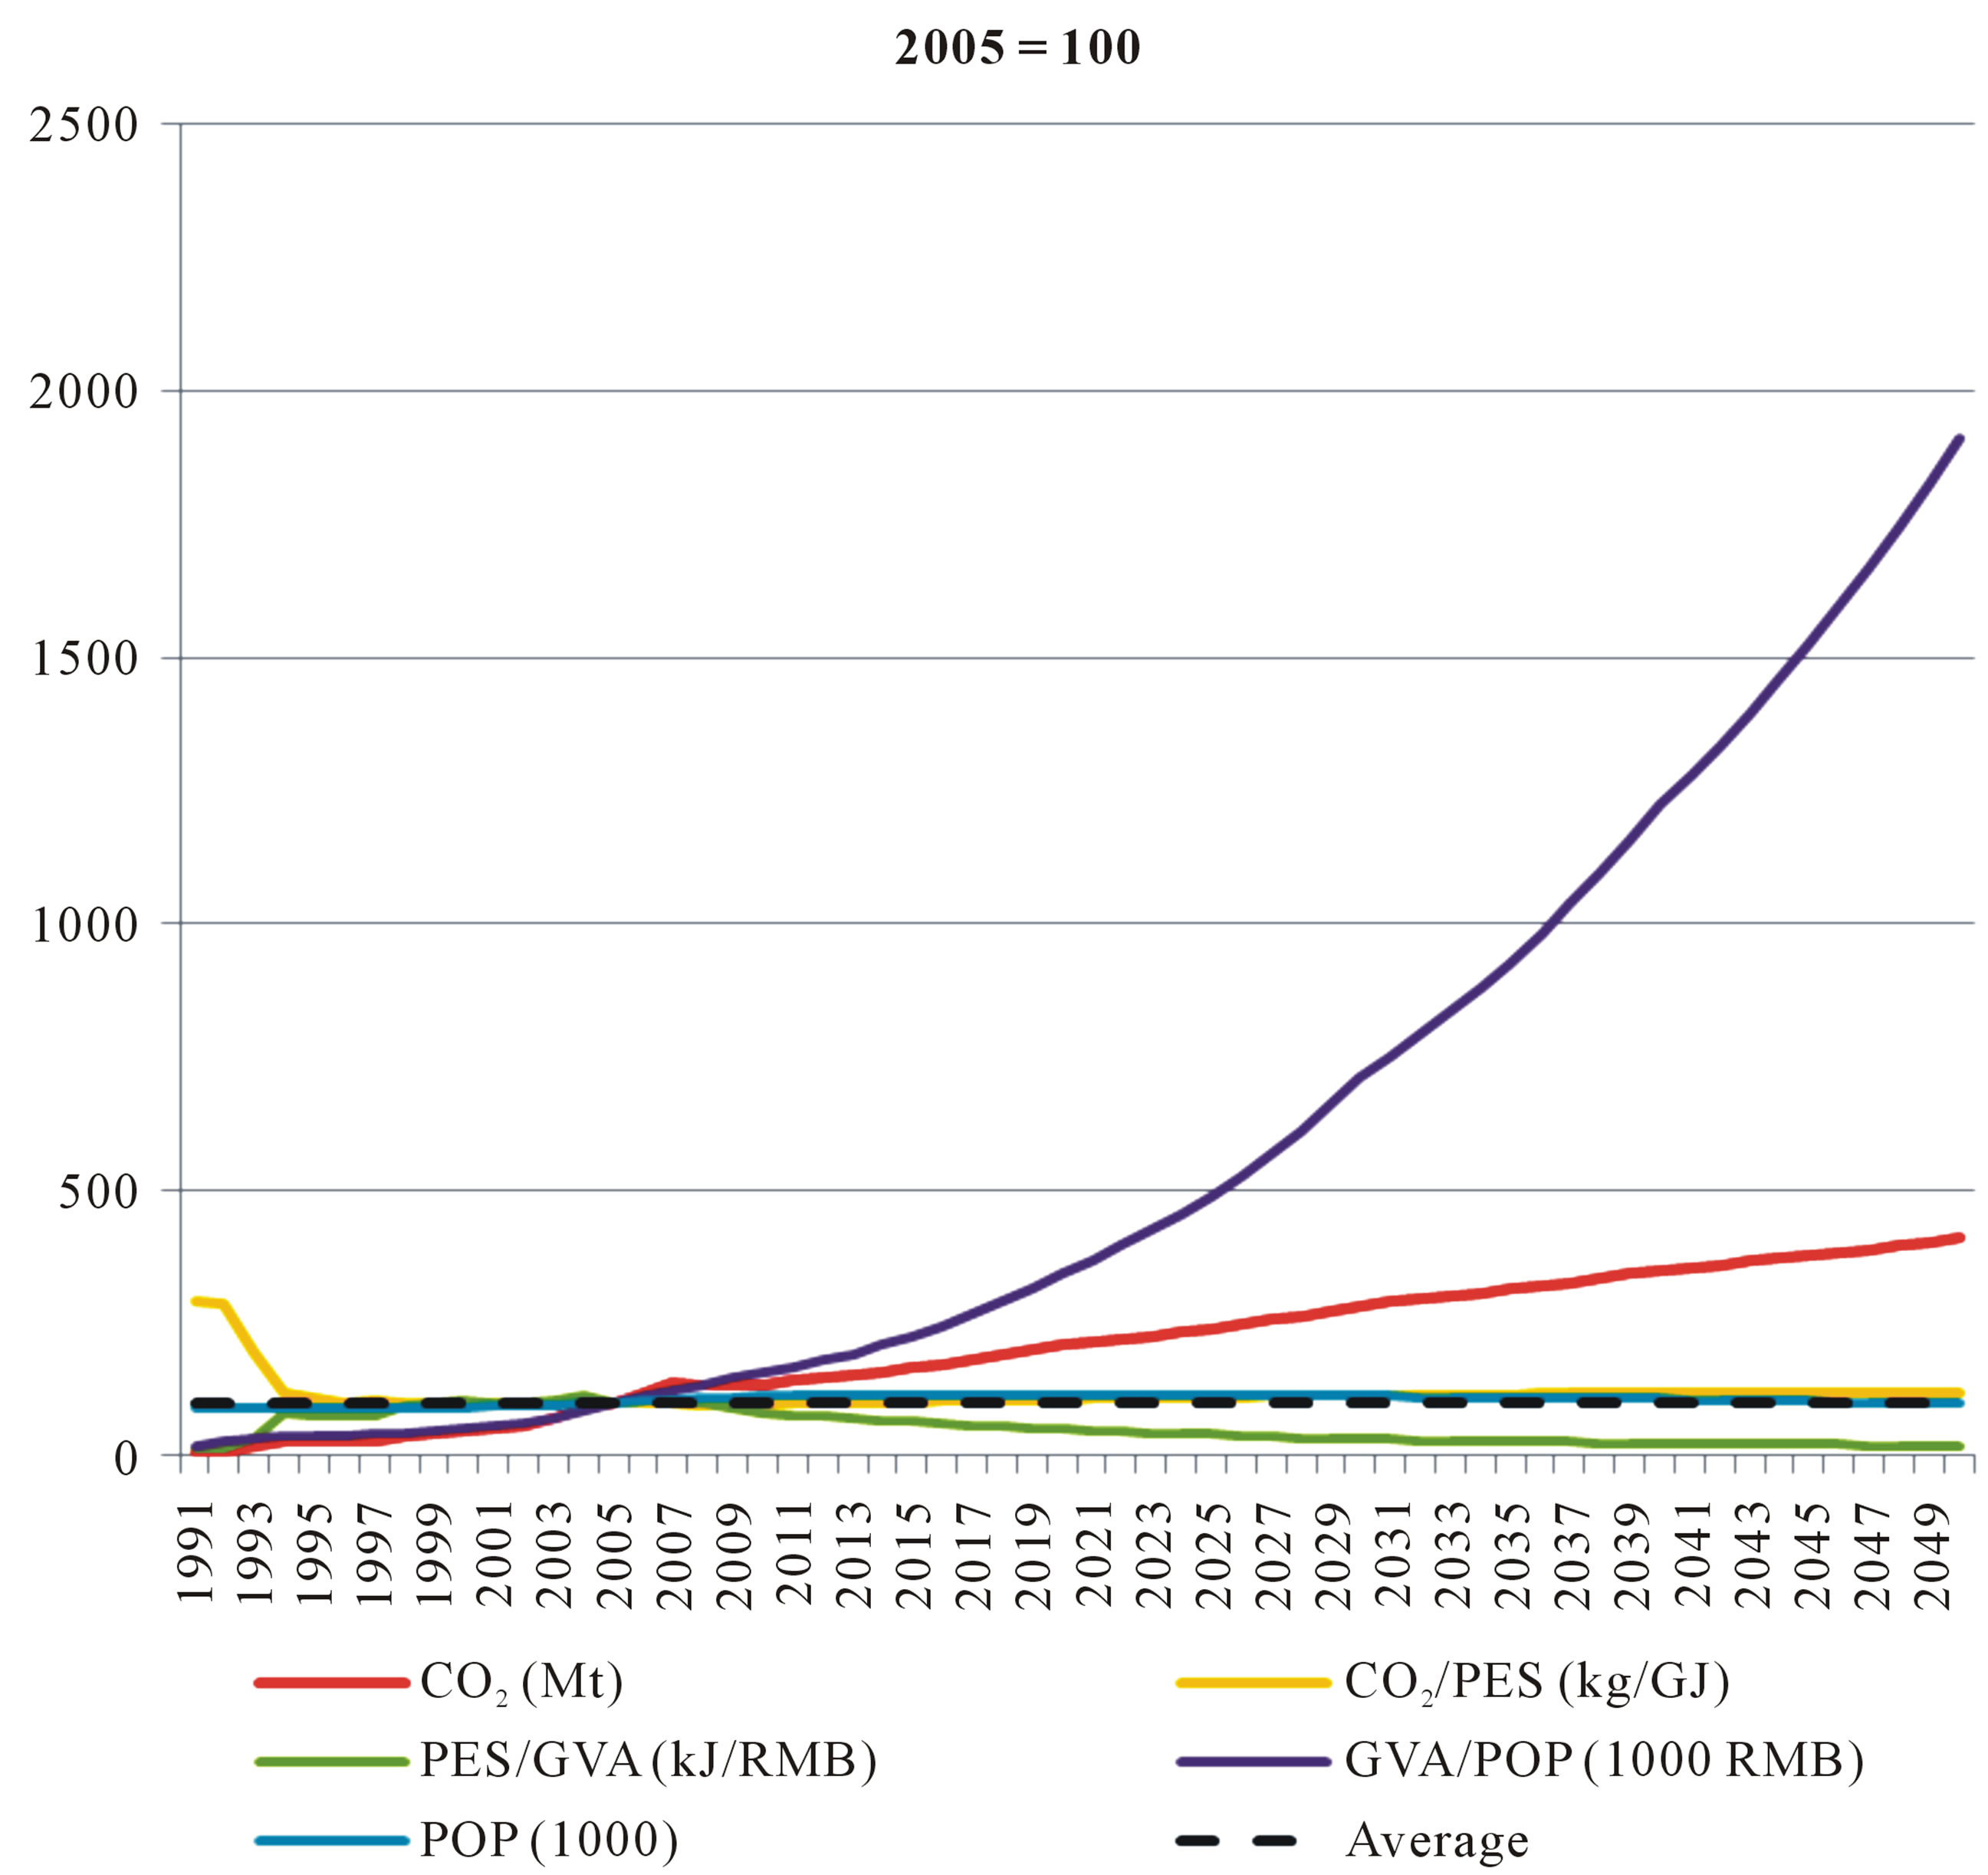
Figure 3. Development of macro-economic variables in Wuxi without implementation of the Low Carbon City Plan (2005 = 100). Source: Own calculation.
intensity of Gross Value Added the largest impact on the reduction of CO2-emissions in Wuxi. A decrease of population and CO2-intensity of Primary energy supply are only average.
Total Final Energy consumption in Wuxi will increase by 95.6% in 2020 and 271.3% in 2050. The average final energy consumption of all economic sectors also shows the shift away from coal to electricity and gas (Table 16). Related CO2-emissions will grow by 103.9% to 117 Mill. tons in 2020 and by 300.4% to 230 Mill. tons in 2050.
3.2. Electricity and Heat Generation
In Wuxi electricity is generated through coal combustion, and this will not change in the future, in 2005, 99.5% is coal, only a very small fraction diesel or fuel oil. According to the low carbon city plans, natural gas will increasingly used for power generation. In 2050, the share of natural gas will increase to 1.7% (Table 17). Between 2005 and 2020, CO2-emissions from power generation will increase by 90.0%, by 2050 even by 214.6% against 2005. Only 0.084 PJ will be generated with renewable energies in 2020 and 0.038 PJ in 2050.
Efficiency of thermal power generation will increase from 40.9% in 2005 to 41.4% in 2020 and 45.3% in 2050. Efficiency may relatively high on the average, if flue gas desulphurisation is not done.
Heat generation in Wuxi is 100% coal. As Wuxi is south of the Yangtse River, there is no central heating in Wuxi. Hence, the heat generated is entirely process heat. Residential heat demand in winter time is mostly generated with electricity or liquefied gas. According to the assumptions of the model until 2020, energy efficiency of heat generation will grow by 2.2% in 2020 and 11.8% by 2050 against 2005. Most importantly, an increasing share of heat is generated in combined heat and power plants. In 2020, 40PJ heat will be from CHP, in 2050 CHP will generate 98PJ of process heat (Table 18). The Wuxi energy balance, however, does not show how much electricity is generated in the CHP plants. It is assumed to be included in the total electricity output.
3.3. Agriculture
In the past, agriculture production developed stably in the last years. Wuxi City Government intends to push forward

Table 16. Energyand CO2-mix and related intensities of total final energy consumption in Wuxi without implementation of the Low Carbon City Plan (2005-2050).

Table 17. Mix of energy and CO2 in power generation in Wuxi without implementation of the Low Carbon City Plan (2005- 2050).

Table 18. Mix of energy and CO2-emissions in heat generation in Wuxi without implementation of the Low Carbon City Plan (2005-2050).
the adjustment of agriculture structure energetically, optimize the supply structure of agriculture products and satisfy the market demands efficiently. The annual yield of crops was 805,100 tons, which was 0.7% up over last year. Main agricultural products in 2009 are: grain (0.81 Mill. tons), oil-seeds (18,426 tons), silkworms (130 tons), tea (6866 tons), fruits (137,960 tons), pork (64,837 tons), aquatic products (121,690 tons). The average distance from agricultural production in Wuxi rural areas to Wuxi urban area are about 20 - 30 km. The 2009, gross output of oil plants rose by 8.5% with 18,400 tons and the yield of rapeseeds was 17,100 tons, up by 7.2% compared to the previous year. The amount of cocoon production was 130 tons, indicating a decrease by nearly 45%. Throughput of tea and fruits in-creased by 1% and 6.7% respectively up to 6866 tons and 137,960 tons [11].
According to the model assumptions, final energy consumption (which is only electricity in the available energy balance data) in the agricultural sector will grow by about 151.5 in 2020 and 496.2% in 2050 compared to 2005 (Table 19).
Due to the reduction of CO2-intensity of electricity

Table 19. Final energy consumption, CO2-emissions and related intensities in the agricultural sector in Wuxi without implementation of the Low Carbon City Plan (2005-2050).
generation in 2020 by 10.1%, CO2-emissions per Gross Value Added decreased by 16.7% in 2020 and will increase by 1.3% in 2050 compared to 2005.
3.4. Industry
Currently Wuxi has two large industrial parks devoted to new industries. While being the current manufacturing centers on textiles, there are projects to move to electric motor manufacturing and software development. Wuxi is the solar technology hub in China with two major photovoltaic companies (Suntech Power and Jetion Holdings Ltd) based in the city and listed on overseas stock exchanges. Currently, industry Gross Value added in Wuxi is dominated by Smelting and Pressing of Ferrous Metals (13.8%), Electric Equipment and Machinery Manufacturing (12.8%) and Telecommunications, Computers and Other Electronic Equipments Products (12.8%), Raw Chemical Materials and Chemical Products (6.8%) and Textiles (5.5%). Wuxi is one of the top business cities in China. According to Forbes ranking, Wuxi is in the third position for best business cities in Mainland China in 2008.
In Wuxi, industrial production increased steadily. Industrial enterprises above designated size created a value added of 239.1 billion RMB including 59.4 billion RMB in the light industry sector and 179.7 billion RMB in the heavy industry sector in 2009, totally increasing 11.3%. In 2010, Gross Added Value in the industrial sector grew by 9.5% against 2009. For the 12th Five-Year Plan (2011- 2015), Wuxi strives to keep a stable and fast economic development and improve the influence and competitiveness in regional development and in comparison to other cities in China, as well as build an innovation-oriented city. Its per capita GDP is expected to see an annual growth by 10% in the coming years and local budgetary revenue is projected to grow by 12% annually. The expenditure on social research and development as percentage of the local GDP will be raised to above 3%. The contribution rate of science and technology will be over 65%. Employment and re-employment in Wuxi is also advancing steadily. In 2009, the net increase of employment was 85,000. The registered overall unemployment rate in Wuxi was 2.8% in 2009 [11].
In the future, final consumption and CO2-emissions in Wuxi are following the development of industrial output and the other exogenous variables in the model. Until 2020, total industrial energy consumption is increasing by 83.9% against 2005, until 2050 by 182.7% compared to 2005 (Table 20).
As for the energy mix, there will be a shift away from carbon-intensive coal to electricity with co-generation, heat and low carbon natural gas. CO2-intensity of energy consumption will decrease by 3.4% in 2020 and 6.5% in 2050 (Table 18). Based on the assumptions of the model, there will be a structural shift of energy consumption away from energy intensive sectors such as iron and steel or the chemical industry to light industry sectors such as electronics. In addition, tertiarisation of Gross Value Added shifts energy consumption to the less energy intensive service sector.
3.5. Construction and Service Sector
In Chinese statistics, construction belongs to Secondary Industry. In Wuxi, construction contributed 3.7% of total Gross Value Added in this aggregate in 2010. Until 2020 and beyond, it is assumed as one of the fastest growing sectors in Wuxi (Table 21). With increasing income, the demand for modern accommodation in Wuxi is growing. And as currently, the life cycle of new buildings is only around 20 years, construction demand will continue to be high.
Between 2005 and 2020, final energy consumption in the construction sector (which in the available energy balance is only electricity) is expected to grow by 200%, until 2050 even by 946%. Despite a reduction of CO2- intensity of final energy consumption of 10.1% in 2020,

Table 20. Final consumption, CO2-emissions and related intensities in the industrial sector in Wuxi without implementation of the Low Carbon City Plan (2005-2050).

Table 21. Final consumption, CO2-emissions and related intensities in the construction sector in Wuxi without implementation of the Low Carbon City Plan (2005-2050).
the growth rates of CO2-emissions per Gross Value Added of this sector in Wuxi are slightly below average (Table 21).
In 2010, the tertiary sector counts for 42.8% of total Gross Value Added in Wuxi, most of it is Wholesale and Retail (14.6%) and Real Estate (6.3%) and are one of the fastest growing aggregate in Wuxi (Table 22). This leads to a considerable growth of energy demand and CO2- emissions in the city, by 2050 energy consumption will twentyfold, due to a reduction of the CO2-intensity of

Table 22. Energy and CO2-intensities of gross value added in the service sector in Wuxi without implementation of the Low Carbon City Plan (2005-2050).
energy consumption of 10.1%, the CO2-emissions will almost fifteenfold.
3.6. Residential Sector
In 2010, the residential sector was responsible for 3.4% of total final energy consumption in Wuxi, 2.4% in rural areas and 1.0% in urban areas. Hence, currently, the residential sector is only a minor source of CO2-emissions in the city. Due to the large share of CO2-intensive electricity, the total residential share of CO2-emissions is slightly higher (5.6%). Between 1991 and 2010, per capita real Gross Value Added ninefolded from about 8600 RMB to 77500 RMB [13].
Until 2020, per capita income is assumed to grow by 246% against the 2005 values, in 2050 by 1812% to a value of 993000 RMB. Against this background, the contribution of the residential sector to final energy demand and CO2-emissions are expected to almost nineteenfold (energy) and elevenfold (CO2) (Table 23). By 2020, the residential share of total energy demand will grow to 4.9% (2010: 2.4%), by 2050 even to 13.3%, CO2- emissions will cover 7.8% resp. 17.4% in 2050. This is a large increase. By 2050, per capita emissions in Wuxi will only reach 7.4 tons (16.3 tons in rural areas and 5.0 tons in urban areas).
According to the Wuxi City Statistical Bureau, most of the energy is electricity (2005: 95%), a minor fraction is gas (LPG and natural gas). Energy for private transport (mainly gasoline) is not explicitly included in the Wuxi energy balance. It can be assumed that it is part of the industrial gasoline consumption as, at least in the past, a large fraction of the cars had been owned by the companies. However, here, the city statistics have to improve in the future.
By 2020, the share of gas will increase (23.7%), but drop back to 18.6% in 2050 because of the increase of electricity utilization due to a larger use of electricity for cooling purposes and other electrical household appliances (Table 24).
4. Expected Development until 2050 under the Low Carbon City Plan
4.1. Overview
Through the implementation of the Low Carbon City plan, Primary Energy Supply in Wuxi will reach about 990 PJ in 2020 and about 1800 PJ in 2050 (Table 25). In 2020, Primary Energy Supply will decrease by 10.8% in 2020 and by 9.1% by 2050 against the business as usual development following the national trend.
Especially, coke imports and coke consumption will decrease through the shift of steel production away from the traditional blast furnace technology based on the reduction of iron ore with coke to the utilization of electric furnace steel process. By 2020, coke consumption will decrease by 32.8% in 2020 and 55.1% in 2050 against the Business as Usual scenario. Against 2005, coal consumption in Wuxi will increase vs. 2005 (53.7% in 2020 and 99.2% in 2050), but much slower than without the implementation of the Low Carbon City plan. Compared to this, coal consumption will drop by 9.3% in 2020 and 10.7% in 2050.
CO2-emissions in Wuxi from Primary Energy Supply will grow by 83% in 2020 and by 273% in 2050 vs. 2005 (Table 26), but will decrease by 11.4% in 2020 and by 8.5% in 2050 against the BAU-scenario.
Implementing the Wuxi Low Carbon City plan, in absolute terms, Total Final Energy Consumption will grow by 73.4% in 2020 and by 234.6% in 2050 (Table 27), but will decrease by 11.3% and 9.0% in 2050 against the BAU-scenario.
CO2-emissions from Final Energy Consumption will decrease by 10.2% in 2020 and by 7.4% in 2050 against the BAU-scenario. These additional emission reductions accrue from the reduction on coke (−29.2% in 2020 and 48.0% in 2050) against the trend without specific low carbon policies in Wuxi. Energy intensity of Gross Value

Table 23. Energy and CO2-intensities of gross value added in the residential sector in Wuxi without implementation of the Low Carbon City Plan (2005-2050).

Table 24. Mix of energy and CO2 in the residential sector in Wuxi without implementation of the Low Carbon City Plan (2005-2050).
added will decrease by 11.4% in 2020 and by 9.1% in 2050 compared to the BAU-scenario.
In absolute terms, CO2-emissions from total final energy consumption per unit of Gross Value Added will decrease by 53.7% in 2020 and by 80.1% in 2050 compared to 2005. Until 2020, this well represents reaching the quantitative goal of a 50% reduction of the CO2-intensity of Gross Value Added as stipulated in Wuxi’s Low Carbon City plan.
The sectoral structure of final energy consumption in Wuxi will shift from industry to the other sectors, mainly the residential and service sector, and so does its average

Table 25. Primary energy mix Wuxi under the Low Carbon City Plan (2005-2050, in PJ).

Table 26. CO2-emission mix in Wuxi under the Low Carbon City Plan (2005-2050, in PJ).
sectoral CO2-intensity. In 2005, about 95% of final energy consumption was in the industrial sector (Table 28). In 2020, the share of industry will drop down to 88.8% and to 71.2% in 2050. In 2050, the residential energy demand will count for 17.5% of total final energy consumption (2005: 3.1%) and the service sector for 10.6% (2005: 1.8%). As the CO2-intensity of energy consumption in the non industry sectors is much higher than in industry (in the available data for agriculture, construction and services, it is only electricity), CO2-intensity of Total Final Energy Consumption will increase by 5.5% in 2020 and by 10.7% in 2050 against 2005.
However, as at the same time, the sectoral structure changes lead to a shift from the energy intensive industry to energy extensive service sectors and the residential sector, the average CO2-intensity of Gross Value Added will decrease as described in Table 29.
4.2. Electricity and Heat Generation
According to the Wuxi Low Carbon City Plan, main measures in electricity and heat generation are:
• energy efficiency improvements• promotion of power generation from gas and renewable energies, and
• fostering the utilization of combined heat and power generation [11].
Even in the Low Carbon City scenario, electricity is generated through coal combustion. According to the low carbon city plans, natural gas will increasingly used for power generation. In 2050, the share of natural gas will increase to 1.7% (Table 30). Between 2005 and 2020, CO2-emissions from power generation will increase by 80.5%, in 2050 even by 198.8% against 2005.
Compared to the BAU-scenario, additional CO2-emissions are realized through the increase of energy efficiency in power generation. It will increase from 40.9% in 2005 to 43.6% in 2020 (BAU: 41.1%) and 47.7% (BAU: 45.3) in 2050 (Table 30). This leads to a 5% reduction of primary energy input in power generation.
In addition to the energy efficiency gains, 0.139 PJ will be generated with renewable energies in 2020.
Due to the Low Carbon City plan, energy efficiency in heat generation shall increase. By 2020, energy efficiency of heat generation will grow by 7.6% in 2020 and 17.7% by 2050 against 2005 (Table 31). Compared to the BAU-scenario, energy efficiency will increase by 4.2 percentage points in 2020 and 4.6 percentage points in 2050 and reduce CO2-emissions from heat generation by

Table 27. Final energy consumption and CO2-emission mix in Wuxi under the Low Carbon City Plan (2005-2050, in PJ).

Table 28. Development of sectoral total final energy consumption and its CO2-intensities in Wuxi (2005-2050, in % and kg CO2/MJ).

Table 29. Develoment of sectoral CO2-intensity of gross value added in Wuxi (2005-2050, in kg CO2/RMB).

Table 30. Mix of energy and CO2 in power generation in Wuxi under the Low Carbon Plan (2005-2050).

Table 31. Mix of energy and CO2 in heat generation in Wuxi under the Low Carbon Plan (2005-2050).
0.3 Mt in 2020 and 0.2 Mt in 2050.
4.3. Agriculture
As for the agricultural sector, the Wuxi Low Carbon strategy includes the following targets:
• To develop a low-carbon agriculture;
• To strengthen ecological management and increase carbon sequestration. By 2015, the urban green space rate is envisaged to reach 41% of Wuxi urban area. The green coverage rate of total Wuxi area will reach 46%, the per capita green area will reach 15 m2, 33.15 km2 of wetland will be restored [12].
According to the model assumptions, final energy consumption in the agricultural sector will grow by about 153% in 2020 and 470% in 2050 compared to 2005 (Table 32). In 2050, final energy consumption is decreasing by 4.5% against the Business as Usual scenario without Low Carbon City plan.
Due to the reduction of CO2-intensity of electricity generation in 2020 by 10.1%, CO2-emissions per Gross Value Added decreased by 16.1% in 2020 and 3.2% in 2050 compared to 2005. With 16.1 the agricultural sector does not reach the target of a 50% reduction of CO2-intensity of GVA by 2020 compared to 2005. However, with 1.9% in 2010 and only 0.7% in 2050, the contribution of the agricultural sector to total Gross Value Added is very small.
4.4. Industry
According to the Wuxi City Low Carbon Plans, the industrial sector shall be made climate-friendly by taking the following steps for a low carbon development:
• To adjust the structure of the industrial sector;
• To adjust the political framework for industry;
• To adjust production technologies of industry;
• To achieve a more sustainable production in industry [12].
Final consumption and CO2-emissions in Wuxi are following the development of industrial output and the other exogenous variables in the model. Until 2020, total industrial energy consumption is increasing by 62.4% against 2005, until 2050 by 151.2% compared to 2005 (Table 33). Implementing the Low Carbon City plan in Wuxi, Final Energy consumption in the industrial sector decreases by 11.7% in 2020 and 11.1% in 2050 against the BAU-scenario. In the same period of time, industrial CO2-emissions decrease by 10.4% in 2020 and 9.2% in 2050.
As for the energy mix, there will be a shift away from carbon-intensive coal to electricity with co-generation, heat and low carbon natural gas. Based on the assumptions of the model, there will be a structural shift of energy consumption away from energy intensive sectors such as iron and steel or the chemical industry to light industry sectors such as electronics. In addition tertiarisation of Gross Value Added shifts energy consumption to the less energy intensive service sector.
Following the structural effect and the shift to low carbon energy sources, CO2-intensity of total industrial GVA will decrease by 50.6% in 2020 and 76.7% in 2050 (Table 33). Hence, for industry, the 50% reduction goal of CO2- intensity of GVA in 2020 compared to 2005 will be met.
4.5. Construction and Service Sector
Between 2005 and 2020, final energy consumption in the construction sector (electricity) is expected to grow by 183%, until 2050 even by 910%. With the implementation of the Wuxi Low Carbon City plan, final energy consumption drops by 5.7% in 2020 and by 3.5% in 2050 against the Business as Usual case. With 32.0%, the construction sector will not reach the average target of a 50% reduction of CO2-intensity of GVA by 2020 compared to 2005 (Table 34).
The tertiary sector is one of the fastest growing aggregate in Wuxi and has a considerable growth of energy demand and CO2-emissions in the city. The promotion of the tertiary sector is also one key to the reduction of the

Table 32. Final energy consumption, CO2-emissions and related intensities in the agricultural sector in Wuxi under the Low Carbon Plan (2005-2050).

Table 33. Final consumption, CO2-emissions and related intensities in the industrial sector in Wuxi under the Low Carbon Plan (2005-2050).

Table 34. Final consumption, CO2-emissions and related intensities in the construction sector in Wuxi under the Low Carbon Plan (2005-2050).
overall CO2-intensity of GVA as its sectoral CO2-intensity is much smaller than that of the industry (see Section 3.1). Implementing the Low Carbon City plan (Table 35), final energy consumption will grow slower than in the BAU-scenario (288.3% in 2020, BAU: 342.3%). CO2-intensity of final energy consumption also decreases by 10.1% in 2020 and by 22.9% in 2050 compared to BAU.
With 27.0% the tertiary sector, however, will not reach the target of a 50% reduction of CO2-intensity of GVA by 2020 compared to 2005 (Table 35). Based on the assumption of the model, it will take until 2050. On the whole economy, however, until then, this can be counterbalanced by the excess reductions of CO2-intensity in the industry sector and the structural change towards the less CO2-intensive tertiary sector (section 3.1 above).

Table 35. Energy and CO2-intensities of Gross Value Added in the service sector in Wuxi under the Low Carbon Plan (2005- 2050).
In sectoral disaggregation, energy and CO2-intensity of GVA will decrease in Commerce, Hotel and Catering Service due to the utilization of more energy efficient equipment, e.g. cooling. The same is for the sector Other Tertiary (Table 36).
As for the Transportation, Telecommunications, Postal Services, the intensities are likely to increase due to a growth of e-mobility for private and public transport services. Generally, the potential for energy efficiency gains in the tertiary sector is not so high as energy generally is not used intensively. Much is for office equipment and cooling. As for the latter, there is potential for efficiency gains, as for electrical office equipment, this is limited.
4.6. Residential Sector
As to the Wuxi Low Carbon City Plan, main elements of for residential consumption are:
• Establishment of mechanisms for the adjustments of behavioral patterns of the consumers;
• To increase residents’ awareness of the need of a low carbon development [12].
Implementing the plan, final energy consumption in Wuxi will increase by 279.4% in 2020 and 1812.4% in 2050 compared to 2005 (Table 37). Against the BAUscenario, energy consumption will decrease by 6.1% in 2020 and 2.7% in 2050. Per capita emissions decrease by 7.1% in 2020 and 3.0% in 2050 compared to the BAU scenario.
In 2020, final energy consumption in the residential sector will increase by 280%, in 2050 by 1812.4% (Table 38), but slower than in the BAU-scenario. Here, most of the additional CO2-emission reductions are from electricity savings (2020: 0.6 Mt; 2050: 1.2 Mt) for cooling and in the use of other electrical appliances.
5. Summary
Urbanisation, and climate change are one of the greatest challenges of the 21st Century. Hence, tackling climate change in urban environments through the implementation of a Low Carbon Economy in cities is the appropriate approach to encounter both issues at the same time. In 2010, the Chinese government introduced a program with 13 pilot regions to establish such a Low Carbon Economy. In addition, many other major cities in China are developing their own Low Carbon City Plan to contribute to the national target to reduce CO2-intensity of GDP by 40% - 45% in 2020 compared to 2005. One if these cities is Wuxi in Jiangsu Province with a population of 6.4 mill inhabitants and being a major hub for textile, iron and steel and recently also for solar energy industry in China.
In 2010, the City government issued a Low Carbon City Plan to develop Wuxi in agriculture, industry, transport, buildings and residential consumption in a sustainable way by 2020. Goal is to even go beyond the national target and achieve a 50% reduction of the CO2- intensity of GDP by 2020 vs. 2005.
Based on data from the Wuxi Statistical Yearbook and other sources, in this paper, an econometric energy supply and demand model was developed to estimate and forecast the Wuxi Energy and CO2-Balance between 2011 and 2050 for the single aggregates of Primary Energy Supply, the transformation sector and Final Energy Consumption for 17 energy sources and 46 economic sectors.
Two scenarios were developed1) A Business as Usual Scenario following the sectoral development predicted for China and 2) A Low Carbon Scenario with specific targets for each of the economic sectors to reach the carbon intensity targets of Gross Value Added in 2020 (50% vs. 2005) and beyond (65% by 2030, 70% by 2040, and 75% by 2050).
Decomposing the Kaya-identity for Wuxi, it becomes obvious that the increase of per capita income has the largest impact on the growth of CO2-emissions and the decrease of energy intensity of Gross Value Added the

Table 36. Energy and CO2-intensities of Gross Value Added in the branches of the service sector in Wuxi under the Low Carbon Plan (2005-2050).

Table 37. Energy and CO2-intensities of gross value added in the residential sector in Wuxi under the Low Carbon Plan (2005-2050).

Table 38. Mix of energy and CO2 in the residential sector in Wuxi under the Low Carbon Plan (2005-2050).
largest impact on the reduction of CO2-emissions in Wuxi. A decrease of population and CO2-intensity of Primary energy supply only have average contributions. The decrease of energy intensity of Gross Value Added is due to energy efficiency gains in the single economic sectors, but to a large extent due to structural changes of the economy away from energy intensive sectors such as iron and steel, chemical industry or cement industry towards the energy extensive service sectors. A growing residential sector also reduces the industrial share of energy demand.
In the model, the specific sectoral CO2-intensity goals are captured by an exogenous variable (CO2INTj,t) which is kept constant in the Business as Usual scenario after 2010 and reduces in the Low Carbon scenario according to the Low Carbon City Plan and the assumptions after 2020. In both scenarios, energy consumption and CO2- emission in Wuxi will grow in absolute terms. But the specific Low Carbon City measures in Wuxi contribute additionally to the given sectoral structure effect and lead to a total reduction of CO2-intensity of Gross Value Added of 53.7% in 2020 and by 80.1% in 2050 compared to 2005. The specific Low Carbon City measures increase the speed of macro-economic energy intensity reduction and leads to an emission reduction of 14 Mt CO2 in 2020 and 20 Mt CO2 in 2050 compared to the Business as Usual scenario. Only following the national trend (48.5%), the 50% CO2-emission intensity goal could not be fully reached in Wuxi City. Additional specific Low Carbon City measures, especially the above average reduction of energy intensity of industrial production and the promotion of co-generation of heat and power in Wuxi have to be taken. The promotion of renewable energies only to a minor part contribute to the achievement of the macro-economic CO2-intensity goal in Wuxi by 2020 and beyond. However, they are absolute essential, if a reduction of absolute CO2-emissions should be envisaged in Wuxi and beyond.
6. Acknowledgements
The article partly is result of the project “Low Carbon Future Cities—A Sino-German Cooperation on an Integrated Climate and Resource Proof Urban Development” funded by the Mercator Foundation in Germany.
REFERENCES
- IPCC, “Climate Change 2007. Synthesis Report. Contribution of Working Groups I, II and III to the Fourth Assessment Report of the Intergovernmental Panel on Climate Change,” IPCC, Geneva, 2007.
- E. Blanc, “The Impact of Climate Change on Crop Yields in Sub-Saharan Africa,” American Journal of Climate Change, Vol. 1, No. 1, 2012, pp. 1-13.
- M. Crabbe, “The Influence of Extreme Climate Events on Models of Coral Colony Recruitment and Survival in the Caribbean,” American Journal of Climate Change, Vol. 1, No. 1, 2012, pp. 33-40.
- Y. Latypov and N. Selin, “Changes of Reef Community near Ku Lao Cham Islands (South China Sea) after Sangshen Typhoon,” American Journal of Climate Change, Vol. 1, No. 1, 2012, pp. 41-47.
- Q. Zhang, M. Xiao X. and Chen, “Regional Evaluations of the Meteorological Drought Characteristics across the Pearl River Basin, China,” American Journal of Climate Change, Vol. 1, No. 1, 2012, pp. 48-55.
- Wuppertal Institute for Climate, “Environment and Energy Sustainable Urban Infrastructure Munich Edition— Paths toward a Carbon-Free Future,” 2009. http://www.mobility.siemens.com/shared/data/pdf/www/corporate/sustainable_munich_2009_e.pdf
- S. Nader, “Paths to a Low-Carbon Economy—The Masdar Example,” Energy Procedia, Vol. 1, No. 1, 2009, pp. 3951-3958. doi:10.1016/j.egypro.2009.02.199
- K. Shimada, Y. Tanaka, K. Gomi and Y. Matsuoka, “Developing a Long-Term Local Society Design Methodology towards a Low-Carbon Economy: An application to Shiga Prefecture in Japan,” Energy Policy, Vol. 35, No. 9, 2007, pp. 4688-4703. doi:10.1016/j.enpol.2007.03.025
- C. J. Liu and B. M. Feng, “The Revelation of Low-Carbon Economy on the Construction of Wuhan City Circle ‘Two Type Society’ in China,” Chinese Population Resources and Environment, No. 5, 2009, pp. 16-21.
- Q. Bao, Y. Miao and F. Chen, “Low-Carbon Economy: A New Mode of Economic Development of Human Transformation,” China Industrial Economy, No. 4, 2008, pp. 153-160.
- LCFC, “Low Carbon Future Cities—A Sino-German Cooperation on an Integrated Climate and Resource Proof Urban Development. WP 1 Report: Technical Definitions and Methodological Framework,” LCFC, Wuppertal, 2011.
- WLCDRC, “Wuxi Urban Low Carbon Development Strategy Plan,” Jiangnan University, Wuxi, 2010.
- Wuxi City Statistical Bureau, “Wuxi Statistical Yearbook,” China Statistical Press, Beijing, 2010.
- IEA, “World Energy Outlook 2011,” International Energy Agency, Paris, 2011.
- Z. D. Li, “An Econometric Study on China’s Economy, Energy and Environment to the Year 2030,” Energy Policy, Vol. 31, No. 11, 2003, pp. 1137-1150. doi:10.1016/S0301-4215(02)00219-7
- Q. Y. Zhang, K. Asano and H. X. Yang, “Forecasting of Chinese Population, GDP, Energy Consumption and CO2 Emission for the 21st Century,” World Resource Review, Vol. 12, No. 4, 2000, pp. 660-668.
- P. Söderholm, “Modeling the Economic Costs of Climate Policy: An Overview,” American Journal of Climate Change, Vol. 1, No. 1, 2012, pp. 14-32.
- R. S. Pindyck and D. L. Rubinfeld, “Econometric Models and Economic Forecasts,” Irwin/McGraw-Hill, Boston, 1998.
- D.A. Dickey and W.A Fuller, “Distribution of the Estimators for Autoregressive Time Series with a Unit Root,” Journal of the American Statistical Association, Vol. 74, 1979, pp. 427-431.
- “China Energy Statistical Yearbook,” China Statistical Press, Beijing, 2010.
- A. Oberheitmann and M. Frondel, “The Dark Side of China’s Increasing Economic Prosperity: Will Energy Consumption and Global Emissions Rise Dramatically?” In: R. Bleischwitz and O. Budzinski, Eds., INFER Annual Conference on Environmental Economics—Institutions, Competition, Rationality, Wuppertal, 22-23 October 2004, pp. 207-224.
- K. C. Wu, “The Characteristics of an Aging Population, Trends and Countermeasures,” New Academic Forum, Vol. 3, 2008. http://web.cenet.org.cn/web/wdr1960/index.php3?file=detail.php3&nowdir=&id=105504
- K. J. Jiang, X. L. Hu, X. Zhuang, et al., “China’s Energy Demand and Greenhouse Gas Emission Scenarios in 2050,” Advances in Climate Change Research, Vol. 4, No. 5, 2008, pp. 296-302.
- BP, “BP Statistical Review of World Energy,” 2011. http://www.bp.com/sectionbodycopy.do?categoryId=7500&contentId=7068481
- A. Oberheitmann, “A New Post-Kyoto Climate Regime Based on Per-Capita Cumulative Emissions Rights—Rationale, Architecture and Quantitative Assessment of the Implication for the CO2-Emissions from China, India and the Annex-I Countries by 2050,” Mitigation and Adaptation Strategies for Global Change, Vol. 15, No. 2, 2010, pp. 137-168. doi:10.1007/s11027-009-9207-4
- Y. Kaya, “Impact of Carbon Dioxide Emission Control on GNP Growth: Interpretation of Proposed Scenarios,” The IPCC Energy and Industry Subgroup, Response Strategies Working Group, Paris, 1990.