Geomaterials
Vol.3 No.1(2013), Article ID:27032,9 pages DOI:10.4236/gm.2013.31002
Assessment of Rockfall Hazard along the Road Cut Slopes of State Highway-72, Maharashtra, India
Department of Earth Sciences, Indian Institute of Technology Bombay Powai, Mumbai, India
Email: *raviumrao@gmail.com
Received September 9, 2012; revised October 9, 2012; accepted November 21, 2012
Keywords: Rockfall; Bounce Height; Kinetic Energy; Transverse Velocity; Mahabaleshwar; SH-72
ABSTRACT
Rockfall is a major problem in high hill slopes and rocky mountainous regions and construction of highways at these rockfall prone areas often require stable slopes. The causes of rockfall are presence of discontinuities, high angle cut slopes, heavy rainfall, and unplanned slope geometry etc. Slope geometry is one of the most triggering parameters for rockfall, when there are variations in slope angle along the profile of slope. The Present study involves rockfall hazard assessment of road cut slopes for 15 km distance starting from Mahabaleshwar town along State Highway-72 (SH-72). The vertical to sub-vertical cut slopes are prone to instability due to unfavorable orientation of discontinuities in slope face of weathered and altered basaltic rockmass. The predominant type of instability has been found as wedge type failure involving medium to large size blocks. In order to investigate the existing stability conditions, analyses were carried out at two locations under different slope conditions. The kinematic analysis was performed using stereographic projec-tion method. RockFall 4.0 numerical simulator software was used to calculate the maximum bounce heights, total kinetic energies and translational velocities of the falling rockmass blocks, and a comparative analysis is presented with increasing the mass of blocks and height of the slope. The result of numerical analysis shows that varying slope angle geometry creates more problems as compared to the mass of blocks in the scenario of rockfall.
1. Introduction
The term “Rockfall” explains usual meaning of rockfall as defined by Cruden et al. [1]. A rockfall is a fragment of rockmass which is detached from the slope by sliding, toppling or direct falling or combination of all along the vertical to sub-vertical cliff or slopes [2]. Many researchers have defined the term rock fall in different ways. According to Chen and Huang, a rockfall is an abrupt movement of independent blocks or complexes of uninterrupted rocks detached from steep slopes [3]. Lee and Elliot defined that a rockfall is the down slope movement of boulders (in case of natural slopes) or rock blocks (in cut slopes) which has the potential to destroy or damage the structures along its path or create an obstacle to public transportation networks, if not properly strained [4]. The size of rockfall is varying from the small coble to large boulders and they can travel at speeds ranging from few to tens of meters per second [5]. Rockfall occurs due to rock mass discontinuities present within rock slopes in the form of toppling, buckling (planar failure) and wedge failures. Rockfall generally initiated by climatic and biological conditions (trees and animals), vibrations (earthquake or blasting), or it may be initiated by external forces like construction activities. Major causes of rockfall are rainfall, frost, discontinuities, differential erosion, animal dens etc. whereas minor causes are tree roots, springs, vehicle vibrations and rock weathering etc.
The present study has been performed to investigate the rockfall hazard along the road cut slopes along SH-72, near Mahabaleshwar town, Maharashtra, India. Field investigation has been carried out to study lithological units, structural features and geomechanical properties of rock mass from Poladpur to Mahabaleshwar, for a distance of about 40 Km along SH-72. The slopes upto about 15 kms from Mahabaleshwar is more prone to failure due to high angle rock cut slopes. During the field study, locations and dimensions of hanging detached blocks were indentified and analyzed to mark vulnerable zones. Discontinuity survey was performed to study the different parameters of joints. The kinematic analysis has been performed to evaluate the role of discontinuities and the wedge type of failure is indentified as major failure in the study area. To know the initial velocity of detached block, UDEC V5.0 [6] software has been used and for the simulation of rockfall, two dimensional rockfall analyses have been done with the help of Rockfall 4.0 software [7].
2. Site Description
The study area is a state highway (SH-72) of Maharashtra, which exists between Poladpur and Mahabaleshwar and located between latitude 17˚52'30" - 18˚00'00" and longitude 73˚26'15" - 73˚41'15". It is covered in toposheet no. 47G/9 NE, allocated by the Survey of India (SOI). Mahabaleshwar is a famous hill station located in Satara district of Maharashtra. Mahabaleshwar is a perfect place for vacations and it offers numerous opportunities for leisure activities like fishing, boating and trekking. The hill station is famous due to its beautiful lakes, hills and waterfalls. In addition to its scenic beauty, the hill station is also popular for its temples, amazing viewpoints and places of historical significance. The study area is located between NH-17 provides an arterial link to Mahabaleshwar connecting it to the state highway after it stretch from Mumbai to Poladpur. From Poladpur a state highway (SH-72) connects Mahabaleshwar (Figure 1). Also NH-4 is connecting Mahabaleshwar to Pune through Wai. Two rockfall prone locations (Location-1 and Location-2) have been chosen after an extensive fieldwork along the slopes of SH-72. The brief description of each location is given the following sections.
2.1. Description of Location-1
Location-1 is about 12 km away from Mahabaleshwar. The height of the slope is about 28 - 30 m above the road with slope angle is about 65˚ facing towards east. During field survey, weathering conditions were observed and rocks were found to be moderately weathered and altered. Three prominent set of joints J1, J2 and J3 were observed during field survey (Figure 5). A wedge failure phenomenon was exhibited at the location due to interaction of joints planes. Figure 2 shows the slope profile, joint patterns, and hanging and/or falling blocks at location-1.
2.2. Description of Location-2
The Location-2 is comparatively nearer to Mahabaleshwar town (about 6.5 km). The height of immediate road cut-slope is approximately 12m with much steeper slope angle of 88˚ facing towards west. Presence of weathering is prevalent and rockmass shows three sets of joints with random orientation. Also slope section represents a thin red bole layer of about 1m above the toe. In the scenario of vulnerability, the slope experiences from wedge failure as well as rockfall hazard. Wedging due to discontinuity and hanging and falling blocks are shown in Figure 3.
3. Geological Setting
The study area comes under Deccan Plateau of Western and Central India, is one of the most extensive continen

Figure 1. Location map of the study area.
tal flood basalt provinces of the world, comprising more than 500,000 km2 of predominantly theolitic basalt [8]. The basaltic flows thickness in region of Mahabaleshwar has been reported as 1150 m to 1200 m [9,10]. Varying numbers of basaltic flows have been reported by different researchers. Konda [11] reported 41 flows, Kaneoka and Haramura [9] identified 42 flows whereas Mahoney et al. [8] reported highest number of flows i.e. 48 flows.
Deccan Trap has been divided into three subgroups namely the Kalsubai, the Lonawala and the Wai, based on isotopic and geochemical characteristics [9,10]. The Wai subgroup encompasses upper five formations of the Deccan Basalt of which Poladpur, Ambenali and Mahabaleshwar are well exposed in the study area. Simplified

Figure 2. Location 1: (a) Slope profile; (b) Hanging and/or failed blocks at location-1; (c) Joint patterns with different orientations; and (d) Falling blocks of wedge shaped.

Figure 3. Location 2: (a) Slope profile; (b) Hanging and/or failed blocks at location-2; (c) Red bole layer exposed near the toe; and (d) Cut slope geometry at road section.
stratigraphy and geological map of the study area is shown in Table 1 and Figure 4 respectively. The formation unit of each subgroup has been classified based on the geochemical and REE i.e. ratio of 87Sr/ 86Sr, Ba/Y, and Zr/Nb [8,10,12]. The lower formation (Poladpur) of the Wai Group is distinguished from upper formation (Bushe) of the Lonavala on basis of the low strontium isotope ratio but Poladpur is demarcated from the Ambenali formation on the basis of the high contents 87Sr/ 86Sr, Ba/Y and Ba. The boundary of Ambenali and Mahabaleshwar has sharp break in element and isotopic trend [13]. Usually presence of the red bole is considered

Figure 4. Geological map of study area (after widdowson and cox [15]).
Table 1. Simplified stratigraphy of deccan trap basalt with formation thickness, Sr isotope ratio and magnetic polarity (after peng et al. [12], radhakrishna et al. [14]).

as contact boundary of the two distinct flows of basalt [14].
4. Rockfall Modeling Methodology
Information related to the detached rockmass/block was acquired by using Barton-Bandis model in Universal Distinct Element Code (UDEC). Parameters for rockfall simulation were determined by rigorous field study and laboratory experiments and the parameters were calibrated by back analysis. Rock fall modeling was carried out using Rockfall program [7]. It is a lumped mass-modeling program in which rock block is considered to be a simple point with rockmass concentrated at the centre of gravity. The assumed point mass is then released down the observation slope. As soon as the rock block collides with the slope surfaces, normal and tangential velocities to the slope are reduced to normal coefficient of restitution (Rn) and tangential coefficient of restitution (Rt). These coefficients of restitution depend upon rock type and slope morphology. Along with the coefficient of restitution, Rockfall program also considers the angular velocity of the rock block and surface roughness.
5. Results and Discussion
A detailed field investigation was carried out along the cut slopes of SH-72. It was observed investigated that the major rockfall problems occurred near the Mahabaleshwar town. Based on the case history of rockfalls, two most vulnerable locations were identified. The conventional and numerical analyses were carried out to assess the rockfall simulation. Kinematic analysis reveals wedge type of failure on the basis of joint patterns (yellow circle indicates the angle of internal friction and red area is the critical zone in stereographic projection (Figure 5).
5.1. Rockfall Simulation of Location-1
The numerical simulation to identify the initial velocity (Figure 6(b)) of the potential rockfalls along the profile (Figure 6(a)) was done using UDEC software. The modeling was done in elasto-plastic constitutive model with assumption that rock mass follow Mohr-Coulomb failure criteria. Model was executed using constant parameters that were obtained from laboratory tests (Table 2). UDEC results indicate that the initial velocity of rockfall block to move in outward direction is 0.449 m/s. Rockfall simulations were carried out using Rockfall program [7]. Table 3 shows the values of the parameters used in rockfall simulations. Different rock masses ranging between 50 kg to 150 kg were considered in the analysis based on the rockfall historical records of the study area. The bounce heights, total kinetic energies and translational velocities were determined (Table 4).
The rockfall trajectory for the three weights of block (50, 100 and 150 kg) are shown in Figure 7. The plots for three parameters viz, bounce height, kinetic energy and transverse velocity versus travelling distance for varying


Figure 5. Kinematic analysis of study area.

Figure 6. (a) Slope profile of Location-1; (b) Numerical simulation for determination of initial velocity using UDEC software.
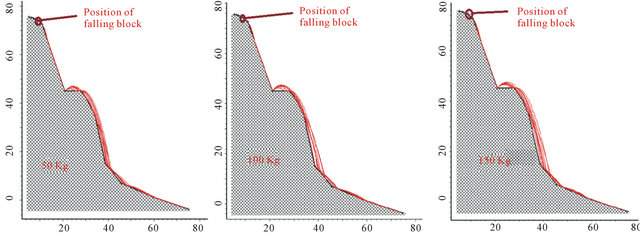
Figure 7. Rockfall trajectory of three different sizes of falling blocks at Location-1.
Table 2. Properties of rock and discontinuity used for numerical simulation in UDEC.

masses of the blocks are shown (Figures 8(a)-(c)). Obtained results clearly indicate that the value of all three parameters increases with increasing mass of falling blocks. In other words, if mass of the block increases, the bounce heights, kinetic velocities and transverse veloci-
Table 3. Parameters used in rockfall analysis.
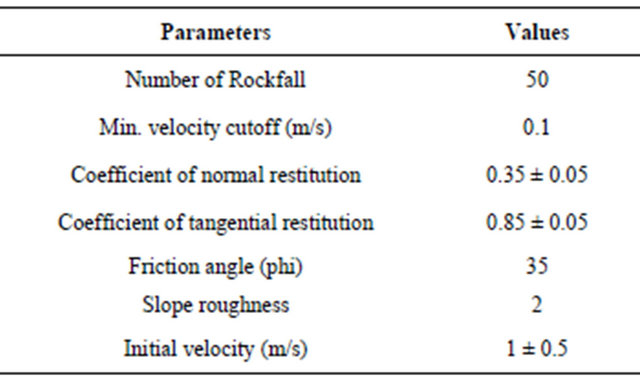
Table 4. Variation of bounce height, total KE, and trans. velocity with increasing mass of blocks for Location-1.
 (a)
(a)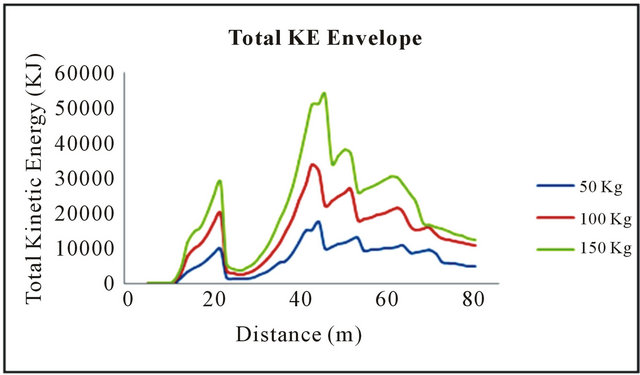 (b)
(b) (c)
(c)
Figure 8. Plots of three parameters versus trevelling distances with varying masses of falling blocks; (a) Bounce height; (b) Kinetic energy; and (c) Transverse velocity.
ties also increase. This relationship is nicely valid for the first impact of rockfall block on the surface of the slope. After first impact result may be changed due to many probable reasons, such as slope geometry, changing lithology, and surfacial characteristics etc. These points should be kept in mind while observing the sites, taking the data from the field and also during simulation.
5.2. Rockfall Simulation (Location-2)
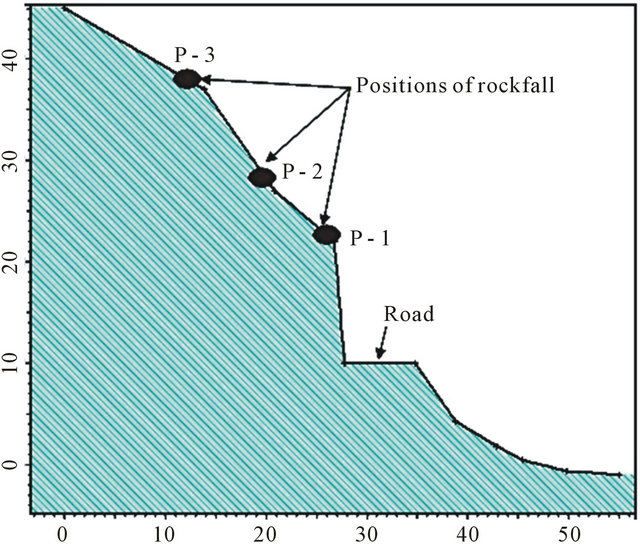
At Location-2, it was observed during field investigation that average size of rockfall blocks were about 100 kg. So, 100 kg of rock block was considered for the simulation of rockfall. Three critical positions were identified at which rock blocks can fall on a single slope due to its geometry and these positions are at 12m, 18m and 26m heights (Figure 9(a)). From the numerical simulation of cut slope profile using UDEC software (Figure 9(b)) initial velocities of three positions (P-1, P- 2 and P-3) were obtained as follows, for P-1 is 0.023 m/sec, for P-2 is 0.0183m/s and for P-3 is 0.054m/s. The rockfall simulation results using Rockfall simulator software is given for the maximum bounce height, maximum kinetic energy and maximum transverse velocity (Table 5). The rockfall trajectories of three positions (Figures 10(a)-(c)) and plots for bounce heights, kinetic energies and transverse velocities versus location (trajectory path) for three positions (Figures 11(a)-(c)) clearly shows the behavior of falling blocks due to variation in slope angle.
 (a)
(a) (b)
(b)
Figure 9. (a) Slope profile of Location-2; (b) Numerical simulation for initial velocity determination using UDEC software.
Table 5. Variation of bounce height, total KE, trans. velocity at end points with increasing height of slope at Location-2.


Figure 10. Rockfall trajectory of three positions of falling blocks of Location-2.
 (a)
(a) (b)
(b) (c)
(c)
Figure 11. Plots of three parameters vurses trevelling distances with varying masses of falling blocks; (a) Bounce height; (b) Kinetic energy; and (c) Transverse velocity.
The slope profile comprised of varying slope angle geometry with height. From bottom to 12m height, the slope shows almost vertical slope. At 12 to 18 m height, profile shows a slope angle of 35˚. Above the 18m to 26m height, profile changes the slope angle from 35˚ to 52˚. The slope profile above 26m is low angle and decreases with increasing height. The rockfall simulation shows different trajectory path due to variation in slope geometry (Figures 10(a)-(c)). Figure 10(a) demonstrates the direct fall from the slope due to almost vertical cut slope, whereas, Figures 10(b) and (c) show the rolling and bounce of rock blocks due to slope geometry.
From the rockfall simulation results it is clear that all three parameters (bounce height, kinetic energy and transverse velocity) will increase with increasing the height of slope. The maximum bounce height in case of position P-1 showed very low value (Figure 12(b)) due to
 (a)
(a) (b)
(b)
Figure 12. Comparative plots for the three parameters bounce height, transverse velocity and KE with (a) Increasing mass of the falling block; (b) Increasing height of the falling blocks.
vertical slope, whereas maximum bounce height abruptly changed in case of positions P-2 and P-3 (Figure 12(b)) because of varying slope angle. Total kinetic energy and transverse velocity also increases with increasing slope height.
6. Conclusion
A comparison of rockfall trajectory with increasing mass of the rockfall block and increasing slope height for the fall position of the rock block and to evaluate the three parameters namely bounce height, kinetic energy and transverse velocity in both is the essential contribution of this study. From the simulation results, it is concluded that the geometry of slope (height and angle) has a more effective role in rockfall as compared to the mass of the block. This study also reveals that most of the rockfall occurred due to nature and orientation of discontinuities in the rocks. Bounce height is more variable in case of variable geometry of slopes, whereas, in case of increasing mass of the blocks, bounce heights also increases with same paths. No similar path in case of varying geometry, bounce heights show complex behavior with increasing height. Thus, slope geometry is more critical parameters for the rockfall in comparison to the mass of the rockfall blocks.
7. Acknowledgements
Author expresses sincere thanks to Shri Vikram Vishal, Indian Institute of Technology, Bombay for valuable suggestions that helped a lot to improve the manuscript.
REFERENCES
- D. M. Cruden and D. J. Varnes, “Landslide Type and Processes,” In: A. K. Turner and R. L. Schuster, Eds., Landslides: Investigation and Mitigation, National Academy Press, Washington DC, 1996, pp. 36-75.
- D. J. Varnes, “Slope Movement Types and Processes,” In: R. L. Schuster and R. J. Krizek, Eds., Landslides, Analysis and Control, National Academy of Sciences, 1978, pp. 11-33.
- H. Chen, R. Chen and T. Huang, “An Application of an Analytical Model to a Slope Subject to Rockfalls,” Bulletin of the Association of Engineering Geologists, Vol. 32, No. 4, 1994, pp. 447-458.
- K. Lee and G. Elliott, “Rockfall: Application of Computer Simulation to Design of Preventive Measures,” Planning, Design and Implementation of Debris Flow and Rockfall Hazards Mitigation Measures, Association of Geo-Technical Specialists & Hong Kong Institution of Engineers, Hong Kong, 1998.
- F. Guzzetti, G. Crosta, R. Detti and F. Agliardi, “STONE: A Computer Program for the Three Dimensional Simulation of Rock-Falls,” Computers and Geosciences, Vol. 28, No. 9, 2002, pp. 1079-1093. doi:10.1016/S0098-3004(02)00025-0
- Itasca, “Itasca Software Products—FLAC, FLAC3D, UDEC, 3DEC, PFC2D/3D,” Itasca Consulting Group, Inc., Minneapolis, 2010.
- RocScience, “RockFall Software for Risk Analysis of Falling Rock on Steep Slope,” RocScience Inc., Toronto, 2000.
- J. Mahoney, J. D. Macdougall, G. W. Lugmair, A. V. Murali, M. S. Das and K. Gopalan, “Origin of the Deccan Trap Flows at Mahabaleshwar Inferred from Nd and Sr Isotopic and Chemical Evidence,” Earth and Planetary Science Letters, Vol. 60, No. 1, 1982, pp. 47-60. doi:10.1016/0012-821X(82)90019-X
- I. Kaneoka and H. Haramura, “K/Ar Ages of Successive Lava Flows from the Deccan Traps, India,” Earth and Planetary Science Letters, Vol. 18, No. 2, 1973, pp. 229- 236. doi:10.1016/0012-821X(73)90061-7
- J. E. Beane, C. A. Turner, P. R. Hooper, K. V. Subbarao, and J. N. Walsh, “Stratigraphy, Composition and Form of the Deccan Basalts, Western Ghats, India,” Bulletin of Volcanology, Vol. 48, No. 1, 1986, pp. 61-83. doi:10.1007/BF01073513
- T. Konda, “Deccan Basalts at Mahabaleshwar, India,” Contributions to Mineralogy and Petrology, Vol. 32, No. 1, 1971, pp. 69-73. doi:10.1007/BF00372234
- Z. X. Peng, J. J. Mahoney, P. R. Hooper, C. Harris and J. E. Beane, “A Role for Lower Continental Crust in Flood Basalt Genesis? Isotopic and Incompatible Element Study of the Lower Six Formations of the Western Deccan Traps,” Geochimica et Cosmochimica Acta, Vol. 58, No. 1, 1994, pp. 267-288. doi:10.1016/0016-7037(94)90464-2
- C. W. Devey and P. C. Lightfoot, “Volcanological and Tectonic Control of Stratigraphy and Structure in the Western Deccan Traps,” Bulletin of Volcanology, Vol. 48, No. 4, 1986, pp. 95-207. doi:10.1007/BF01087674
- B. P. Radhakrishna and R. Vaidyanadhan, “Geology of Karnataka,” Geological Society of India, Bangalore, 1994.
- M. Widdowson and K. G. Cox, “Uplift and Erosional History of the Deccan Traps, India: Evidence from Laterites and Drainage Patterns of the Western Ghats and Konkan Coast,” Earth and Planetary Science Letters, Vol. 137, No. 1-4, 1996, pp. 57-69. doi:10.1016/0012-821X(95)00211-T
NOTES
*Corresponding author.