Journal of Encapsulation and Adsorption Sciences
Vol.1 No.4(2011), Article ID:9148,8 pages DOI:10.4236/jeas.2011.14008
Pseudo Constants for Methyl Red Sorption: A Rate Study of Received and Derived Activated Carbon
1Department of Applied Chemistry, Kebbi State University of Science and Technology, Aliero, Nigeria
2Basic Science Unit, Nasarawa State University Keffi, Shabu-Lafia Campus, Keffi, Nigeria
3Department of Chemistry, Ahmadu Bello University, Zaria, Nigeria
E-mail: *itodoson2002@gmail.com
Keywords: Activated Carbon, Pseudo Constants, Methyl Red, Sorption, Derived, Received
Abstract
This effluent remediation research on discoloration tends to disagree with the use of commercial activated carbon as received from manufacturers. Product specification and authentication is a key task to chemists and scientist. Here, Batch kinetic studies via pseudo approximations treatments was adopted to to investigate the rate of Methyl Red (MR) dye solution uptake onto carbon animalis earlier received as Granulated Activated Carbon (GAC) and later formulated as Powdered Activated Carbon (PAC). The rate of dye uptake was studied with data fitted in to the Lagergren’s pseudo first and second order kinetic models. Justification by the R2 values (0.984) for GACgreater than 0.865 for PAC, low statistical error (SSE%) range of 1.065 - 2.310 and closeness between the experimented and calculated qe values all favored the second order kinetic model. The deviation of the line from the origin further showed that intra-particle transport is not the only rate limiting step. Generally the research supported the manufacturer’s choice of particle size (as GAC and not PAC) for the chosen adsorbate.
1. Introduction
Dye was described as a large group of industrial chemical with over 700,000 tons of waste producedannually [1]. They generally contain chromogens in their structure, which is the aromatic structure normally containing benzene, naphthalene or anthhracene rings and therefore makes them carcinogenic, inert and non biodegradable [2]. These dyestuffs when discharged into environmental water bodies deteriorates the water quality [3].
One of the most effective methods for removing different types of colors from waste water is adsorption method using activated carbon and it gives best result, since commercially available activated carbon is very expensive [4].
In an earlier research by this same team, homemade carbon animalis generated from poultry droppings was used to remove aqueous phase organochlorine herbicide (atrazine). A time dependent physisorption phenomena was reported with attainment of equilibration at 300 minutes and showing over 77% herbicide uptake [5]. Another research pointed out that large surface area or a large pore volume may be achieved by choice of activating agents [6]. Granular activated carbon has a relatively larger particle size compared to powdered activated carbon and consequently, presents a smaller external surface [7].
Several types of dyestuff and non dyeingadsorbates of environmental threat were studied. It was reported that Methylene blue uptake was endothermic and followed a pseudo second order kinetic process [8]. Decolorization in anaerobic/aerobic biological activated carbon was investigated using a batch equilibrium test. In the research, adsorption onto mixed culture agent (MC), biological activated carbon (BAC) and granular activated carbon (GAC) were investigated [9].
Methyl red (see Figure 1), also called acid red is an indicator dye that turns red in acidic solutions. The group includes the greatest number of colored on certified list, they are all characterized by the presence of -N=Nbond and they are synthesized by primary amine to a component capable of a couple [10].
Adsorption is a phenomenon where the rate of adsorption and the rate of desorption are equal. The relationship between the amount of adsorbate adsorbed onto the adsorbent

Figure 1. Preparation of methyl red.
surface and the equilibrium concentration of the adsorbate in solvent at equilibrium at a constant temperature may be estimated by various adsorption isotherm models. The amount of Dye at equilibrium, qe is calculated from the mass balance equation given in Equation (1) [11].
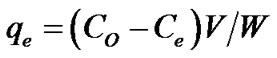 (1)
(1)
The success of adsorption process depends on the performance of adsorbent in both equilibria and kinetics [12]. Kinetics of adsorption is one of the important characteristics, defined the efficiency of an adsorbent. According to a research, kinetics is an adsorption dynamics which describes the solute uptake rate and evidently control the resident time of adsorbate and possibilities of desorption [13].
A good understanding of the pseudo constant is considering“order of reaction”, in chemical kinetics, with respect to a certain reactantas the power to which its concentration term in the rate equation is raised. For example, given a chemical reaction 2A + B → C with a rate equationr = k[A]2[B]1. The reaction order with respect to A would be 2 and with respect to B would be 1, the total reaction order would be 2 + 1 = 3. The reaction order is not necessarily related to the stoichiometry of the reaction, unless the reaction is elementary first order. Reactions can also have an undefined reaction order with respect to a reactant, for example one cannot talk about reaction order in the rate equation found when dealing with a bimolecular reaction between adsorbed molecules. If the concentration of one of the reactants remains constant (because it is a catalyst or it is in great excess with respect to the other reactants) its concentration can be included in the rate constant, obtaining a pseudo constant: if B is the reactant whose concentration is constant then r = k[A][B] = k’[A]. The second order rate equation has been reduced to a pseudo first order rate equation. Whenever the concentration of the reactant is doubledif it leads rate to also doubles, then the reaction is first order [14]. A first order reaction depends on the concentration of one reactant (unimolecular) only. In order to distinguish kinetics equation based on adsorption capacity of solid from concentration of solution, Lagergren’s first order rate equation has been called pseudo-first order model. Generally,
 (2)
(2)
where kn is the rate constant for the nth order Adsorption. Kn unit are min–1 and gmg min–1 first order n = 1 and second order, n = 2 kinetics, respectively [11,15]. This generalization is simplified by the Lagergren model proposed in 1989 to assume first order kinetics which is linearly represented as Equation (3) below [13].
 (3)
(3)
The value of Log (qe – qt) were linearly correlated with time, t from which the first order rate constant kt and experimental qe are determined [16].
Ho and McKaypresented the second-order model, integrated and linearized as Equation (4) [17].
 (4)
(4)
where k1 and k2 stands for the pseudo first and second order rate constants respectively and were determined by regression analysis by fitting on a number of experimenttal data point, plotting log (qe qt) versus t and t/q against t. qe was calculated for each model and compared with its experimental value for precision validity test [11]. Equation (4) can be rearranged as Equation (5).
 (5)
(5)
h is the initial adsorption rate (mmg–1) and it is a given as (6)
 (6)
(6)
One of the challenges of a chemist is product specification due to unwholesome product in the market. In other sense, quality verification by authentication prior to purchase is a possible outlet. In this research, commercial activated carbon was verified for its adsorption phenomenon (performance assessment) and possibility of improved output. The aim of this study is to investigate the rate or speed of dye uptake (kinetics) for adsorption of methyl red onto commercially received GAC and subsequently, onto the same product formulated into PAC. The objectives include:
1) To study adsorption phenomenon (performance assessment).
2) To investigate the effect of contact time on dye removal.
3) To investigate the rate of dye uptake using existing kinetic models via pseudo approximations.
4) To study the effect of particle size on adsorption rate.
2. Materials and Methods
2.1. Materials
The materials used in carrying out this research work include Methyl red(C15H15N3O3), Received bone charcoal (Carbon Animalis) as GAC and derived bone charcoal formulated as PAC from the received GAC. All reagents were of analytical grade and in addition to routine laboratory apparatus the Furnace stands as the major equipment.
Commercially available activated carbon of animal origin (bone charcoal) was procured from pharmacos LTD, southern on—Se, Essex, England. This sample was labeled as Granular Activated Carbon (GAC of >0.2 mm aperture) and further formulated as Powder Activated carbon (PAC) by grinding. The received carbon (GAC) was grounded with mortar and pestle, then sieved with <0.05 mm aperture sieve size and the Powdered form was collected and tagged as formulated (PAC).
2.2. pH and Conductivity Measurement
1 g/100 cm3 or 0.1 g/10 cm3, of the samples were made using Distilled water. Mixture was boiled, allowed to cool at room temperature then PH of the supernatant was obtained after 1 hour. A pH electrode was dipped into the solution and the value was read from the meter. Samples with undesirable pH were washed continuously until a pH between 6 - 8 was reached [14].
2.3. Bulk Density Determination
Density was measured on activated sample of <2 mm and <0.5 mm. It was estimated by placing the products into a graduated cylinder and compacted by tapping on the bench top until an expected volume, v (cm3) was occupied by mass, m(g)). The cylinder was tapped on the bench top until the volume of the sample stop decreasing. The mass and volume were recorded and density calculated as the equation [14].
 (7)
(7)
2.4. Batch Kinetic Studies
For this study, methyl red was used as received from the local supplier at Kaduna state, Nigeria. A stock solution of 1000 ppm was prepared by dissolving an accurate weighed quantity of 1.0 g of the dye (methyl red) using electronic balance JT201N model in a 1000 ml volumetric flask and made up to the mark with distilled water. A working solution of 100 ppm was prepared by dilution. Preparation of blank entails adding 0.1 g of both PAC and GAC to different conical flask to interact with 10 cm3 of distilled water for the same timing as applicable to the test under investigation and carefully filtered using Wattman filter paper No. 42. Batch experiment of adsorption was carried out in 250 cm3 Erlemmeyer flasks. 0.1 g of adsorbent for both powder and Granular activated carbon was placed into 6 different conical flask with 10 cm3 each of the 100 ppm concentration dyestuff (methyl red) solution prepared. These fixed initial MR concentration were in separate conical flask, stirred using a mechanical shaker for 30, 60, 90, 120, 150, and 180 minutes contact time. Mixtures were filtered using wattman filter paper [11]. Absorbance of filtrate was taken using Surgispec 5M7F25 model spectrophotometer at an already predetermined wavelength of 617 nm.
3. Results and Discussion
From Table 1 below, PAC is denser (0.75 g/cm3) as a result of more mass occupancy for a stipulated volume than GAC (0.70 g/cm3). This could result to higher pH (7.88) and conductivity (72.9 µS/cm) reported for PAC as against their correspondingly low values for GAC (7.82 and 60.90 µS/cm respectively).
3.1. Equilibrium Studies
Table 2 reports the adsorption data of methyl red uptake onto GAC. The parameter which is an indication of adsorption capacity was represented as qe. Equilibrium phase concentration was least (Ce = 27.35 mg/L) for the 60 minutes interaction with a correspondingly high qe (7.26 mg/g) value. It thus implied that the equilibration time for this analysis is 60 minutes for the chosen adsorbent mass / adsorbate volume ratio.
Table 3 represent MR uptake onto PAC. For the series of 30 - 180 minutes contact time, the equilibrium phase concentration (after adsorption), Ce = 51.18 mg/L was least for the 150 mins contact time. This gave a corresponding highest adsorption capacity indication; qe = 4.88 mg/g.
Hence, 150 minutes is the equilibration time for PAC. It could be deduced from Tables 2 and 3 that high pore size as applicable to GAC supports early equilibration (60 minutes) during which the rate of adsorption equals that of desorption. On the other hand, It may be agreed that larger surface area as applicable to PAC also gave high adsorption though at fairly higher contact time.
3.2. Effect of Contact Time
The effect of contact time on MR uptake was investigated Figure 2 revealed that the MR uptake was characterized by different equilibration time for GAC and PAC.

Table 1. Physicochemical parameters of adsorbent.
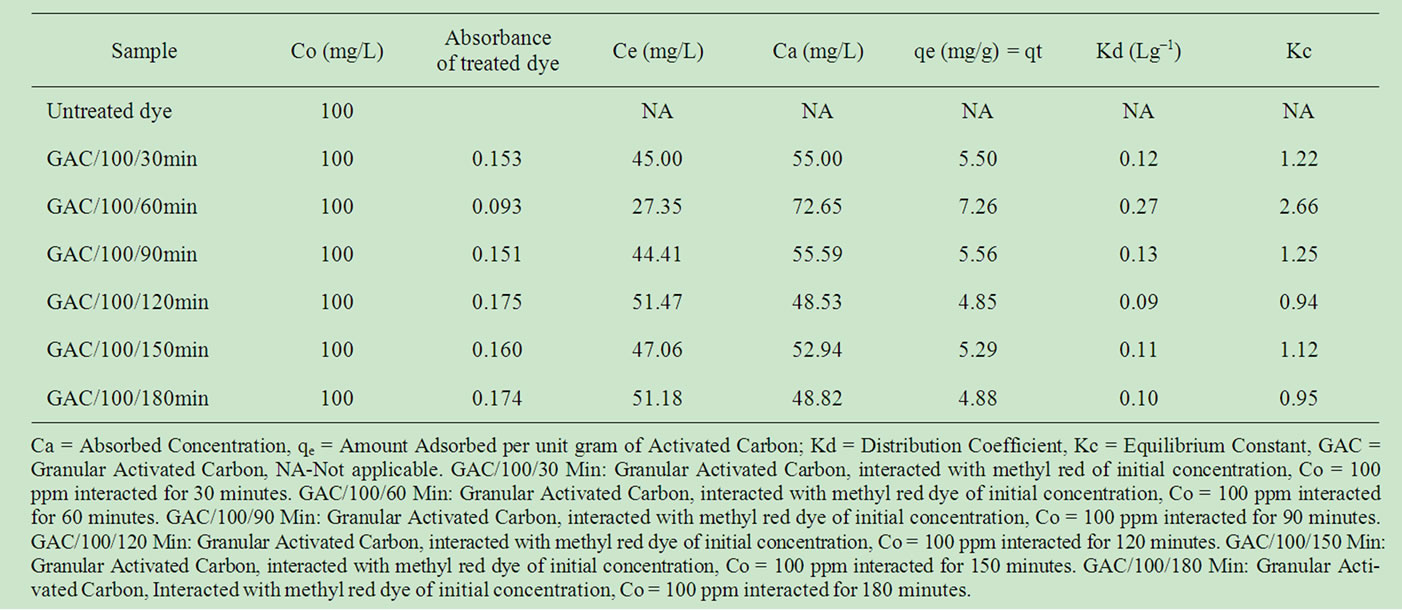
Table 2. Adsorption data of methyl red dye after adsorption onto Granular Activated Carbon (GAC) at time interval (t = 30 - 180 minutes).

Table 3. Adsorption data of methyl red dye after adsorption onto Powder Activated Carbon (PAC) at time interval (t = 30 - 180 minutes).

Figure 2. Effect of contact time on adsorbed methyl red concentration (Ca) onto GAC (series 1) and PAC (series 2) at time, t = 30 - 180 minutes.
Thus, an alternating adsorption and desorption occurs along the 30 - 180 minutes series. Increase in adsorption with contact time was evidence within the first 60 min for GAC and 150 min for PAC before desorption set in for most of the samples. This implied that the spent time of the absorbents for the sorbates differs.
3.3. Adsorption Kinetics
Data in this section is typical of those presented as Tables 4 and 5 and were deduced from treatment of Figures 3-6.

Table 4. First order, second order and intra-particle diffusion kinetics experimental constants of methyl red uptake onto GAC.

Table 5. First order, second order and intra-particle diffusion kinetics experimental constants of methyl red uptake onto PAC.

Figure 3. Pseudo second order kinetics for methyl red adsorption onto Granulated Activated Carbon (GAC).

Figure 4. Pseudo second order kinetics for methyl red adsorption onto Powdered Activated Carbon (PAC).

Figure 5. Pseudo first order kinetics for methyl red adsorption onto Granulated Activated Carbon (GAC).

Figure 6. Pseudo first order kinetics for methyl red adsorption onto Powdered Activated Carbon (PAC).
Table 4 is the kinetic experimental data for MR adsorption onto GAC. The table reportsed values of coefficient of determination which was designated as coefficient correlation R2. Others include the pseudo first order rate constant (k1), pseudo second order rate constant (k2), intraparticle diffusion rate constants (kid), the statistical sum of error square (%SSE) and the experimental/calculated qe used for precision tests.
For predicting the modes of adsorption as either pseudo first or second order model, the understated validity test was followed;
Validity Tests: Accepted kinetic model for a given adsorption is characterized by three common validity tests;
1) A good and high correlation coefficient, R2 indicating the applicability and reliability of a given model.
2) A close agreement between the calculated and experimental qe values (precision test).
The accepted model must have the least values for the sum of error squares (%SSE), which is determined as Equation (8).
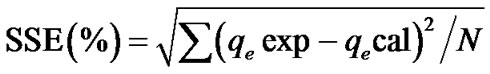 (8)
(8)
where N is the number of data points [11].
The coefficient of determination value for the pseudo second order (R2 = 0.984) is higher compared to that of the pseudo first order kinetic model (R2, 0.498). There exist a high precision (degree of agreement or nearness) between the experimental qe (2.609 mg/g) and calculated qe (4.651 mg/g) for the pseudo second order model as compared to that of the pseudo first order. Thirdly, the statistical sum of error square for the second order mode (%SSE = 1.065) is least compared to the high value (2.310%) presented for the first order model. It could therefore be predicted with high certainty that the adsorption proceed via the pseudo second order kinetics.
Table 5 showed the adsorption kinetic constant for MR uptake onto PAC. The pseudo second order kinetis also proved a better option to predicting the adsorption phenomenom. It indicated high R2 of 0.865, least %SSE (0.216) and close proximity between qe Cal. and qe Exp.
From Tables 4 and 5, the rate constants can only be explained with the most feasible kinetic model (pseudo second order kinetic model). Hence, rate constants are k2 = 0.018 mgg–1min and 0.012 mgg–1min for GAC and PAC respectively. This could be the first hand information why the manufacturers packaged the branded adsorbent as GAC. It should be note worthy that adsorbent may work best as GAC for a given adsorbate but could serve best as PAC for yet another or different pollutants.
Furthermore, the pseudo-second order is based on the assumption that sorption follows a second order mechanism, with chemisorption as the rate limiting step. So the rate of occupation of adsorption sites is proportional to the square of the number of unoccupied sites. In an earlier research, the kinetics and intraparticle diffusion (mode of transport) of azo dye on millet biomass was reported t [10]. In their research, the amount of dye adsorbed increased with time. 40 - 45 minutes was chosen as equilibration time while adsorption followed the pseudo second order kinetics. The rate constant was estimated as k2 = 2800 gmg–1 min and the intrap article rate constant Kid is 0.8298 min–1 [10].
3.4. Mode of Transport (Intraparticle Diffusion)
The structure of the solid and its interaction with the diffusion substance influences the rate of transport. Adsorbent may be in the form of porous barriers and solute movement by diffusion from one fluid body to the other by virtue of concentration gradient. Intra-particle diffusion is a transport process involving movement of species from the bulk of the solution to the solid phase. In a well stirred batch adsorption system, the intra-particle diffusion model has been used to describe the adsorption process occurring on a porous adsorbent .A plot of the amount of sorbate adsorbed, qt (mgg–1) and the square root of the timegives the rate constant (slope of the plot). It is calculated by using the intra-particle diffusion model earlier described [14].
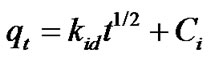 (9)
(9)
Disregarding the linearity (high R2 value) of the intra-particle diffusion plot, the sorption mechanism assumes this model if the following conditions are met:
1) High R2 values to ascertain applicability.
2) Straight line which passes through the origin for the plot area qt vs. t1/2.
3) Intercept Ci< 0. A validity test which deviates from 2) and 3) above shows that the mode of transport is affected by more than one process [14].
The deviation of the line from the origin further shows that intra-particle transport is not the only rate limiting step. Probably the transport of the sorbate through the particlesample interphase onto the pores of the particles, as well as adsorption on the available surface of the adsorbent, is responsible for the adsorption. The rate of attainment of equilibrium may be either film-diffusion controlled or particle-diffusion controlled, even though this two different mechanism cannot be sharply demarcated [2].
3.5. Distribution Coefficient (Kd)
The amount of dye adsorbed per unit mass of sorbent (qe) is related to the equilibrium phase concentration (Ce) by the distribution coefficient (KD). Distribution equilibrium constant is defined as a constant that implicitly indicate selectivity and affinity for the sorbate by the sorbent [14]. It is also a measure of sorbent adsorption capacity while Equilibrium Constant (Kc) is a measure of the ratio between the adsorbed sorbate concentration to that of the equilibrium phase [14].
Tables 2 and 3 presented Kd values (Figure 9) to range between 0.01 to 0.06. The most prefferred adsorption (high qe and low Ce) gave the highest Kd; 0.27 Lg–1. This is an indication that the adsorbent strongly adsorb the adsorbate at the 60 minutes interaction time. For PAC, 150 minutes contact time produces the highest distribution constant (Kd = 0.10), indicating the point of stronger uptake or adsorption. It should also be noted that the equilibrium constant,kc which is defined as a measure of the
Figure 7. Intraparticle diffusion plot for methyl red adsorption onto Granulated Activated Carbon (GAC).

Figure 8. Intraparticle diffusion plot for methyl red adsorption onto Powdered Activated Carbon (PAC).

Figure 9. Partition coefficient (Kd) for methyl red adsorption onto GAC (Series 1) and PAC (Series 2) at time t = 30 - 180 minutes.
ratio of the adsorbed sorbate concentration to the equilibrium phase concentration is of reverse implication to Kd. A high kd is supposedly designed to present to present a low Kc and vice versa.
4. Conclusions
It is evident form the finding of this work that both powder and granular activated carbon (of animal origin) effectively traps the adsorbate (methyl red dye). Results obtained with the frame work of this study clearly presented the pseudo second order kinetic model as most appropriate fit for the adsorption MR in aqueous solution. The effect of various parameters such as particle size and contact time played roles in adsorption and kinetic study. Finally, the adsorption phenomenom via rate law, applicability test using R2 and sorption validity tests are critical in estimating the extent of wholesomeness on our product labels.
5. References
[1] M. Jayarajan, R. Arunachalam and G. Annadurai, “Use of Low Cost Nano-Porous Materials of Pomelo Fruit Peel Wastes in Removal of Textile Dye,” Research Journal of Environmental Sciences, Vol. 5, No. 5, 2011, pp. 434-443. doi:10.3923/rjes.2011.434.443
[2] A. U. Itodo, F. W. Abdulrahman, L. G. Hassan and S. A. Maigandi, “Adsorption Capacities and Intensities of Chemically Modified Carbonanimalis and Activated Carbon: A Comparative Study,” International Journal of Chemical Science, Vol. 2, No. 2, 2008, pp. 214-221.
[3] R. Malarvizhi and N. Sulochana, “Sorption Isotherm and Kinetic Studies of Methylene Blue Uptake onto Activated Carbon Prepared from Wood Apple Shell,” Journal of Environmental Protections Science, Vol. 2, No. 2, 2008, pp. 40-46.
[4] S. B. Olugbenga, A. A. Mohd and T. S. Tan, “Utilization of Cocoa Pod Husk for the Removal of Remazol Black B Reactive Dye from Aqueous Solutions: Kinetic, Equilibrium and Thermodynamic Studies,” Trends in Applied Sciences Research, Vol. 6, No. 8, 2011, pp. 794-812. doi:10.3923/tasr.2011.794.812
[5] A. U. Itodo, F. W. Abdulrahman, L. G. Hassan, F. A. Atiku and H. U. Itodo, “GCMS Prediction of Organochlorine Herbicide Sorption Rate: A Batch Kinetic Studies,” Trends in Applied Sciences Research, Vol. 6, No. 8, 2011, pp. 451-462.
[6] J. A. Lori, A. O. Lawal and E. J. Ekanem, “Adsorption Characteristics of Active Carbons from Pyrolysis of Bagasse, Sorghum and Millet Straws in Ortho Phosphoric Acid,” Journal of Environmental Science and Technology, Vol. 1, No. 3, 2008, pp. 124-134. doi:10.3923/jest.2008.124.134
[7] V. Garg, G. Renuka, R. Kumar and K. Gupta, “Adsorption of Chromium from Aqueous Solution or Treated Sawdust,” Bioresource Technology, Vol. 92, 2003, pp. 79-81. doi:10.1016/j.biortech.2003.07.004
[8] R. Wanchanthuek and A. Thapol, “The Kinetic Study of Methylene Blue Adsorption over MgO from PVA Template Preparation,” Journal of Environmental Science and Technology, Vol. 4, No. 5, 2011, pp. 552-559. doi:10.3923/jest.2011.552.559
[9] N. Pasukphun, S. Vinitnantharat and S. Gheewala, “Investigation of Decolorization of Textile Wastewater in an Anaerobic/Aerobic Biological Activated Carbon System (A/A BAC),” Pakistan Journal of Biological Sciences, Vol. 13, No. 19, 2010, pp. 316-324.
[10] J. C. Igwe, O. F. Mbonu and A. A. Abia, “Sorption Kinetics, Intraparticle Diffusion and Equilibrium Partitioning of Azo Dyes on Great Millet (Andropogon sorghum) Waste Biomass,” Journal of Applied Science, Vol. 7, No. 19, pp. 2840-2847.
[11] A. U. Itodo, F. W. Abdulrahman, L. G. Hassan, S. A. Maigandi and H. U. Itodo, “Gas Chromatographic Prediction of Equilibrium Phase Atrazine after Sorption onto Derived Activated Carbon,” International Journal of Poultry Science, Vol. 8, 2009, pp. 1174-1182. doi:10.3923/ijps.2009.1174.1182
[12] E. Dermibas, M. Kobya, E. Senturk and T. Ozkan, “Adsorption Kinetics for the Removal of Cr (VI) from Aqueous Solutions on the Activated Carbon Prepared From Agricultural Wastes,” Journal of Water, Vol. 30, No. 4, 2002, pp. 533-539.
[13] A. U. Itodo, “Comparative Study of the Preparation, Adsorption and Evaluation of Activated Carbons Prepared from Agricultural Wastes,” A Ph.D Thesis Submitted to the Department of Pure and Applied Chemistry, UsmanuDanfodiyo, Sokoto, pp. 30-33.
[14] A. U. Itodo, F. W. Abdulrahman, L.G. Hassan, S. A. Maigandi and U. O. Happiness, “Batch Kinetic Studies on the Bioremediation of Textile Effluent via Heavy Metal and Dye Adsorption,” International Journal of Chemical Sciences, Vol. 17, No. 2, 2009, pp. 27-23.
[15] B. H. Harmeed, “Evaluation of Papaya Seed as a Non-Conventional Low-Cost Adsorbent for Removal of Methylene Blue,” Hazardous Materials, Vol. 162, No. 2-3, 2009, pp. 939-944. doi:10.1016/j.jhazmat.2008.05.120
[16] Y. S. Ho and G. Mckay, “Pseudo Second Order Model for Sorption Processes,” Journal of Water, Vol. 34, No. 5, 1999, pp. 451-465.
[17] F. E. Okiemen, “Sorption Kinetics & Intraparticulate Diffusivities of Cd, Pb and Zn Ions on Maize Cob,” In: A. A. Abia and J. C. Igwe, African Journal of Biotechnology, Vol. 4, No. 6, 2005, pp. 509-512.