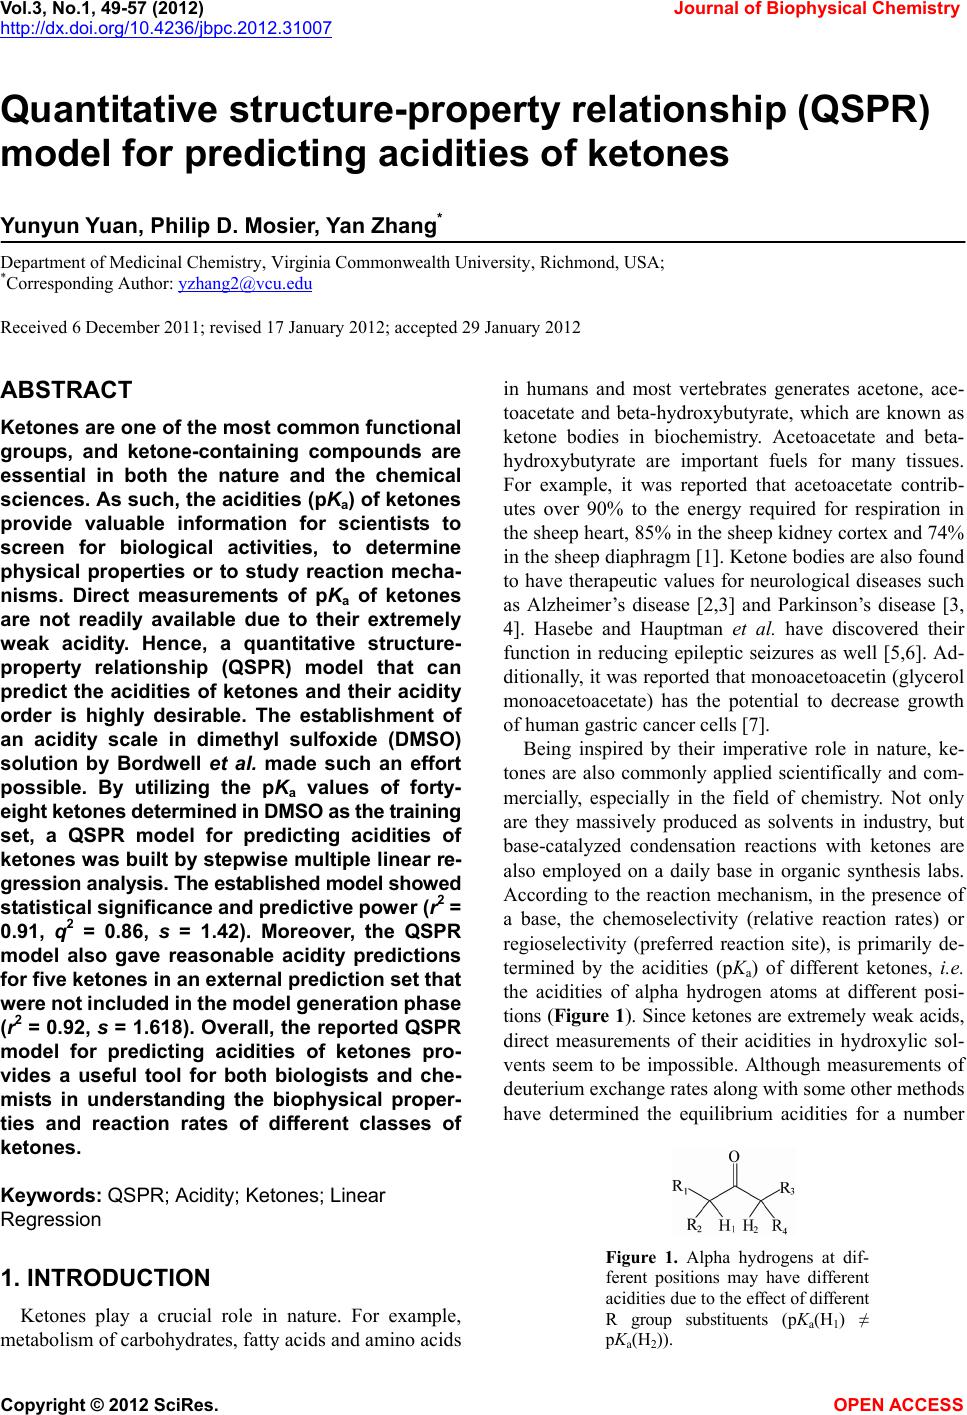
 Vol.3, No.1, 49-57 (2012) Journal of Biophysical Chemistry http://dx.doi.org/10.4236/jbpc.2012.31007 Quantitative structure-property relationship (QS P R) model for predicting acidities of ketones Yunyun Yuan, Philip D. Mosier, Yan Zhang* Department of Medicinal Chemistry, Virginia Commonwealth University, Richmond, USA; *Corresponding Author: yzhang2@vcu.edu Received 6 December 2011; revised 17 January 2012; accepted 29 January 2012 ABSTRACT Ketones are one of the most common functional groups, and ketone-containing compounds are essential in both the nature and the chemical sciences. As such, the acidities (pKa) of ketones provide valuable information for scientists to screen for biological activities, to determine physical properties or to study reaction mecha- nisms. Direct measurements of pKa of ketones are not readily available due to their extremely weak acidity. Hence, a quantitative structure- property relationship (QSPR) model that can predict the acidities of ketones and their acidity order is highly desirable. The establishment of an acidity scale in dimethyl sulfoxide (DMSO) solution by Bordwell et al. made such an effort possible. By utilizing the pKa values of forty- eight ketones determined in DMSO as the training set, a QSPR model for predicting acidities of ketones was built by stepwise multiple linear re- gression analysis. The established model showed st atistical significance and predictiv e power (r2 = 0.91, q2 = 0.86, s = 1.42). Moreover, the QSPR model also gave reasonable acidity predictions for five ketones in an external pre diction set that were not included in the model generation phase (r2 = 0.92, s = 1.618). Overall, the reported QSPR model for predicting acidities of ketones pro- vides a useful tool for both biologists and che- mists in understanding the biophysical proper- ties and reaction rates of different classes of ketones. Keywords: QSPR; Acidity; Ketones; Linear Regression 1. INTRODUCTION Ketones play a crucial role in nature. For example, metabolism of carbohydrates, fatty acids and amino acids in humans and most vertebrates generates acetone, ace- toacetate and beta-hydroxybutyrate, which are known as ketone bodies in biochemistry. Acetoacetate and beta- hydroxybutyrate are important fuels for many tissues. For example, it was reported that acetoacetate contrib- utes over 90% to the energy required for respiration in the sheep heart, 85% in the sheep kidney cortex and 74% in the sheep diaphragm [1]. Ketone bodies are also found to have therapeutic values for neurological diseases such as Alzheimer’s disease [2,3] and Parkinson’s disease [3, 4]. Hasebe and Hauptman et al. have discovered their function in reducing epileptic seizures as well [5,6]. Ad- ditionally, it was reported that monoacetoacetin (glycerol monoacetoacetate) has the potential to decrease growth of human gastric cancer cells [7]. Being inspired by their imperative role in nature, ke- tones are also commonly applied scientifically and com- mercially, especially in the field of chemistry. Not only are they massively produced as solvents in industry, but base-catalyzed condensation reactions with ketones are also employed on a daily base in organic synthesis labs. According to the reaction mechanism, in the presence of a base, the chemoselectivity (relative reaction rates) or regioselectivity (preferred reaction site), is primarily de- termined by the acidities (pKa) of different ketones, i.e. the acidities of alpha hydrogen atoms at different posi- tions (Figure 1). Since ketones are extremely weak acids, direct measurements of their acidities in hydroxylic sol- vents seem to be impossible. Although measurements of deuterium exchange rates along with some other methods have determined the equilibrium acidities for a number Figure 1. Alpha hydrogens at dif- ferent positions may have different acidities due to the effect of different R group substituents (pKa(H1) ≠ pKa(H2)). Copyright © 2012 SciRes. OPEN A CCESS 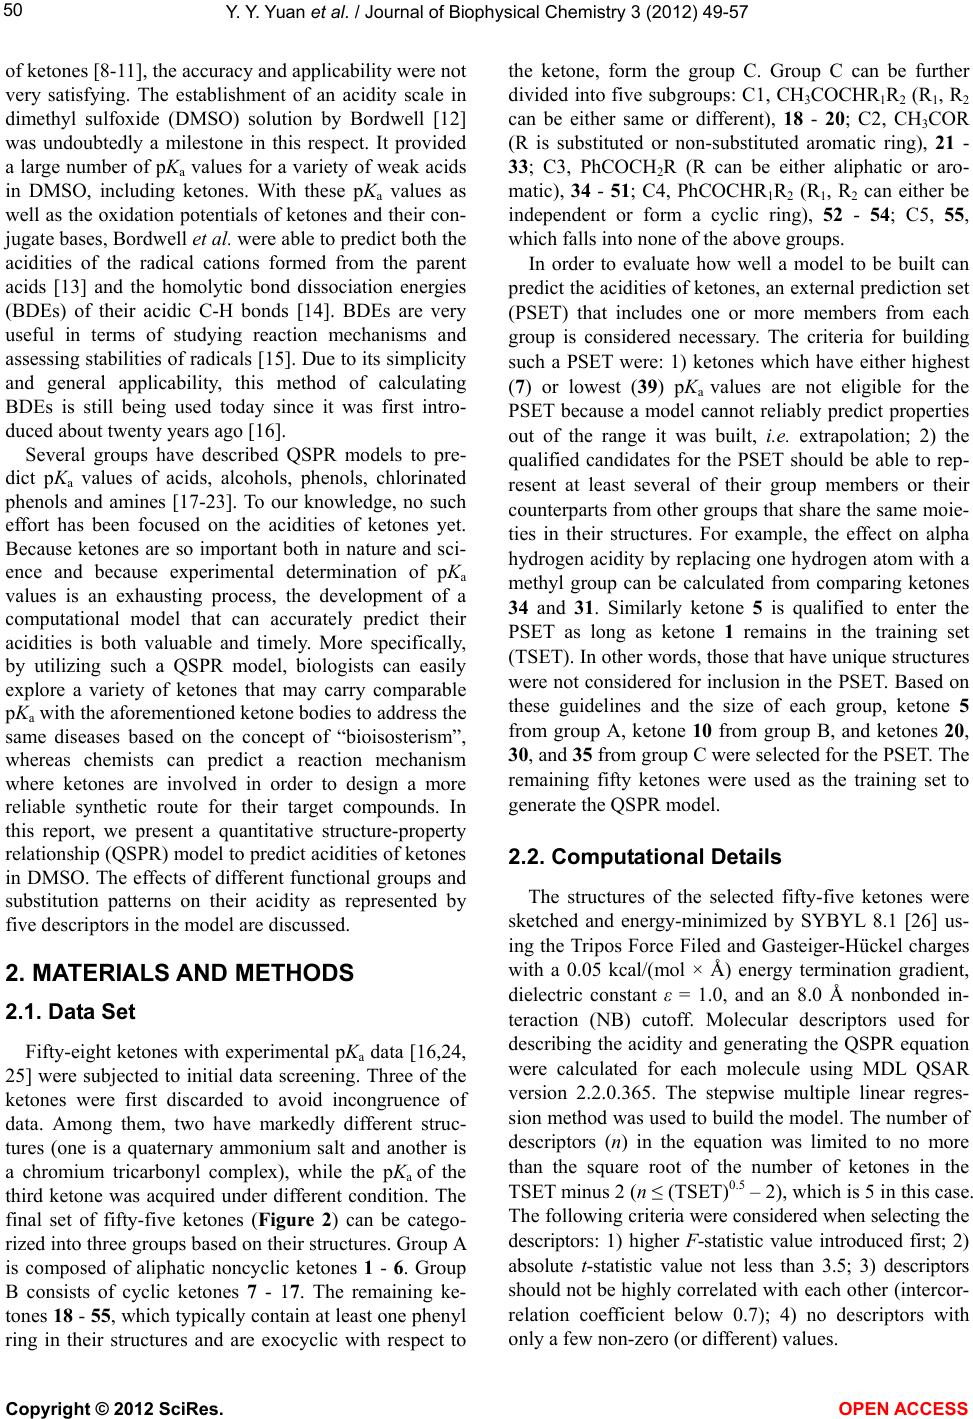 Y. Y. Yuan et al. / Journal of Biophysical Chemistry 3 (2012) 49-57 50 of ketones [8-11], the accuracy and applicability were not very satisfying. The establishment of an acidity scale in dimethyl sulfoxide (DMSO) solution by Bordwell [12] was undoubtedly a milestone in this respect. It provided a large number of pKa values for a variety of weak acids in DMSO, including ketones. With these pKa values as well as the oxidation potentials of ketones and their con- jugate bases, Bordwell et al. were able to predict both the acidities of the radical cations formed from the parent acids [13] and the homolytic bond dissociation energies (BDEs) of their acidic C-H bonds [14]. BDEs are very useful in terms of studying reaction mechanisms and assessing stabilities of radicals [15]. Due to its simplicity and general applicability, this method of calculating BDEs is still being used today since it was first intro- duced about twenty years ago [16]. Several groups have described QSPR models to pre- dict pKa values of acids, alcohols, phenols, chlorinated phenols and amines [17-23]. To our knowledge, no such effort has been focused on the acidities of ketones yet. Because ketones are so important both in nature and sci- ence and because experimental determination of pKa values is an exhausting process, the development of a computational model that can accurately predict their acidities is both valuable and timely. More specifically, by utilizing such a QSPR model, biologists can easily explore a variety of ketones that may carry comparable pKa with the aforementioned ketone bodies to address the same diseases based on the concept of “bioisosterism”, whereas chemists can predict a reaction mechanism where ketones are involved in order to design a more reliable synthetic route for their target compounds. In this report, we present a quantitative structure-property relationship (QSPR) model to predict acidities of ketones in DMSO. The effects of different functional groups and substitution patterns on their acidity as represented by five descriptors in the model are discussed. 2. MATERIALS AND METHODS 2.1. Data Set Fifty-eight ketones with experimental pKa data [16,24, 25] were subjected to initial data screening. Three of the ketones were first discarded to avoid incongruence of data. Among them, two have markedly different struc- tures (one is a quaternary ammonium salt and another is a chromium tricarbonyl complex), while the pKa of the third ketone was acquired under different condition. The final set of fifty-five ketones (Figure 2) can be catego- rized into three groups based on their structures. Group A is composed of aliphatic noncyclic ketones 1 - 6. Group B consists of cyclic ketones 7 - 17. The remaining ke- tones 18 - 55, which typically contain at least one phenyl ring in their structures and are exocyclic with respect to the ketone, form the group C. Group C can be further divided into five subgroups: C1, CH3COCHR1R2 (R1, R2 can be either same or different), 18 - 20; C2, CH3COR (R is substituted or non-substituted aromatic ring), 21 - 33; C3, PhCOCH2R (R can be either aliphatic or aro- matic), 34 - 51; C4, PhCOCHR1R2 (R1, R2 can either be independent or form a cyclic ring), 52 - 54; C5, 55, which falls into none of the above groups. In order to evaluate how well a model to be built can predict the acidities of ketones, an external prediction set (PSET) that includes one or more members from each group is considered necessary. The criteria for building such a PSET were: 1) ketones which have either highest (7) or lowest (39) pKa values are not eligible for the PSET because a model cannot reliably predict properties out of the range it was built, i.e. extrapolation; 2) the qualified candidates for the PSET should be able to rep- resent at least several of their group members or their counterparts from other groups that share the same moie- ties in their structures. For example, the effect on alpha hydrogen acidity by replacing one hydrogen atom with a methyl group can be calculated from comparing ketones 34 and 31. Similarly ketone 5 is qualified to enter the PSET as long as ketone 1 remains in the training set (TSET). In other words, those that have unique structures were not considered for inclusion in the PSET. Based on these guidelines and the size of each group, ketone 5 from group A, ketone 10 from group B, and ketones 20, 30, and 35 from group C were selected for the PSET. The remaining fifty ketones were used as the training set to generate the QSPR model. 2.2. Computational Details The structures of the selected fifty-five ketones were sketched and energy-minimized by SYBYL 8.1 [26] us- ing the Tripos Force Filed and Gasteiger-Hückel charges with a 0.05 kcal/(mol × Å) energy termination gradient, dielectric constant ε = 1.0, and an 8.0 Å nonbonded in- teraction (NB) cutoff. Molecular descriptors used for describing the acidity and generating the QSPR equation were calculated for each molecule using MDL QSAR version 2.2.0.365. The stepwise multiple linear regres- sion method was used to build the model. The number of descriptors (n) in the equation was limited to no more than the square root of the number of ketones in the TSET minus 2 (n ≤ (TSET)0.5 – 2), which is 5 in this case. The following criteria were considered when selecting the descriptors: 1) higher F-statistic value introduced first; 2) absolute t-statistic value not less than 3.5; 3) descriptors should not be highly correlated with each other (intercor- relation coefficient below 0.7); 4) no descriptors with nly a few non-zero (or different) values. o Copyright © 2012 SciRes. OPEN A CCESS 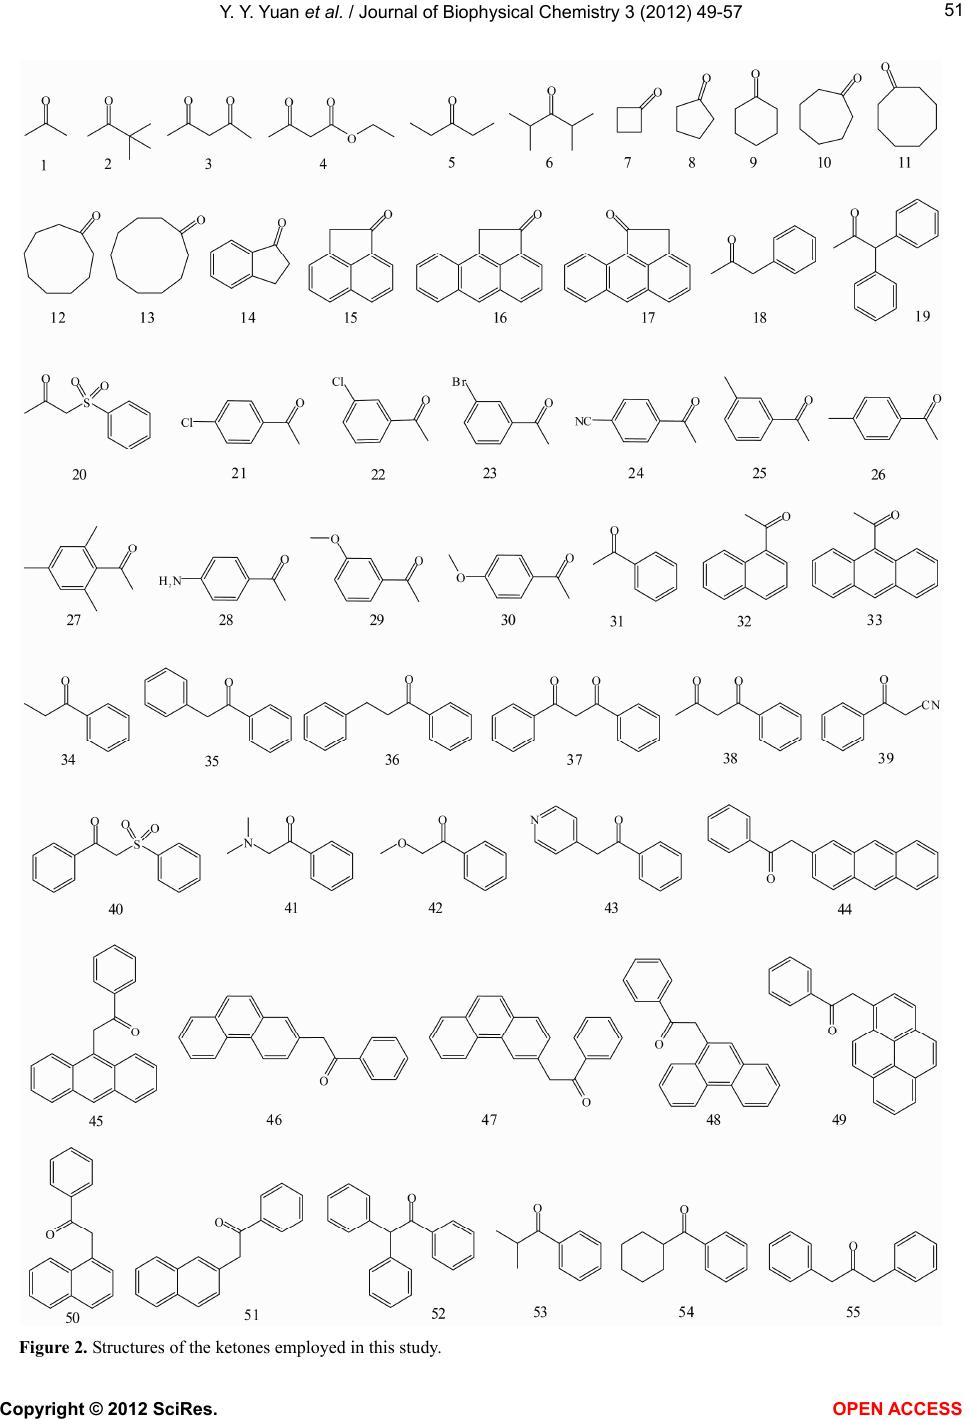 Y. Y. Yuan et al. / Journal of Biophysical Chemistry 3 (2012) 49-57 Copyright © 2012 SciRes. 51 Figure 2. Structures of the ketones employed in this study. OPEN ACCESS  Y. Y. Yuan et al. / Journal of Biophysical Chemistry 3 (2012) 49-57 52 3. RESULTS AND DISCUSSION 3.1. QSPR Model Building A QSPR model for predicting the pKa of ketones in DMSO was generated using the method described above by utilizing the fifty ketones in the training set: pKa = –15.95 × Hmin – 6.931 × SdssC_acnt + 5.091 × Qv – 23.49 × MaxNeg – 1.434 × nelem + 29.0743 (1) (n = 50, r2 = 0.86, q2 = 0.80, s = 1.92, F = 54.19, P = 2.3E–5) where Hmin is an atom-type electrotopological state (E- state) descriptor encoding the minimum hydrogen E-state value (HS) in a molecule [27]. The calculation of a HS (HSi) is given as follows: v2 2 ijiii ji j HS0.2NI Ir where δv is all the valence electrons associated with the atom i; δ is the non-hydrogen bonded sigma electron count; N is the principal quantum number; the intrinsic state value I is defined as: 2v I2N 1 The HS tends to be the smallest for hydrogen which is bonded to an element of low electronegativity. SdssC_acnt is an atom-type count that represents the number of all non-aromatic sp2 hybridized carbons (=C<) in the mole- cule (such as O=C<, S=C<). Qv is a whole-molecule E- state polarity index that decreases as the polarity in- creases [27]. It encodes the existence of heteroatoms and polar functional groups and is given by: 2 max alkane ii i iii Qv III where = the intrinsic state value of the atom where the following replacements have been made: 1) all ter- minal atoms replaced by -F; 2) all divalent atoms re- placed by -O-; 3) all trivalent atoms replaced by >N-; 4) all quaternary atoms replaced by >C<. MaxNeg reflects the largest partial negative charge over the atoms in a molecule. Nelem is the total number of different ele- ments in the molecule. max i I The statistical parameters that describe the quality of the regression Eq.1 such as squared correlation coeffi- cient (r2), predictive squared correlation coefficient (q2), standard error of estimation (s), Fisher’s F-value using the F statistic (F), and P-value using the F statistic (P) are given below Eq.1. As shown in the plot of the calculated pKa against ex- perimental pKa (Figure 3), Eq.1 poorly predicted the pKa of four ketones, which are 28, 37, 39, and 52, especially for ketone 39, with an absolute residual between the pre- diction and experimental data of nearly 6 log units. There Figure 3. Plot of calculated pKa vs. experimental pKa for Eq.1 (●) and Eq.2 (○). are two ketones containing cyano groups, 24 and 39. The influence of the cyano group on the acidity of 39 is more profound than it is on 24, since the cyano group is di- rectly attached to the methylene group in 39. However, among the five descriptors, only Hmin partially reflected this distance difference between the cyano group and the alpha hydrogen atoms. This could be the cause of poor acidity prediction for 39. Since these descriptors are fa- vorable for most of the members in the TSET, a second model was thus built without ketone 39 to test this hy- pothesis by using the same method mentioned above to give Eq.2: pKa = –12.46 × Hmin – 6.337 × SdssC_acnt + 7.187 × Qv – 23.43 × MaxNeg – 2.634 × xc3 + 21.2905 (2) (n = 49, r2 = 0.90, q2 = 0.85, s = 1.58, F = 74.54, P = 1.6E–5) where xc3 is the simple 3rd order chi cluster connectivity index and it is defined for a single branch point (“Y” type) and encodes the number and branching environ- ments of such points [28]. For example, acetone (1) has only one such a branching point, whereas 3,3-dimethyl- butan-2-one (2) has five. A more detailed illustration of the xc3 calculation is found in Figure 4 for ketones 1 and 2. By leaving out ketone 39, not only the r2 value is im- proved, but more importantly, the cross-validation indi- cated a more robust model. However, the prediction of ketone 43 by Eq.2 was far from acceptable, with a re- sidual of –4.5 log units (Figure 3). The nitrogen atom in the pyridine ring of 43 has the same electron-withdraw- ing effect as a nitro group, but none of the five descrip- tors can reveal this feature. Additionally, the absolute t- Copyright © 2012 SciRes. OPEN A CCESS 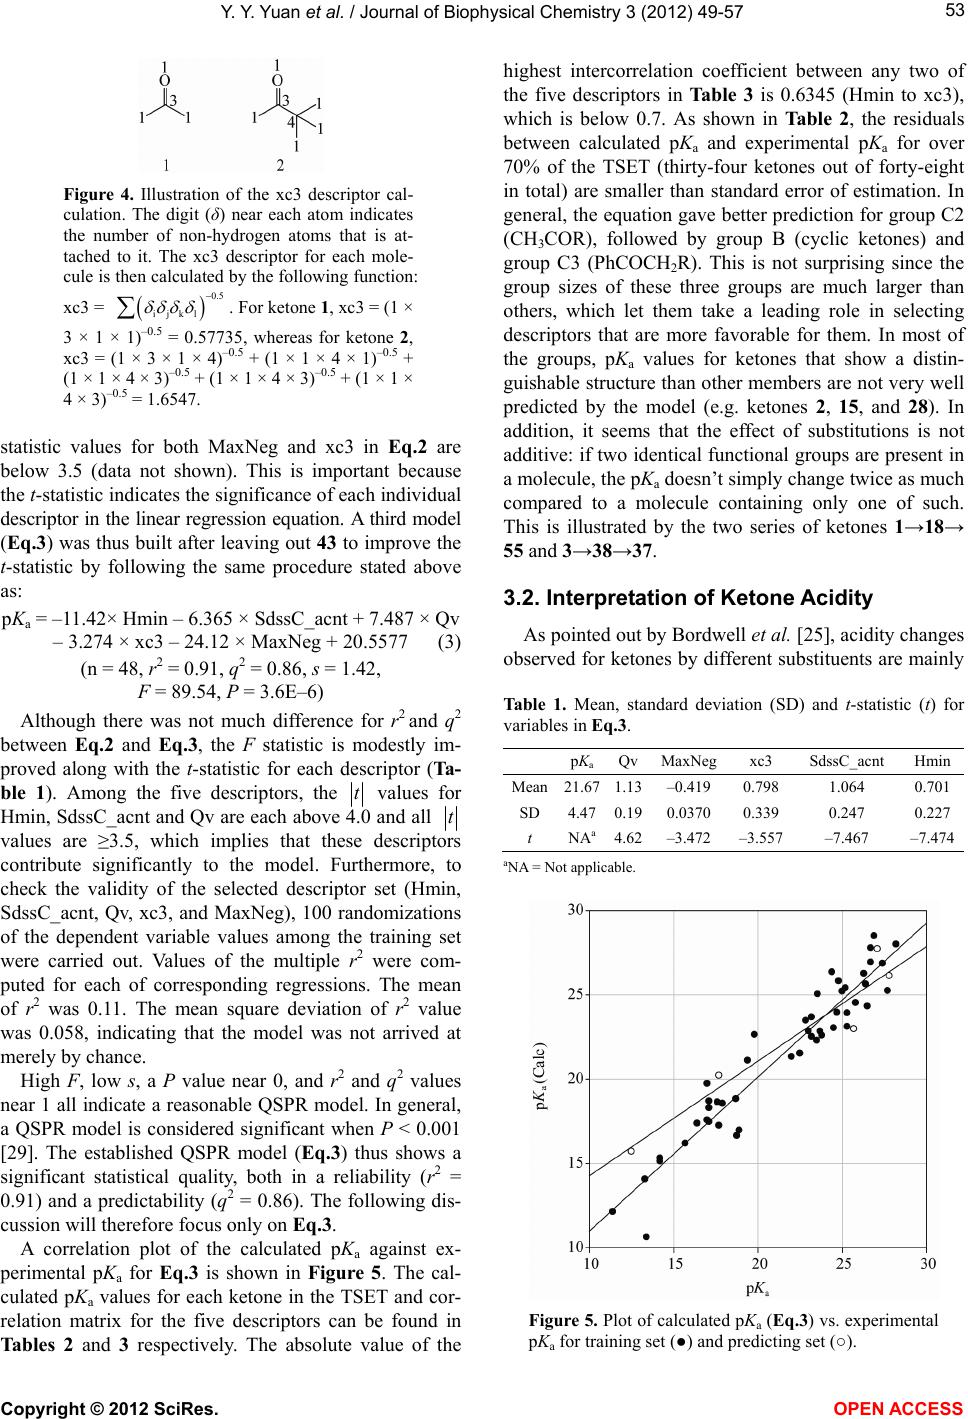 Y. Y. Yuan et al. / Journal of Biophysical Chemistry 3 (2012) 49-57 53 Figure 4. Illustration of the xc3 descriptor cal- culation. The digit (δ) near each atom indicates the number of non-hydrogen atoms that is at- tached to it. The xc3 descriptor for each mole- cule is then calculated by the following function: xc3 = 0.5 ijkl . For ketone 1, xc3 = (1 × 3 × 1 × 1)–0.5 = 0.57735, whereas for ketone 2, xc3 = (1 × 3 × 1 × 4)–0.5 + (1 × 1 × 4 × 1)–0.5 + (1 × 1 × 4 × 3)–0.5 + (1 × 1 × 4 × 3)–0.5 + (1 × 1 × 4 × 3)–0.5 = 1.6547. statistic values for both MaxNeg and xc3 in Eq.2 are below 3.5 (data not shown). This is important because the t-statistic indicates the significance of each individual descriptor in the linear regression equation. A third model (Eq.3) was thus built after leaving out 43 to improve the t-statistic by following the same procedure stated above as: pKa = –11.42× Hmin – 6.365 × SdssC_acnt + 7.487 × Qv – 3.274 × xc3 – 24.12 × MaxNeg + 20.5577 (3) (n = 48, r2 = 0.91, q2 = 0.86, s = 1.42, F = 89.54, P = 3.6E–6) Although there was not much difference for r2 and q2 between Eq.2 and Eq.3, the F statistic is modestly im- proved along with the t-statistic for each descriptor (Ta- ble 1). Among the five descriptors, the t values for Hmin, SdssC_acnt and Qv are each above 4.0 and all t values are ≥3.5, which implies that these descriptors contribute significantly to the model. Furthermore, to check the validity of the selected descriptor set (Hmin, SdssC_acnt, Qv, xc3, and MaxNeg), 100 randomizations of the dependent variable values among the training set were carried out. Values of the multiple r2 were com- puted for each of corresponding regressions. The mean of r2 was 0.11. The mean square deviation of r2 value was 0.058, indicating that the model was not arrived at merely by chance. High F, low s, a P value near 0, and r2 and q2 values near 1 all indicate a reasonable QSPR model. In general, a QSPR model is considered significant when P < 0.001 [29]. The established QSPR model (Eq.3) thus shows a significant statistical quality, both in a reliability (r2 = 0.91) and a predictability (q2 = 0.86). The following dis- cussion will therefore focus only on Eq.3. A correlation plot of the calculated pKa against ex- perimental pKa for Eq.3 is shown in Figure 5. The cal- culated pKa values for each ketone in the TSET and cor- relation matrix for the five descriptors can be found in Tables 2 and 3 respectively. The absolute value of the highest intercorrelation coefficient between any two of the five descriptors in Ta b l e 3 is 0.6345 (Hmin to xc3), which is below 0.7. As shown in Ta ble 2, the residuals between calculated pKa and experimental pKa for over 70% of the TSET (thirty-four ketones out of forty-eight in total) are smaller than standard error of estimation. In general, the equation gave better prediction for group C2 (CH3COR), followed by group B (cyclic ketones) and group C3 (PhCOCH2R). This is not surprising since the group sizes of these three groups are much larger than others, which let them take a leading role in selecting descriptors that are more favorable for them. In most of the groups, pKa values for ketones that show a distin- guishable structure than other members are not very well predicted by the model (e.g. ketones 2, 15, and 28). In addition, it seems that the effect of substitutions is not additive: if two identical functional groups are present in a molecule, the pKa doesn’t simply change twice as much compared to a molecule containing only one of such. This is illustrated by the two series of ketones 1→18→ 55 and 3→38→37. 3.2. Interpretation of Ketone Acidity As pointed out by Bordwell et al. [25], acidity changes observed for ketones by different substituents are mainly Table 1. Mean, standard deviation (SD) and t-statistic (t) for variables in Eq.3. pKaQv MaxNeg xc3 SdssC_acnt Hmin Mean 21.671.13–0.419 0.798 1.064 0.701 SD 4.470.190.0370 0.339 0.247 0.227 t NAa4.62–3.472 –3.557 –7.467 –7.474 aNA = Not applicable. Figure 5. Plot of calculated pKa (Eq.3) vs. experimental pKa for training set (●) and predicting set (○). Copyright © 2012 SciRes. OPEN A CCESS 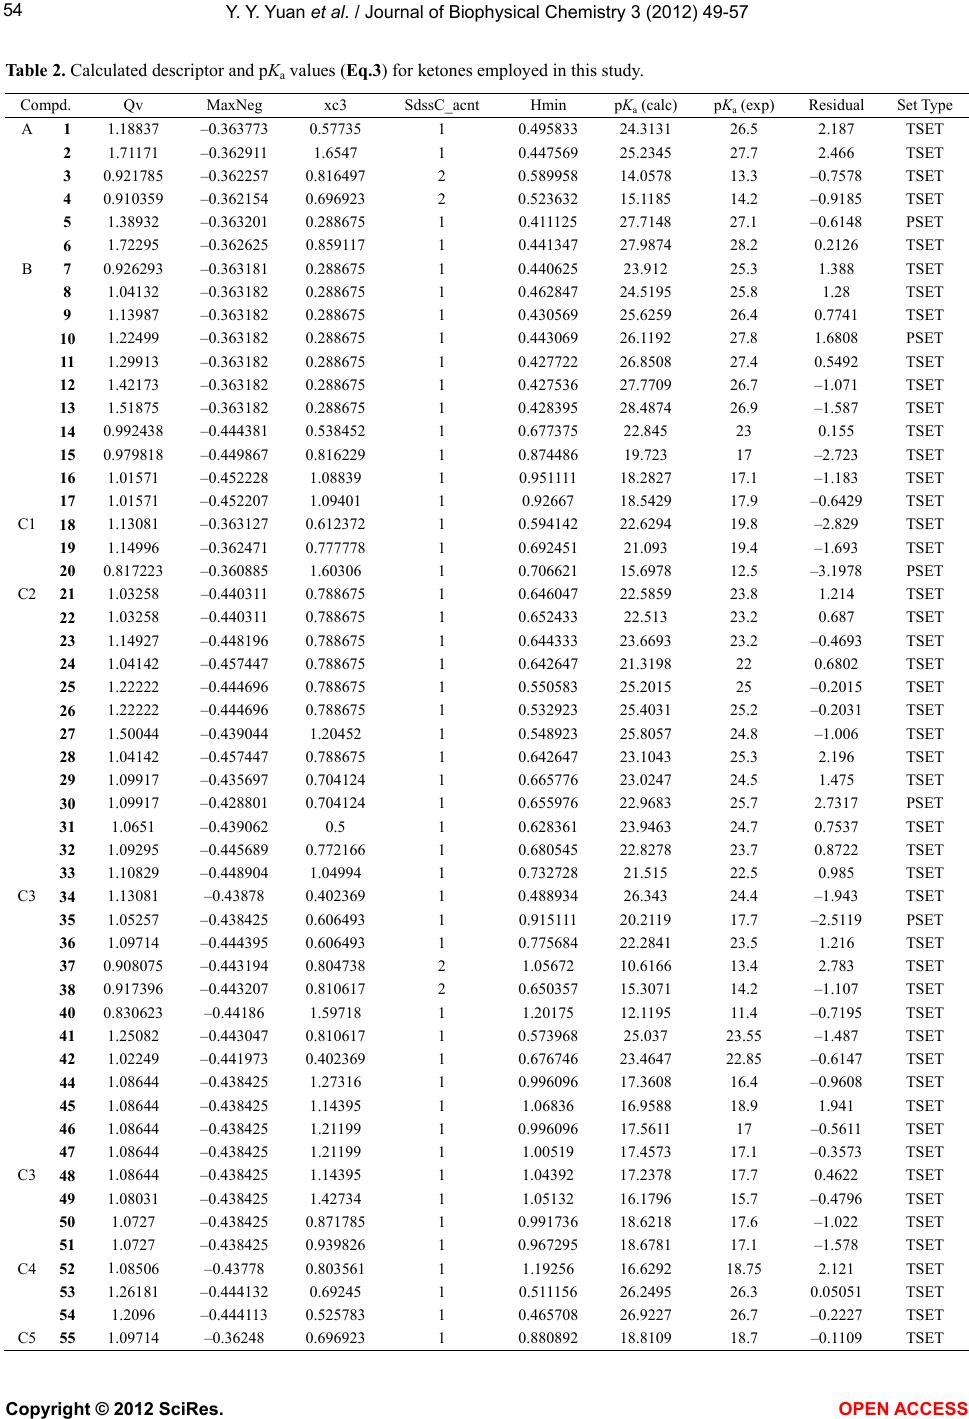 Y. Y. Yuan et al. / Journal of Biophysical Chemistry 3 (2012) 49-57 Copyright © 2012 SciRes. OPEN A CCESS 54 Table 2. Calculated descriptor and pKa values (Eq.3) for ketones employed in this study. Compd. Qv MaxNeg xc3 SdssC_acnt Hmin pKa (calc) pKa (exp) Residual Set Type 1 1.18837 –0.363773 0.57735 1 0.495833 24.3131 26.5 2.187 TSET 2 1.71171 –0.362911 1.6547 1 0.447569 25.2345 27.7 2.466 TSET 3 0.921785 –0.362257 0.816497 2 0.589958 14.0578 13.3 –0.7578 TSET 4 0.910359 –0.362154 0.696923 2 0.523632 15.1185 14.2 –0.9185 TSET 5 1.38932 –0.363201 0.288675 1 0.411125 27.7148 27.1 –0.6148 PSET A 6 1.72295 –0.362625 0.859117 1 0.441347 27.9874 28.2 0.2126 TSET 7 0.926293 –0.363181 0.288675 1 0.440625 23.912 25.3 1.388 TSET 8 1.04132 –0.363182 0.288675 1 0.462847 24.5195 25.8 1.28 TSET 9 1.13987 –0.363182 0.288675 1 0.430569 25.6259 26.4 0.7741 TSET 10 1.22499 –0.363182 0.288675 1 0.443069 26.1192 27.8 1.6808 PSET 11 1.29913 –0.363182 0.288675 1 0.427722 26.8508 27.4 0.5492 TSET 12 1.42173 –0.363182 0.288675 1 0.427536 27.7709 26.7 –1.071 TSET 13 1.51875 –0.363182 0.288675 1 0.428395 28.4874 26.9 –1.587 TSET 14 0.992438 –0.444381 0.538452 1 0.677375 22.845 23 0.155 TSET 15 0.979818 –0.449867 0.816229 1 0.874486 19.723 17 –2.723 TSET 16 1.01571 –0.452228 1.08839 1 0.951111 18.2827 17.1 –1.183 TSET B 17 1.01571 –0.452207 1.09401 1 0.92667 18.5429 17.9 –0.6429 TSET 18 1.13081 –0.363127 0.612372 1 0.594142 22.6294 19.8 –2.829 TSET 19 1.14996 –0.362471 0.777778 1 0.692451 21.093 19.4 –1.693 TSET C1 20 0.817223 –0.360885 1.60306 1 0.706621 15.6978 12.5 –3.1978 PSET 21 1.03258 –0.440311 0.788675 1 0.646047 22.5859 23.8 1.214 TSET 22 1.03258 –0.440311 0.788675 1 0.652433 22.513 23.2 0.687 TSET 23 1.14927 –0.448196 0.788675 1 0.644333 23.6693 23.2 –0.4693 TSET 24 1.04142 –0.457447 0.788675 1 0.642647 21.3198 22 0.6802 TSET 25 1.22222 –0.444696 0.788675 1 0.550583 25.2015 25 –0.2015 TSET 26 1.22222 –0.444696 0.788675 1 0.532923 25.4031 25.2 –0.2031 TSET 27 1.50044 –0.439044 1.20452 1 0.548923 25.8057 24.8 –1.006 TSET 28 1.04142 –0.457447 0.788675 1 0.642647 23.1043 25.3 2.196 TSET 29 1.09917 –0.435697 0.704124 1 0.665776 23.0247 24.5 1.475 TSET 30 1.09917 –0.428801 0.704124 1 0.655976 22.9683 25.7 2.7317 PSET 31 1.0651 –0.439062 0.5 1 0.628361 23.9463 24.7 0.7537 TSET 32 1.09295 –0.445689 0.772166 1 0.680545 22.8278 23.7 0.8722 TSET C2 33 1.10829 –0.448904 1.04994 1 0.732728 21.515 22.5 0.985 TSET 34 1.13081 –0.43878 0.402369 1 0.488934 26.343 24.4 –1.943 TSET 35 1.05257 –0.438425 0.606493 1 0.915111 20.2119 17.7 –2.5119 PSET 36 1.09714 –0.444395 0.606493 1 0.775684 22.2841 23.5 1.216 TSET 37 0.908075 –0.443194 0.804738 2 1.05672 10.6166 13.4 2.783 TSET 38 0.917396 –0.443207 0.810617 2 0.650357 15.3071 14.2 –1.107 TSET 40 0.830623 –0.44186 1.59718 1 1.20175 12.1195 11.4 –0.7195 TSET 41 1.25082 –0.443047 0.810617 1 0.573968 25.037 23.55 –1.487 TSET 42 1.02249 –0.441973 0.402369 1 0.676746 23.4647 22.85 –0.6147 TSET 44 1.08644 –0.438425 1.27316 1 0.996096 17.3608 16.4 –0.9608 TSET 45 1.08644 –0.438425 1.14395 1 1.06836 16.9588 18.9 1.941 TSET 46 1.08644 –0.438425 1.21199 1 0.996096 17.5611 17 –0.5611 TSET C3 47 1.08644 –0.438425 1.21199 1 1.00519 17.4573 17.1 –0.3573 TSET 48 1.08644 –0.438425 1.14395 1 1.04392 17.2378 17.7 0.4622 TSET 49 1.08031 –0.438425 1.42734 1 1.05132 16.1796 15.7 –0.4796 TSET 50 1.0727 –0.438425 0.871785 1 0.991736 18.6218 17.6 –1.022 TSET C3 51 1.0727 –0.438425 0.939826 1 0.967295 18.6781 17.1 –1.578 TSET 52 1.08506 –0.43778 0.803561 1 1.19256 16.6292 18.75 2.121 TSET 53 1.26181 –0.444132 0.69245 1 0.511156 26.2495 26.3 0.05051 TSET C4 54 1.2096 –0.444113 0.525783 1 0.465708 26.9227 26.7 –0.2227 TSET C5 55 1.09714 –0.36248 0.696923 1 0.880892 18.8109 18.7 –0.1109 TSET  Y. Y. Yuan et al. / Journal of Biophysical Chemistry 3 (2012) 49-57 55 Table 3. Correlation matrix (r values) for descriptors in Eq.3. pKa Qv MaxNeg xc3 SdssC_acntHmin pKa 1 Qv 0.628 1 MaxNeg 0.2247 0.3353 1 xc3 –0.5299 0.0181 –0.3723 1 SdssC_acnt –0.4585 –0.3003 0.21 –0.01812 1 Hmin –0.7548 –0.4545 –0.5028 0.6345 –0.1316 1 a balance among three effects: 1) steric effect on reso- nance and solvation of the anion; 2) stabilizing effect on the enolate ion either through delocalization or induction; and 3) lone-pair-lone-pair electron repulsions. Among the five descriptors in Eq.3, Qv is positively correlated with pKa, and the other four descriptors con- tribute negatively to the pKa value, especially Hmin. Be- ing developed to encode both the electronic and steric attributes of atoms in a molecule, two indices might be expected to successfully capture the features influencing pKa as noted in the previous paragraph. Indeed, the E- state index Hmin was selected as one of the most sig- nificant descriptors in the model. As shown in Ta ble 2, except for 44 and 46, the ketones have unique Hmin values. Furthermore, Hmin is significantly inversely cor- related with pKa (Table 3) and ketones that have Hmin values larger than 0.8 (e.g. 15 - 17, 37, 40, etc.) tend to be more acidic (observed pKa values are among 11.4 to 18.9). Therefore these compounds are well predicted. A more specific example could be illustrated by comparing 21 to 22. Having identical values for the other four de- scriptors, the differences in their Hmin properties de- cided the variations in their pKa values. The meta-chloro group in 22 generates a stronger induced electron with- drawing effect on the enolate ion than the para-chloro group in 21 does, and hence 22 is more acidic than 21. The steric effect reflected by Hmin is exemplified by comparing 16 to 17 (although 16 and 17 don’t have ex- actly matching MaxNeg and xc3 values, the role of both descriptors is quite insignificant comparing to Hmin, in this case). As suggested by their 3D structures, atoms C2, C2a and C3 are not in the same plane as the C4-C10 at- oms, and this generates a more hindered environment for the methylene group in 17 than the one in 16. Since steric effect contributes negatively to the acidity, 16 is more acidic than 17. On the other hand, Hmin seemed not sufficient to evaluate the acidity of polycyclic aro- matic ketones. For example, although 48 is more acidic than 45, 45 shows a higher Hmin value than 48 in spite of the fairly strong inverse relationship between pKa and Hmin (see Table 2). The impact of SdssC_acnt on ketones acidities can be easily observed for 3 - 4 and 37 - 38 compared to the rest of the ketones. The SdssC_acnt values for these four ke- tones are 2, two times of those for other ketones (Table 2), which makes them quite acidic as demonstrated by the lower pKa of 3 and 38 than 1 and 31 respectively. This was due to the additional electron withdrawing ef- fect contributed by the second carbonyl group. Not surprisingly, geometric and positional isomers have the same Qv values (for example, 44 - 48). Among the forty-eight ketones, only 3 - 4, 7, 37 - 38, and 40 have Qv values less than 0.95. It is not difficult to under- stand that 3 - 4, and 37 - 38 are more polar due to the presence of second carbonyl groups. Similarly, the sul- fonyl group in 40 makes the molecule more polar. These moieties are electron-withdrawing groups, which have a stabilizing effect on the enolate ion through their induc- tive stabilizing effect, and therefore the ketones contain- ing these moieties are more acidic. Cyclobutanone 7 is the most polar compound in the aliphatic cycloketones category, and has the lowest pKa amongst them. On the other hand this descriptor as well as others would not be able to distinguish among different conformation of ke- tones (such as cis vs. trans, chair vs. boat) and its influ- ence to the acidity of the ketones. Descriptor xc3 is an indicator of the degree of third order branching, and thus implicates the effect of substi- tution in a molecule. A molecule that is relatively com- pact at some point(s) will have a higher xc3 value. There are eleven ketones of which xc3 values are larger than 1 in the TSET. A critical aspect will have to be considered when xc3 is involved to explain the acidities of ketones in addition to the hindrance effect it causes, that is, whether the branching at certain position(s) can stabilize the enolate ion. This factor is perfectly demonstrated by ketones 16 - 17, 44 - 49 and 40. The enolate ion for ke- tone 40 is stabilized through inducing effect by sulfonyl group, whereas the delocalization of the anion (the nega- tive charge is distributed to the phenyl rings through resonance) is achieved for ketones 16 - 17 and 44 - 49. In contrast, the increased branching in ketone 2 can’t attain either of the above effects, and this counts for its de- creased acidity, compared to the less branching counter- part 1. For ketone 2, the steric hindrance for the solvation of its anion is the determining factor for pKa. MaxNeg is a charge index. Most of the ketones carry similar MaxNeg values. Interestingly, no matter what the size of the cycloketones is, they share the same MaxNeg value. More importantly, the MaxNeg values for ketones in which the carbonyl groups are directly attached to a phenyl ring are around –0.44. The MaxNeg values for the remaining ketones are approximately –0.36. The re- pulsion between the negatively charged carbonyl oxygen and the aromatic pi-bonds, which is unfavorable for the stability of the enolate ion, might be the reason that MaxNeg contributes negatively to the pKa of the ketones, a similar effect that lone-pair-lone-pair electron repul- Copyright © 2012 SciRes. OPEN A CCESS  Y. Y. Yuan et al. / Journal of Biophysical C he m istry 3 (2012) 49-57 56 sions have. 3.3. Ketone Acidity Prediction To further validate the built QSPR model, the gener- ated regression Eq.3 was used to predict the pKa of the five ketones in the external prediction set (Table 2). A correlation plot of the calculated pKa against experimen- tal pKa for the PSET is shown in Figure 5. A linear re- gression was performed for the calculated pKa and the experimental pKa. The statistics r2 and s are 0.92 and 1.618 respectively, which was considered to be satisfac- tory. Table 2 showed that the QSPR model estimated the acidity for those ketones with acceptable values while the best prediction was obtained for compound 5. Com- pound 20 is one of the only two ketones that carry a sul- fonyl group, providing an explanation for the relatively poor prediction. The pKa shows a parabolic relationship with the ring size of cycloketones 4 - 9, with the pKa of cyclohepta- none 10 being the highest. However, cycloheptanone 10 wasn’t in the TSET when the model was built to reveal this characteristic and hence none of the five descriptors in the QSPR model Eq.3 can actually reflect this par- ticular feature of cycloketones. Having a small number of members among the whole training set also likely confounded the prediction of the relative acidities of ke- tones in this series, although the residuals for most cy- cloketones are acceptable. 4. CONCLUSION Ketones are important in both biochemistry and or- ganic chemistry, and information about their pKa proper- ties will be beneficial for both biologists and chemists. The direct measurements of pKa of ketones are not avail- able due to their extremely weak acidity. Hence, a QSPR model which can be used to predict the acidities of ke- tones is highly desirable. Fifty-five ketones of which the pKa in DMSO were determined using the method devel- oped by Bordwell were used to build such a QSPR model. By leaving out two ketones (39 and 43) that show unique structures from others, the training set of forty- eight ketones in three main classes covering most func- tional groups with an overall pKa in DMSO ranging from 11.4 to 28.2 is very well described by the statistically significant regression Eq.3 (r2 = 0.91, q2 = 0.86, s = 1.42). Steps have been taken to ensure the quality of the generated QSPR model in this paper. Importantly, the five descriptors used to build the model are largely che- mically intuitive and in agreement with the proposed theory that describes the acidity of ketones, which further strengthened the significance of the model. Moreover, the QSPR model can reasonably predict the acidity of the five ketones in the external prediction set (r2 = 0.92, s = 1.618). We anticipate that the model obtained will be useful for prediction of ketone acidity that may be related to their reactivity, reaction mechanism, and possibly some biophysical properties in biological systems. 5. ACKNOWLEDGEMENTS The authors thank Dr. Lemont B. Kier for his kind encouragement and guidance during the study. Dr. Y. Y. would like to acknowledge the Department of Medicinal Chemistry, Virginia Commonwealth Univer- sity for providing excellent learning experience for all the postdoctoral fellows. REFERENCES [1] Krebs, H.A. (1961) The physiological role of ketone bodies. Biochemical Journal, 80, 225-233. [2] Henderson, S.T. (2010) Ketone bodies as a therapeutic for Alzheimer’s disease. RSC Drug Discovery Series, 2, 275- 306. [3] Kashiwaya, Y., Takeshima, T., Mori, N., Nakashima, K., Clarke, K. and Veech, R.L. (2000) D-β-Hydroxybutyrate protects neurons in models of Alzheimer’s and Parkin- son’s disease. Proceedings of the National Academy of Sciences of the United States of America, 97, 5440-5444. doi:10.1073/pnas.97.10.5440 [4] Cornille, E., Abou-Hamdan, M., Khrestchatisky, M., Henderson, S.T., Nieoullon, A., De Reggi, M. and Gharib, B. (2010) Enhancement of L-3-hydroxybutyryl-CoA de- hydrogenase activity and circulating ketone body levels by pantethine. Relevance to dopaminergic injury. BMC Neuroscience, 11 , 51. doi:10.1186/1471-2202-11-51 [5] Hasebe, N., Abe, K., Sugiyama, E., Hosoi, R. and Inoue, O. (2010) Anticonvulsant effects of methyl ethyl ketone and diethyl ketone in several types of mouse seizure models. European Journal of Pharmacology, 642 , 66-71. doi:10.1016/j.ejphar.2010.05.036 [6] Hauptman, J.S. (2010) From the bench to the bedside: Breaking down the blood-brain barrier, decoding the ha- benula, understanding hand choice, and the role of ketone bodies in epilepsy. Surgical Neurology International, 1, 86. doi:10.4103/2152-7806.74143 [7] Sawai, M., Yashiro, M., Nishiguchi, Y., Ohira, M. and Hirakawa, K. (2004) Growth-inhibitory effects of the ke- tone body, Monoacetoacetin, on human gastric cancer cells with succinyl-CoA: 3-oxoacid CoA-transferase (SCOT) deficiency. Anticancer Research, 24, 2213-2217. [8] Novak, M. and Loudon, G.M. (1977) The pKa of aceto- phenone in aqueous solution. Journal of Organic Chem- istry, 42, 2494-2498. doi:10.1021/jo00434a032 [9] Chiang, Y., Kresge, A.J., Tang, Y.S. and Wirz, J. (1984) The pKa and keto-enol equilibrium constant of acetone in aqueous solution. Journal of the American Chemical So- ciety, 106, 460-462. doi:10.1021/ja00314a055 [10] Chiang, Y., Kresge, A.J. and Wirz, J. (1984) Flash-ph- otolytic generation of acetophenone enol. The ketoenol equilibrium constant and pKa of acetophenone in aqueous Copyright © 2012 SciRes. OPEN A CCESS  Y. Y. Yuan et al. / Journal of Biophysical C he m istry 3 (2012) 49-57 Copyright © 2012 SciRes. OPEN A CCESS 57 solution. Journal of the American Chemical Society, 106, 6392-6395. doi:10.1021/ja00333a049 [11] Pollack, R.M., Mack, J.P.G. and Eldin, S. (1987) Direct observation of a dienolate intermediate in the base-cata- lyzed isomerization of 5-androstene-3,17-dione to 4-and- rostene-3,17-dione. Journal of the American Chemical Society, 109, 5048-5050. doi:10.1021/ja00250a061 [12] Bordwell, F.G. (1988) Equilibrium acidities in dimethyl sulfoxide solution. Accounts of Chemical Research, 21, 456-463. doi:10.1021/ar00156a004 [13] Bordwell, F.G. and Bausch, M.J. (1986) Radical cation acidities in dimethyl sulfoxide solution. Journal of the American Chemical Society, 108, 2473-2474. doi:10.1021/ja00269a071 [14] Bordwell, F.G., Cheng, J.P., et al. (1988) Homolytic bond dissociation energies in solution from equilibrium acidity and electrochemical data. Journal of the American Che- mical Society, 110, 1229-1231. doi:10.1021/ja00212a035 [15] Lowry, T.H. and Richardson, K.S. (1981) Mechanism and theory in organic chemistry. 2nd Edition, Harper and Row, New York. [16] Alnajjar, M.S., Zhang, X.-M., Gleicher, G.J., Truksa, S.V. and Franz, J.A. (2002) Equilibrium acidities and homo- lytic bond dissociation energies of acidic C-H bonds in α-arylacetophenones and related compounds. Journal of Organic Chemistry, 67, 9016-9022. doi:10.1021/jo020275s [17] Yu, H.-Y., Kühne, R., Ebert, R.-U. and Schüürman, G. (2010) Comparative analysis of QSAR models for pre- dicting pKa of organic oxygen acids and nitrogen bases from molecular structure. Journal of Chemical Informa- tion and Modeling, 50, 1949-1960. doi:10.1021/ci100306k [18] Eckert, F. and Klamt, A. (2006) Accurate prediction of basicity in aqueous solution with COSMO-RS. Journal of Computational Chemistry, 27, 11-19. doi:1002/jcc.20309 [19] Klamt, A., Eckert, F., Diedenhofen, M. and Beck, M.E. (2003) First principles calculations of aqueous pKa values for organic and inorganic acids using COSMO-RS reveal an inconsistency in the slope of the pKa scale. Journal of Physical Chemistry A, 107, 9380-9386. doi:10.1021/jp034688o [20] Liptak, M.D. and Shields, G.C. (2001) Accurate pKa Cal- culations for carboxylic acids using complete basis set and Gaussian-n models combined with CPCM continuum solvation methods. Journal of the American Chemical Society, 123, 7314-7319. doi:10.1021/ja010534f [21] Schüürman, G., Cossi, M., Barone, V. and Tomasi, J. (1998) Prediction of the pKa of carboxylic acids using the ab initio continuum-solvation model PCM-UAHF. Jour- nal of Physical Chemistry A, 102, 6706-6712. doi:10.1021/jp981922f [22] Schüürman, G. (1998) Quantum chemical analysis of the energy of proton transfer from phenol and chlorophenols to H2O in the gas phase and in aqueous solution. Journal of Chemical Physics, 109, 9523-9528. doi:10.1063/1.477614 [23] Schüürman, G. (1996) Modelling pKa of carboxylic acids and chlorinated phenols. Quantitative Structure-Activity Relationships, 15, 121-132. doi:10.1002/qsar.19960150206 [24] Bordwell, F.G. and Harrelson, J.A. Jr. (1990) Acidities and homolytic bond dissociation energies of the αC-H bonds in ketones in DMSO. Canadian Journal of Chem- istry, 68, 1714-1718. doi.org/10.1139/v90-266 [25] Bordwell, F.G., Harrelson, J.A. Jr. and Zhang, X.-M. (1991) Homolytic bond dissociation energies of acidic carbon-hydrogen bonds activated by one or two electron acceptors. Journal of Organic Chemistry, 56, 4448-4450. doi.org/10.1021/jo00014a022 [26] SYBYL 8.1, Tripos International, St. Louis, USA. [27] Kier, L. and Hall, L. (1999) Molecular structure descrip- tion: The electrotopological state. Academic Press, New York. [28] Kier, L. and Hall, L. (1986) Molecular connectivity in structure-activity analysis. Research Studies Press, Chich- ester. [29] Liao, S.-Y., Xu, L.-C., Qian, L. and Zheng, K.-Ch. (2007) QSAR and action mechanism of troxacitabine prodrugs with antitumor activity. Journal of Theoretical & Com- putational Chemistry, 6, 947-958. doi:10.1142/S0219633607003428
|