American Journal of Plant Sciences
Vol.3 No.7(2012), Article ID:20709,4 pages DOI:10.4236/ajps.2012.37114
Phosphorus Release from Sediments in a Riparian Phragmites australis Community at the Estuary of the Chikugogawa River, Western Japan
![]()
Faculty of Environmental Engineering, University of Kitakyushu, Kitakyushu, Japan.
Email: akhgc@kitakyu-u.ac.jp
Received April 25th, 2012; revised May 23rd, 2012; accepted June 2nd, 2012
Keywords: Phosphorus Mobilization; Productivity; Redox Potential; Riparian Plant Community; Salt Marsh
ABSTRACT
In order to determine the contribution of aquatic macrophyte communities on nutrition to sustain the high primary productivity of an estuary aquatic community, we analyzed the process of phosphorus release from sediments in aquatic macrophyte community in the estuary of the Chikugogawa River, South-Western Japan. Vertical profile of  concentration and redox potential (Eh) of pore water in sediments were investigated within and outside the Phragmites australis community. Sediment horizon lower than 23 cm layer from the surface showed anaerobic (Eh < −200 mV) in the P. australis community, whereas sediment was constantly oxic (Eh > 0 mV) up to 50 cm depth outside the P. australis community without organic matter accumulation. Non-vegetated sediment with organic matter accumulation showed anoxic profile as vegetated site.
  concentration in anaerobic parts of sediment showed higher than oxic parts, and higher
  concentration in sediment pore water corresponded to sulfur deposition in sediment. Sulfate ion supplied from the sea water is reduced under the anoxic condition and S2− reacts with water-insoluble phosphorus salts e.g. Fe3(PO4)2 or AlPO4 and Fe2S3 or Al2S3 precipitates. Thus
  was mobilized and released under anoxic sediments. P. australis supply organic litter to sediment and the sediment within the P. australis community showed anoxic after aerobic decomposition of organic substances in sediment. Incubation of sediments under N2 atmosphere accumulated
  in the medium corresponding to low Eh (< −300 mV) showing that
  was released under anaerobic condition. Estuary P. australis community has function for supplying
  to river water.
1. Introduction
Estuary is one of the most productive wetland ecosystems. Phosphorus is a limiting element in limnological ecosystems and hence the P mineralization and mobilization could limit the primary productivity of aquatic ecosystems [1]. Mobilization of P in aquatic ecosystems proceeds under the acidic or anaerobic conditions, and then the anoxic horizon of the sediments could be the active site of the P mobilization [2]. Especially sediments in the saline water environment e.g. marine sediment [3] or lagoon sediment [4] release inorganic phosphorus under anoxic condition. Freshwater sediments e.g. impoundment in river [5] or euotrophic lake [6] also supply inorganic phosphorus under anoxic condition, however Baldwin and Williams [7] demonstrated that phosphorus release from the freshwater lake sediment is limited by high concentration of nitrogen even under the anoxic condition. Jiand et al. [8] showed the contribution of organisms on the sediment surface and the biomass as well as activity of organisms determines the phosphorus release from the shallow lake both under the aerobic and anaerobic condition. Uplift of sediment materials by tidal change supply nutrients to the aquatic and riparian communities and the consequent increase of primary production [9,10], however, not only physical processes but also chemical and biological processes are important for the P mobilization in the estuary community. Banaszuk and Wysocka-Czubaszek [11] clarified that phosphorus deposits in the sediment during the winter season with high water flow rate, whereas phosphorus is released from the sediment in the summer season with low flow rate, high water temperature and low redox potential.
Wetlands are the main sink of phosphorus and then constructed wetlands are used for phosphorus removal by absorption by aquatic macrophytes [12,13]. At the same time, waterlogged wetland soil is anaerobic and  is released from the wetland soils [2,14-16]. Released
  from the anaerobic sediments is used as nutrients for aquatic plants or phytoplankton and excess supply of
  causes eutrophication of estuary or coast. Accumulated inorganic phosphorus in sediments moves to water column by re-suspension [10].
Phosphorus mobilization in anaerobic sediments has been shown by experimental condition. The anaerobic reaction of biodegradation or novel fermentation processes using municipal sludge release mobilized phosphorus [17,18], however, release of inorganic phosphorus is inhibited by the presence of nitrate [19]. Similar to the anaerobic process of biodegradation, incubation of river or lake sediment produces phosphate ion under anaerobic condition [15,19-21]. Thus anaerobic sediment is empirically shown that can supply mobilized phosphorus to aquatic community or riparian vegetation. Anaerobic sediment condition accompanies with the vegetation in the marsh community, however the contribution of riparian macrophyte community on the phosphorus release from the sediment is not yet fully clarified.
The objective of our research is to clarify how the riparian emergent plant communities contribute phosphorus mobilization and release in the estuary community. We compared the difference of phosphorus mobilization activity within and outside the riparian Phragmites australis (Cav.) Trin. ex Steud. community, the most dominant macrophyte species in the estuary tidal marsh community, and to evaluate the contribution of riparian macrophyte community on the phosphorus mobilization in the estuary sediment. And then we experimentally investigated the mobilization process of phosphorus by using sediments with batch reactor by controlling oxygen supply in order to test the  release process under the anoxic sediment.
2. Materials and Methods
2.1. Study Site
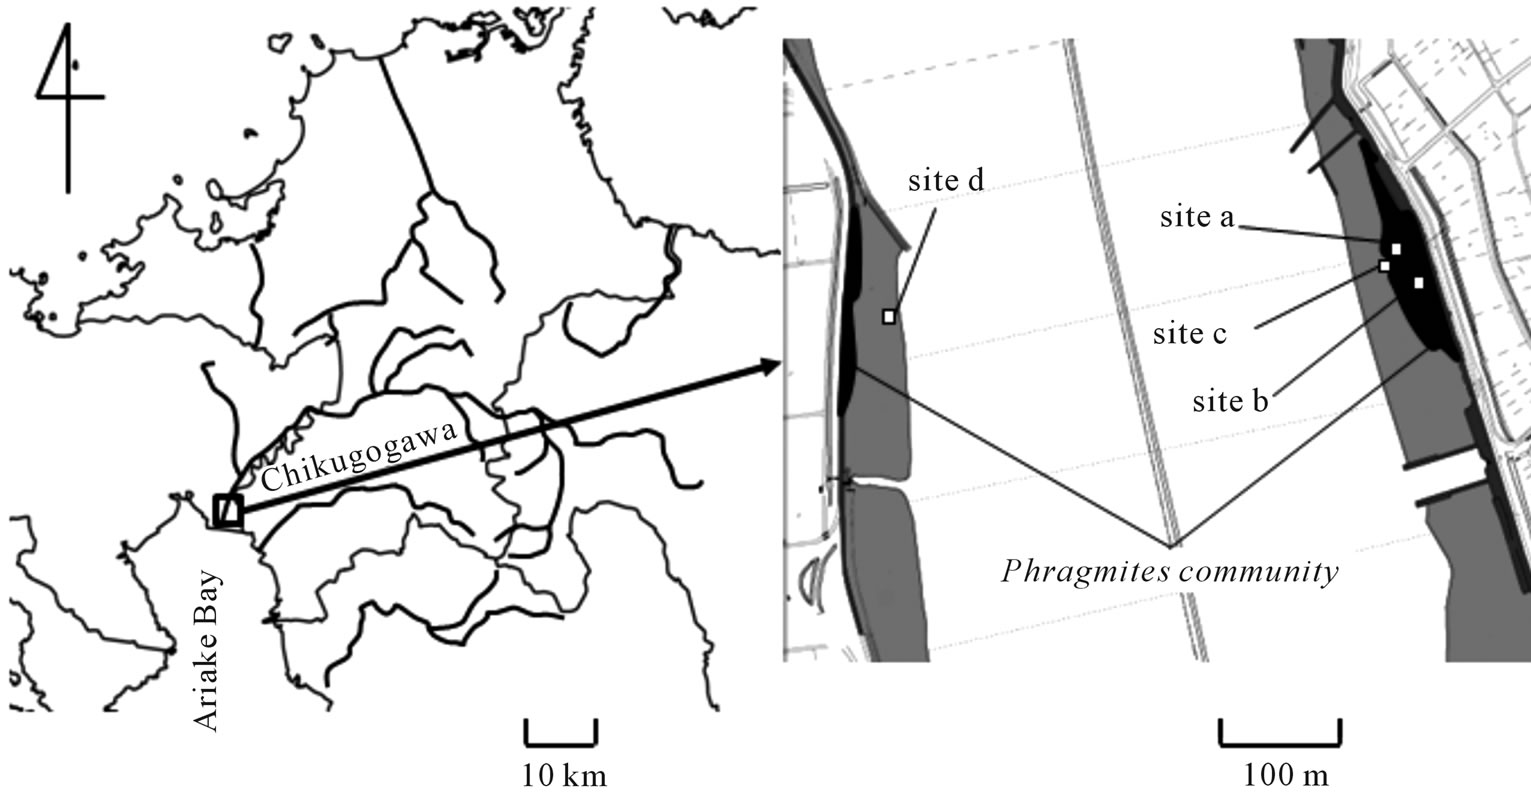
The Chikugogawa River (origin of the main stream: 33˚05'10''N, 131˚11'57''E, 1140 m a.s.l.; river mouth: 33˚05'06''N, 130˚24'37''E) is located in the north-western part of Kyushu Island (Figure 1). The total length of the main stream is 143 km, and the river basin area is 2860 km2. The largest tributary is the Kusugawa River (origin: 33˚05'55''N, 131˚15'49''E, 1256 m a.s.l.) and it connects to the main stream of the Chikugogawa River at a point 77.5 km from the river mouth. The origin of the Chikugogawa River is within the Aso-Kuju volcanic mountain area, and the land use of the middle basin of the river is predominantly paddy fields and orchards. The river then flows through an urbanized area in the lower basin of the river. Averaged annual precipitation in Bougatsuru, the uppermost basin of the Kusu River (33˚05'36.34''N, 131˚15'50.34''E; 1240 m a.s.l.), is 2724.6 mm (data from the Japan Meteorological Agency between 1971 and 2000). About 36% of the annual precipitation occurs within June and July.
Areas downstream from the floodgate of the river (Chikugo-oozeki located 24.5 km from the river mouth) are affected by sea water inundation. Annual mean temperature and averaged annual precipitation of the study site in the estuary of the Chikugogawa river (33˚08'41.10''N, 130˚21'54.29''E; 3 m a.s.l.) are 15.8˚C and 1770.5 mm, respectively (data from the Japan Meteorological Agency between 1971 and 2000). The river flow is artificially modified in the 17th centuries after the frequent flooding
 (a) (b)
Figure 1. Map showing the data sampling point and study area at the estuary of the Chikugogawa River, western Japan.
especially in the lower basin of the river. The river was short cut and river bank was constructed. The flood gate was constructed in 1985. River width and depth just downstream of the flood gate at the usual flow are 265 m and 5.1 m, respectively, and the maximum width and depth at the flooding are 435 m and 10.3 m, respectively. Averaged flow rate of the river measured just upstream of the flood gate (Senoshita) in 2008 was 101.8 m3∙s−1 and ranging the minimum of 43.8 m3∙s−1 (monthly average in November 2008) and the maximum of 382.5 m3∙s−1 (in June 2008).
Survey of sediments was made at the river mouth of the Chikugogawa river. Phragmites australis is the dominant emergent macrophyte species which makes crowded and almost monospecific community in freshwater, brackish and salt marshes between the flood gate and the river mouth. P. australis community usually establishes on the fine sand riparian sediment. In the salt marsh community, Scirpus iseensis T. Koyama et T. Shimizu makes monospecific community on the mud sediment in the river mouth.
2.2. Field Measurements and Sediment Sampling
Four sites were selected for measurements of pore water chemistry and redox potential (Eh); two sites were within and others were outside the P. australis community in the estuary at the river mouth of the Chikugogawa river (Figure 1). Sites a and b were within the P. australis community and the column density of P. australis at site b (242 m−2) was higher than site a (58 m−2). Averaged population height at sites a and b were 0.94 m and 1.24 m, respectively, and biomass (dry weight) of P. australis in sites a and b were 410 g∙m−1 and 1096 g∙m−1, respectively. Site c located in the open site without vegetation beside site a (within 5 m), and the site c sediment included senescent leaves, rhizomes and roots of P. australis. Site d was located at the opposite side of the river and was in the middle of open site without senescent plant materials in the sediment.
Redox potential (Eh) of the sediment was measured in situ with ORP meter (D-54, HORIBA). Platinum electrode with plastic tube with 100 cm long and 0.5 cm diameter equipped with Ag/AgCl reference electrode was inserted vertically to the sediment surface. Reference electrode was located in the ambient water pooled in a small cave just beside the Pt electrode. Measurements were made at 1 cm interval from the sediment surface to 20 cm depth and then at 5 cm interval to 40 - 50 cm depth. Values of Eh were read after reading was stable, although the value was not the final equilibrium value.
After the measurement of Eh, one core sample of sediment was taken just beside the Eh measurement site by using stainless steel cylinder of 50 cm length and 15 cm diameter. The cylinder was vertically inserted to the sediment and then it was withdrawn. Core sample was squeezed out from the cylinder on to the plastic sheet. Immediately after sampling, core was separated at 3 cm segments and part of each segment was stored in 50 mL centrifuge tubes.
2.3. Chemical Determination of Sediment Sample
Electric conductivity (EC) and pH of pore water in sediments were measured in situ just after sampling of sediment core with a conductivity meter (Horiba, ES-51) and a pH meter (Horiba, D-54), respectively.
In laboratory, pore water was separated from the sediments by centrifugalization (Kokusan H-30R; 2500 rpm, 15 min). The pore water sample was filtered with a glass fiber filter (Whatman GF/C) to determine chemical composition in the pore water. Concentration of  was determined by the molybdenum blue method. TotalN (TN) was determined by UV spectroscopic measurement after acid digestion. Total-P (TP) was determined by the molybdenum blue method after alkaline digestion. Total organic carbon (TOC) was measured with a TOC analyzer (Shimadzu, TOC-V).
Sediment samples after centrifugalization were air dried at 35˚C for 3 days in oven. Sample of each segment was soaked with Milli-Q water (0.5 g of air dried sediment with 100 ml of water) and removed salts. De-salted samples are air dried and then grounded by agate mortar and determined C, H, N and S contents by CHNS analyzer (Yanako; MT6). Extracted TOC in water used for salts removal and rinsing was measured and then added the carbon contents in powdered sediment measured by CHNS analyzer.
2.4. Laboratory Incubation of Sediment
We experimentally tested the mobilization process of phosphorus by using sediments with batch reactor by controlling oxygen supply. Sediments of surface (within 10 cm from the surface) were collected from vegetated site (site b) on 28 November 2008 and 16 January 2009. River water at sediment surface was also collected at the same time of the sediment sampling. Two air tight glass bottles containing 1.0 L of river water at the sediment surface and 30 g of fresh sediment were settled for 8 h and then started bubbling by nitrogen as well as air at a flow rate of 2.0 L/min. Dissolved oxygen, redox potential and  concentration of water were determined from 8 h before to 168 h after beginning of bubbling. Once measurement was made for the sample on 28 November 2008, whereas duplicate measurements were made for the sample on 16 January 2009.
3. Results and Discussion
Redox potential (Eh) of sediment (Figure 2(a)) decreased from the surface to the lower horizon at vegetated sites (sites a and b) and non vegetated site including plants debris (site c). Eh gradient from the surface to 6 cm depth horizon at site c (−201 mV at 6 cm depth) is higher than that of sites a and b (42 mV and 74 mV at 6 cm depth, respectively). Higher Eh at vegetated sites of top 6 cm horizon was due to the oxygen transport to the sediment by aerenchyma of Phragmites plants, whereas non vegetated sediment showed anoxic condition even at the top horizon. Column density of P. australis at site b was higher than site a, and then Eh at the surface horizon (within 6 cm from the surface) at site b was slightly higher than site a.
Non vegetated site without plants debris (site d), showed lower Eh at the surface (72 mV) compared as Eh of the vegetated sites, however the Eh gradient in sediment was smaller than sites a, b and c. Eh at site d at 40 cm depth layer was −4 mV, whereas Eh at 40 cm depth was −170 - −350 mV at sites a, b and c. Oxygen at the deeper part of sediment was consumed up by aerobic bacteria that would be abundant under the high amount of decomposable organic matter supplied by vegetation and plant debris.
 concentration of sediment pore water (Figure 2(b)) at lower part of sediment (20 - 40 cm from the surface) was higher than the surface layer, and the
  concentration at sites a and c (vegetated sites) was much higher than site d (non-vegetated site without plant debris). Higher
  concentration at the lower sediment horizon corresponded to lower Eh of sediment. Eh of sediment showed significant negative correlation with pore water
  (Table 1). Lukkari et al. [22] demonstrated that
  concentration in sediment pore water increases with decreasing Eh and increasing total-C in sediment, although our data showed negative correlation between sediment-C and pore water
  concentration. Phosphorus produces water-insoluble salts with Fe, Al or Ca under the aerobic condition and phosphorus is mobilized under anaerobic condition. High concentration of
  under the low Eh sediment was due to the mobilization of phosphorus under the anoxic condition. Sediment lower than 20 cm layer at sites a and c consists of heavy clay, and then the mobilized inorganic phosphorus would accumulate because of the low permeability of water at the lower part of the sediment. Relatively low
  concentration at lower part of site b as well as relatively higher Eh at the horizon was partly due to the absorption of
  by P. australis and the oxygen supply by the roots of the plant.
Non vegetated site without plant debris (site d) showed lower  concentration at the lower part of the sediment because of the low mobilization rate under the high Eh. Slightly mobilized phosphorus would be kept in the sediment without absorption by plants as well as low diffusion rate in the heavy clay layer.
Elements concentrations in dry sediment are presented in Figure 3. Carbon concentration in sediment showed decreasing tendency from the surface to the lower horizon at every site (Figure 3(a)). Carbon concentration at site d (non-vegetated site without plant debris) showed lowest value especially horizon lower than 20 cm. This implies that relatively small accumulation of organic carbon in site d.
Hydrogen concentration in sediment showed minimum at 10 cm horizon at sites b and d, and at 17 cm horizon at sites a and c (Figure 3(b)). Higher concentration of hydrogen corresponds to higher concentration of carbon implying carbon and hydrogen accumulated as decomposable organic materials in the top layer within 10 cm from the surface. Relatively higher concentration of hydrogen lower than 20 cm depth did not correspond to carbon, and then the hydrogen in the lower horizon was

Table 1. Correlation between chemical parameters of sediment and pore water of sediment in the estuary of the Chikugogawa River, western Japan. Spearmen’s coefficients and significance levels are shown. Significance level; ***: p < 0.001, **: p < 0.01, *: p < 0.05, NS: not significant.
 (a) (b)
Figure 2. Redox potential (Eh) and  concentration of pore water in the sediment at the estuary of the Chikugogawa River, western Japan. (a) Eh-Depth; (b)
  -Depth.

Figure 3. Carbon, hydrogen, nitrogen and sulfur contents in the sediment at the estuary of the Chikugogawa River, western Japan. (a) C-Depth; (b) H-Depth; (c) N-Depth; (d) S-Depth.
in the inorganic form.
Nitrogen concentration in sediment decreased from the surface to the lower horizon except for site a, although the difference of concentration within 40 cm layer was small (0.1 - 0.2 w/w %; Figure 3(c)). Vertical profile of nitrogen concentration in site a showed maximum (0.9 w/w %) at 4 - 10 cm layer from the surface and the N concentration in the surface was higher than the horizon lower than 15 cm. Nitrogen accumulate in the surface layer, however the accumulation was not clear as C or H. Beutel et al. [20] demonstrated by incubation experiment that  is mobilized under the anoxic condition, whereas
  as well as
  are released under the oxic condition. Thus phosphorus release from the sediment is limited under the condition of high concentration of inorganic nitrogen in water [19,21].
Sulfur was detected lower than 20 cm horizon at site c, lower than 25 cm horizon at site a and at 38 cm depth at site b (Figure 3(d)). Sulfur was not detected from the surface to the 38 cm layer at site d. Sulfur accumulation in sediment corresponds to anoxicity of sediment. Eh of the sediment at sites a and c showed lower than −200 mV at lower horizon than 25 cm depth. Eh at site d was ca. 0 mV at 40 cm depth, and sulfur accumulation was not observed at site d. Sulfate reduction in the organic matter rich river sediment is reported by Watanabe and Tsunogai [23] or Barbanti et al. [14].
Correlations between carbon and hydrogen, as well as hydrogen and nitrogen in sediment were significantly positive, whereas correlation between nitrogen and sulfur was significantly negative (Table 1). Sediment nitrogen concentration showed significant positive correlation with Eh and negative correlation with pore water , whereas sediment sulfur showed significant negative correlation with Eh and positive correlation with
  (Table 1). Thus
  accumulation in sediment pore water accompany with sulfur accumulation in sediment and with nitrogen depression in sediment. This observation corresponds with the findings by Baldwin and Williams [7]. Pore water TOC did not show significant correlation with Eh, pore water
 , and elements (C, H, N, S) in sediment.
 accumulation in sediment pore water was observed at Eh < −100 mV (Figure 4(a)). Nitrogen in sediment was also the determining factor of
  accumulation in sediment pore water, and
  was observed only at nitrogen concentration in sediment <0.5 (w/w %; Figure 4(b)). Sulfur was not the direct determining factor of
  accumulation in sediment pore water, however higher concentration of
  in sediment pore water mostly accompany with higher concentration of sulfur than 0.6 (w/w %; Figure 4(c)). Carbon in sediment was not the determining factor of
  accumulation in sediment pore water, however
  in sediment pore water tended to be lower with increasing carbon concentration in sediment (Figure 4(d)).
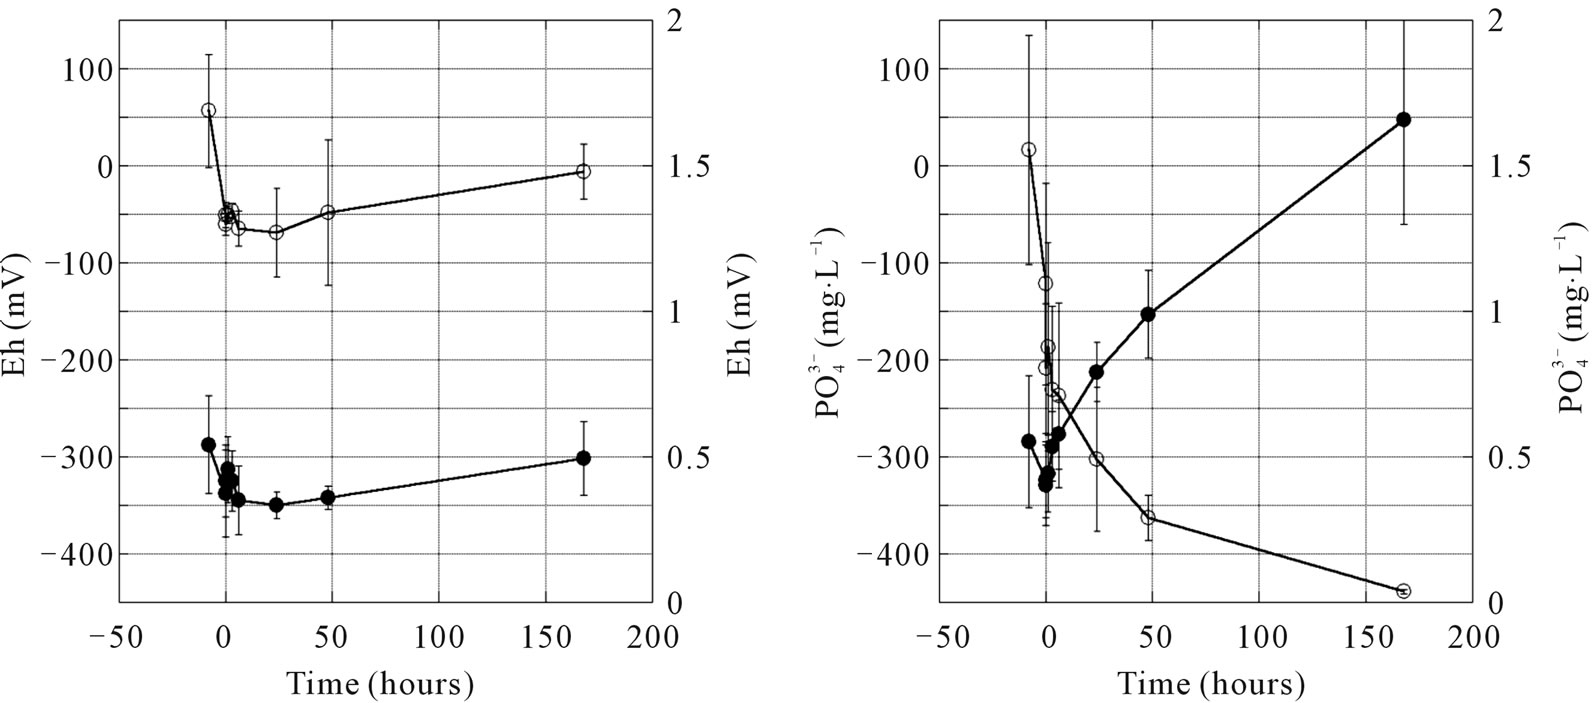
Laboratory incubation of estuary sediment showed  release from the sediment proceeds only under the oxygen deficit condition accompanying with lower Eh than −250 mV (Figure 5(a)). Under the condition of air supply to the sediment containing medium, Eh of the medium decreased to −60 mV just after the incubation and Eh slightly increased to 0 mV.
  concentration in medium was <0.5 mg∙L−1. Under the condition of nitrogen supply to the sediment containing medium, Eh decreased after the beginning of incubation and Eh reached −450 mV after 170 h of incubation (Figure 5(b)).
  concentration increased just after the beginning of incubation corresponding to Eh decrease and
  concentration reached 1.7 mg∙L−1. The same process was demonstrated by Wang et al. [24], and Christophoridis and Fytianes [25] showed that phosphorus release appeared at Eh < 100 mV and the release proceeds much higher Eh in the eutrophic lake with high organic matter concentration.
The proposed process of  release from the sediment of the estuary P. australis community is as follows. P. australis supply organic litter to the sediment and the sediment with vegetation (or supply of litter) becomes anoxic due to the oxygen consumption by aerobic microorganisms in sediment.
  inflows from sea water because of the inundation of sea water to the estuary community [26].
  is reduced in the anoxic horizon of sediment and then S2− is isolated. Phosphorus migrates in the river water from the agricultural filed (e.g. paddy field) in the basin and forms water insoluble salts e.g. Fe3(PO4)2 or AlPO4 and Fe2S3 or Al2S3. These salts are transferred by river flow and precipitate on the estuary sediment by decreasing water flow rate as well as increasing salinity at the estuary. Lai and Lam [15] showed that more than 50% of the phosphorus among total sediment P is inorganic form and the dominant component of inorganic P is redox-sensitive P that combined with Fe. Surridge et al. [21] clarified that Fe combined P is the main source of
  released from the reduced sediment. Sun et al. [27] also showed that loosely sorbed-P and Fe bounded P in the reduced sediment release
 , whereas Ca-P and Al-P are not reactive under the reduced condition. Jordan et al. [28] showed that the dominant particulate inorganic P compound in sediment is P combined with iron oxide and the contents in sediment decreases with increasing salinity. Sulfide increases with increasing salinity and Fe reacts with sulfide by exchanging and releasing P from Fe-P. S2− reacts with waterinsoluble phosphorus salts precipitated in the estuary sediment and
  is released combined with precipita-

Figure 4. Correlation between (a)  concentration and Eh of pore water in the sediment; (b)
  concentration of pore water and carbon contents in the sediment; (c)
  concentration of pore water and nitrogen contents in the sediment; and (d)
  concentration of pore water and sulfur contents in the sediment in the sediment at the estuary of the Chikugogawa River, western Japan. (a)
  -Eh; (b)
  -C; (c)
  -N; (d)
  -S.
-S.
 (a) (b)
Figure 5. Changes in Eh and concentration of  in the incubation medium under (a) air supplying and (b) nitrogen supplying condition by using sediment from the estuary of the Chikugogawa River, western Japan. (a) Air bubling; (b) N2 bubling.
tion of water insoluble sulfur compound e.g. FeS. Barbanti et al. [14] demonstrated that Fe concentration in sediment pore water is higher in the surface sediment compared as lower part of sediment with high concentration of , implying the precipitation of Fe under the reduced sediment horizon by producing water-insoluble salts with sulfur. Thus
  is mobilized and released under anoxic sediments and then
  is partly absorbed by P. australis roots and by phytoplankton in the river water column.
In this study we found that P. australis in the estuary of river contributes actually the mobilization of  and the consequent P supply to aquatic communities. Wetland community has also accumulating phosphorus in sediments [29], and then the wetland community can be the buffering zone of phosphorus dynamics that connect terrestrial and aquatic systems. Many researched clarified that the soil chemical environment in the Phragmites community is significantly different from the soil chemical condition in other aquatic macrophytes e.g. Typha, Lythrum, Spartina, Distichlis or Juncus [30-32]. Role of Phragmites community in the estuary systems on nutrient dynamics should be investigated including species difference as well as salt tolerance of the species.
4. Acknowledgements
Authors thank to the member of the University of Kitakyushu for their assistance in field study. This study was partly funded by the Seven-Eleven Midorinokikin Fund, JSPS Grant-in-Aid for Scientific Research 18208019 & 20248033, and the River Fund in charge of the Foundation of River and Watershed Environment Management, Japan. We declare that the investigation comply with the current laws of Japan.
REFERENCES
- M. Laukkanen, P. Ekholm, A. Huhtala, H. Pitkänen, M. Kiirikki, P. Rantanen and A. Inkala, “Integrating Ecological and Economic Modeling of Eutrophication: Toward Optimal Solutions for a Coastal Area Suffering from Sediment Release of Phosphorus,” Ambio, Vol. 38, No. 4, 2009, pp. 225-235. doi:10.1579/0044-7447-38.4.225
- C. S. Hopkinson Jr., A. E. Giblin, J. Tucker and R. H. Garritt, “Benthic Metabolism and Nutrient Cycling along an Estuarine Salinity Gradient,” Estuaries, Vol. 22, No. 4, 1999, pp. 863-881. doi:10.2307/1353067
- S. Hietanen and K. Lukkari, “Effects of Short-Term Anoxia on Benthic Denitrification, Nutrient Fluxes and Phosphorus Forms in Coastal Baltic Sediment,” Aquatic Microbial Ecology, Vol. 49, No. 3, 2007, pp. 293-302. doi:10.3354/ame01146
- P. Anschutz, G. Chaillou and P. Lecroart, “Phosphorus Diagenesis in Sediment of the Thau Lagoon,” Estuarine, Coastal and Shelf Science, Vol. 72, No. 3, 2007, pp. 447- 456. doi:10.1016/j.ecss.2006.11.012
- B. E. Haggard and T. S. Soerens, “Sediment Phosphorus Release at a Small Impoundment on the Illinois River, Arkansas and Oklahoma, USA,” Ecological Engineering, Vol. 28, No. 3, 2006, pp. 280-287. doi:10.1016/j.ecoleng.2006.07.013
- B. A. Lake, K. M. Coolidge, S. A. Norton and A. Amirbahman, “Factors Contributing to the Internal Loading of Phosphorus from Anoxic Sediments in Six Maine, USA, Lakes,” Science of the Total Environment, Vol. 373, No. 2-3, 2007, pp. 534-541. doi:10.1016/j.scitotenv.2006.12.021
- D. S. Baldwin and J. Williams, “Differential Release of Nitrogen and Phosphorus from Anoxic Sediments,” Chemistry and Ecology, Vol. 23, No. 3, 2007, pp. 243- 249. doi:10.1080/02757540701339364
- X. Jiang, X. Jin, Y. Yao, L. Li and F. Wu, “Effects of Biological Activity, Light, Temperature and Oxygen on Phosphorus Release Processes at the Sediment and Water Interface of Taihu Lake, China,” Water Research, Vol. 42, No. 8-9, 2008, pp. 2251-2259. doi:10.1016/j.watres.2007.12.003
- A. Kleeberg, M. Hupfer and G. Gust, “Quantification of Phosphorus Entrainment in a Lowland River by in Situ and Laboratory Resuspension Experiments,” Aquatic Sciences, Vol. 70, No. 1, 2008, pp. 87-99. doi:10.1007/s00027-007-0935-9
- B. You, J. Zhong, C. Fan, T. Wang, L. Zhang and S. Ding, “Effects of Hydrodynamics Processes on Phosphorus Fluxes from Sediment in Large, Shallow Taihu Lake,” Journal of Environmental Sciences, Vol. 19, No. 9, 2007, pp. 1055-1060. doi:10.1016/S1001-0742(07)60172-7
- P. Banaszuk and A. Wysocka-Czubaszek, “Phosphorus Dynamics and Fluxes in a Lowland River: The Narew Anastomosing River Syetem, NE Poland,” Ecological Engineering, Vol. 25, No. 4, 2005, pp. 429-441. doi:10.1016/j.ecoleng.2005.06.013
- D. Y. F. Lai and K. C. Lam, “Phosphorus Sorption by Sediments in a Subtropical Constructed Wetland Receiving Stormwater Runoff,” Ecological Engineering, Vol. 35, No. 5, 2009, pp. 735-743. doi:10.1016/j.ecoleng.2008.11.009
- K. C. Stone, M. E. Poach, P. G. Hunt and G. B. Reddy, “Marsh-Pond-Marsh Constructed Wetland Design Analysis for Swine Lagoon Wastewater Treatment,” Ecological Engineering, Vol. 23, No. 2, 2004, pp. 127-133. doi:10.1016/j.ecoleng.2004.07.008
- A. Barbanti, V. U. Ceccherelli, F. Frascari, G. Reggiani and G. Rosso, “Nutrient Regeneration Processes in Bottom Sediments in a Po Delta Lagoon (Italy) and the Role of Bioturbation in Determining the Fluxes at the Sediment-Water Interface,” Hydrobiologia, Vol. 228, No. 1, 1991, pp. 1-21. doi:10.1007/BF00006471
- D. Y. F. Lai and K. C. Lam, “Phosphorus Retention and Release by Sediments in the Eutrophic Mai Po Marshes, Hong Kong,” Marine Pollution Bulletin, Vol. 57, No. 6- 12, 2008, pp. 349-356. doi:10.1016/j.marpolbul.2008.01.038
- P. Monbet, I. D. McKelvie and P. J. Worsfold, “Combined Gel Probes for the in Situ Determination of Dissolved Reactive Phosphorus in Porewaters and Characterization of Sediment Reactivity,” Environmental Science and Technology, Vol. 42, No. 14, 2008, pp. 5112- 5117. doi:10.1021/es8001663
- Y. H. Ahn and R. E. Speece, “Elutriated Acid Fermentation of Municipal Primary Sludge,” Water Research, Vol. 40, No. 11, 2006, pp. 2210-2220. doi:10.1016/j.watres.2006.03.022
- P. Kampas, S. A. Parsons, P. Pearce, S. Ledoux, P. Vale, E. Cartmell and A. Soares, “An Internal Carbon Source for Improving Biological Nutrient Removal,” Bioresource Technology, Vol. 100, No. 1, 2009, pp. 149-154. doi:10.1016/j.biortech.2008.05.023
- Q. Wu, R. Zhang, S. Huang and H. Zhang, “Effects of Bacteria on Nitrogen and Phosphorus Release from River Sediment,” Journal of Environmental Sciences, Vol. 20, No. 4, 2008, pp. 404-412. doi:10.1016/S1001-0742(08)62071-9
- M. W. Beutel, T. M. Leonard, S. R. Dent and B. C. Moore, “Effects of Aerobic And Anaerobic Conditions on P, N, Fe, Mn and Hg Accumulation in Waters Overlaying Profundal Sediments of an Oligo-Mesotrophic Lake,” Water Research, Vol. 42, No. 8-9, 2008, pp. 1953-1962. doi:10.1016/j.watres.2007.11.027
- B. W. J. Surridge, A. L. Heathwaite and A. J. Baird, “The Release of Phosphorus to Porewater and Surface Water from River Riparian Sediments,” Journal of Environmental Quality, Vol. 36, No. 5, 2007, pp. 1534-1544. doi:10.2134/jeq2006.0490
- K. Lukkari, M. Leivuori and H. Hartikainen, “Vertical Distribution and Chemical Character of Sediment Phosphorus in Two Shallow Estuaries in the Baltic Sea,” Biogeochemistry, Vol. 90, No. 2, 2008, pp. 171-191. doi:10.1007/s10533-008-9243-2
- Y. Watanabe and S. Tsunogai, “Adsorption-Desorption Control of Phosphate in Anoxic Sediment of a Coastal Sea, Funka Bay, Japan,” Marine Chemistry, Vol. 15, No. 1, 1984, pp. 71-83. doi:10.1016/0304-4203(84)90039-2
- S. Wang, X. Jin, Q. Bu, L. Jiao and F. Wu, “Effects of Dissolved Oxygen Supply Level on Phosphorus Release from Lake Sediments,” Colloids and Surface A, Vol. 316, No. 1-3, 2008, pp. 245-252. doi:10.1016/j.colsurfa.2007.09.007
- C. Christophoridis and K. Fytianos, “Conditions Affecting the Release of Phosphorus from Surface Lake Sediments,” Journal of Environmental Quality, Vol. 35, No. 4, 2006, pp. 1181-1192. doi:10.2134/jeq2005.0213
- A. Haraguchi, “Effect of Sulfuric Acid Discharge on River Water Chemistry in Peat Swamp Forests in Central Kalimantan, Indonesia,” Limnology, Vol. 8, No. 2, 2007, pp. 175-182. doi:10.1007/s10201-007-0206-4
- S. Sun, S. Huang, X. Sun and W. Wen, “Phosphorus Fractions and Its Release in the Sediments of Haihe River, China,” Journal of Environmental Sciences, Vol. 21, No. 3, 2009, pp. 291-295. doi:10.1016/S1001-0742(08)62266-4
- T. E. Jordan, J. C. Cornwell, W. R. Boynton and J. T. Anderson, “Changes in Phosphorus Biogeochemistry along an Estuarine Salinity Gradient: The Iron Conveyer Belt,” Limnology and Oceanography, Vol. 53, No. 1, 2008, pp. 172-184. doi:10.4319/lo.2008.53.1.0172
- E. J. Dunne, R. Reddy and M. W. Clark, “Biogeochemical Indices of Phosphorus Retention and Release by Wetland Soils and Adjacent Stream Sediments,” Wetlands, Vol. 26, No. 4, 2006, pp. 1026-1041. doi:10.1672/0277-5212(2006)26[1026:BIOPRA]2.0.CO;2
- R. M. Chambers, “Porewater Chemistry Associated with Phragmites and Spartina in a Connecticut Tidal Marsh,” Wetlands, Vol. 17, No. 3, 1997, pp. 360-367. doi:10.1007/BF03161425
- P. Templer, S. Findlay and C. Wigand, “Sediment Chemistry Associated with Native and Non-Native Emergent Macrophytes of a Hudson River Marsh Ecosystem,” Wetlands, Vol. 18, No. 1, 1998, pp. 70-78. doi:10.1007/BF03161444
- L. Windham and R. G. Lathrop Jr., “Effects of Phragmites australis (Common Reed) Invasion on Aboveground Biomass and Soil Properties in Brackish Tidal Marsh of the Mullica River, New Jersey,” Estuaries and Coasts, Vol. 22, No. 4, 1999, pp. 927-935. doi:10.2307/1353072