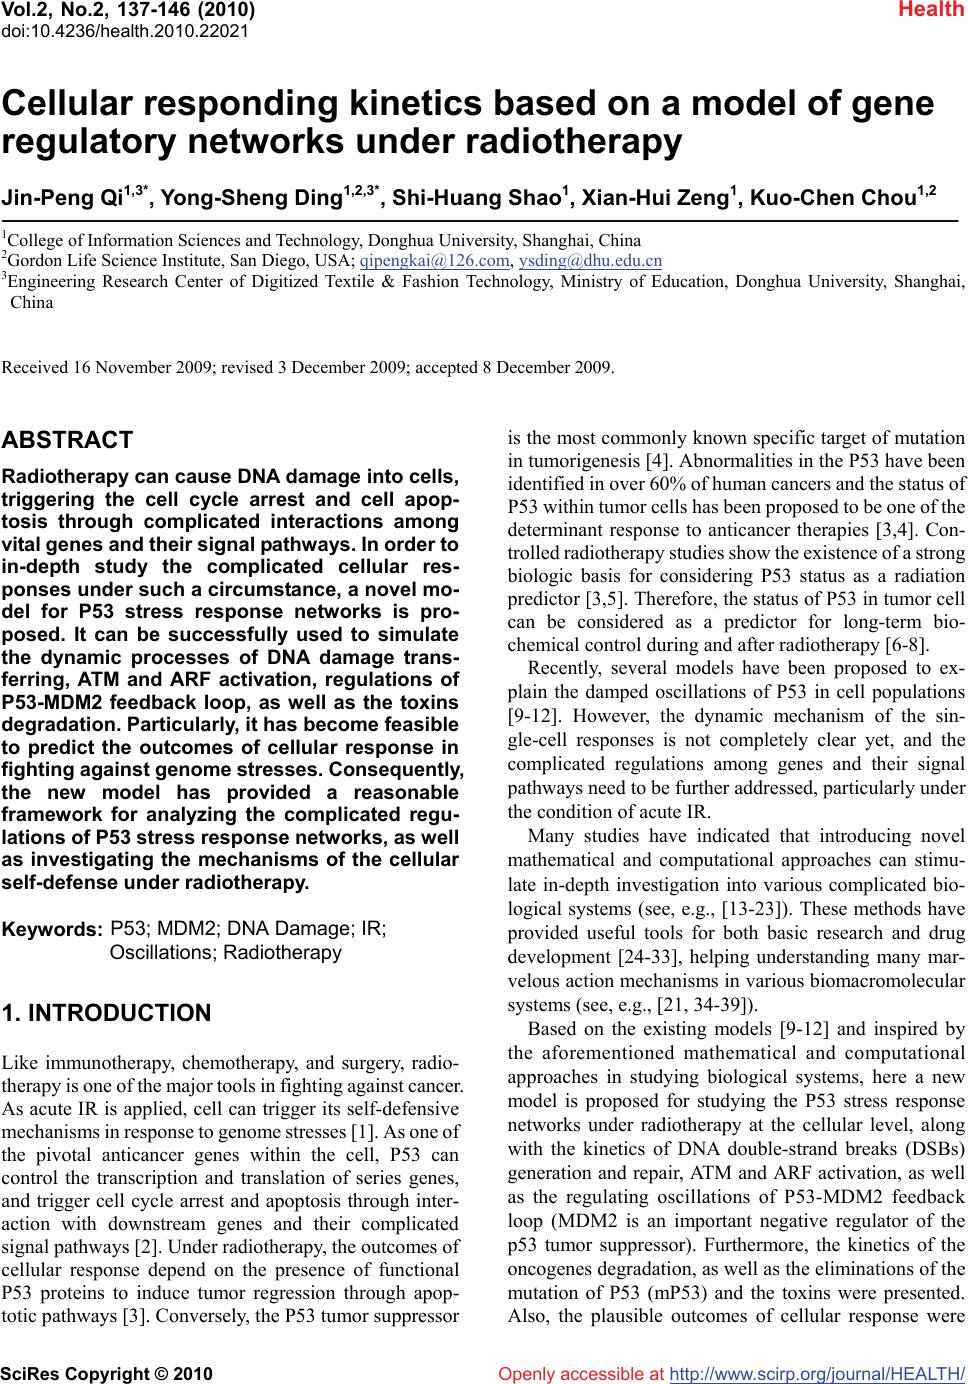
 Vol.2, No.2, 137-146 (2010) doi:10.4236/health.2010.22021 SciRes Copyright © 2010 Openly accessible at http://www.scirp.org/journal/HEALTH/ Health Cellular responding kinetics based on a model of gene regulatory networks under radiotherapy Jin-Peng Qi1,3*, Yong-Sheng Ding1,2,3*, Shi-Huang Shao1, Xian-Hui Zeng1, Kuo-Chen Chou1,2 1College of Information Sciences and Technology, Donghua University, Shanghai, China 2Gordon Life Science Institute, San Diego, USA; qipengkai@126.com, ysding@dhu.edu.cn 3Engineering Research Center of Digitized Textile & Fashion Technology, Ministry of Education, Donghua University, Shanghai, China Received 16 November 2009; revised 3 December 2009; accepted 8 December 2009. ABSTRACT Radiotherapy can cause DNA damage into cells, triggering the cell cycle arrest and cell apop- tosis through complicated interactions among vital genes and their signal pathways. In order to in-depth study the complicated cellular res- ponses under such a circumstance, a novel mo- del for P53 stress response networks is pro- posed. It can be successfully used to simulate the dynamic processes of DNA damage trans- ferring, ATM and ARF activation, regulations of P53-MDM2 feedback loop, as well as the toxins degradation. Particularly, it has become feasible to predict the outcomes of cellular response in fighting against genome stresses. Consequently, the new model has provided a reasonable framework for analyzing the complicated regu- lations of P53 stress response networks, as well as investigating the mechanisms of the cellular self-defense under radiotherapy. Keywords: P53; MDM2; DNA Damage; IR; Oscillations; Radiotherapy 1. INTRODUCTION Like immunotherapy, chemotherapy, and surgery, radio- therapy is one of the major tools in fighting against cancer. As acute IR is applied, cell can trigger its self-defensive mechanisms in response to genome stresses [1]. As one of the pivotal anticancer genes within the cell, P53 can control the transcription and translation of series genes, and trigger cell cycle arrest and apoptosis through inter- action with downstream genes and their complicated signal pathways [2]. Under radiotherapy, the outcomes of cellular response depend on the presence of functional P53 proteins to induce tumor regression through apop- totic pathways [3]. Conversely, the P53 tumor suppressor is the most commonly known specific target of mutation in tumorigenesis [4]. Abnormalities in the P53 have been identified in over 60% of human cancers and the status of P53 within tumor cells has been proposed to be one of the determinant response to anticancer therapies [3,4]. Con- trolled radiotherapy studies show the existence of a strong biologic basis for considering P53 status as a radiation predictor [3,5]. Therefore, the status of P53 in tumor cell can be considered as a predictor for long-term bio- chemical control during and after radiotherapy [6-8]. Recently, several models have been proposed to ex- plain the damped oscillations of P53 in cell populations [9-12]. However, the dynamic mechanism of the sin- gle-cell responses is not completely clear yet, and the complicated regulations among genes and their signal pathways need to be further addressed, particularly under the condition of acute IR. Many studies have indicated that introducing novel mathematical and computational approaches can stimu- late in-depth investigation into various complicated bio- logical systems (see, e.g., [13-23]). These methods have provided useful tools for both basic research and drug development [24-33], helping understanding many mar- velous action mechanisms in various biomacromolecular systems (see, e.g., [21, 34-39]). Based on the existing models [9-12] and inspired by the aforementioned mathematical and computational approaches in studying biological systems, here a new model is proposed for studying the P53 stress response networks under radiotherapy at the cellular level, along with the kinetics of DNA double-strand breaks (DSBs) generation and repair, ATM and ARF activation, as well as the regulating oscillations of P53-MDM2 feedback loop (MDM2 is an important negative regulator of the p53 tumor suppressor). Furthermore, the kinetics of the oncogenes degradation, as well as the eliminations of the mutation of P53 (mP53) and the toxins were presented. Also, the plausible outcomes of cellular response were 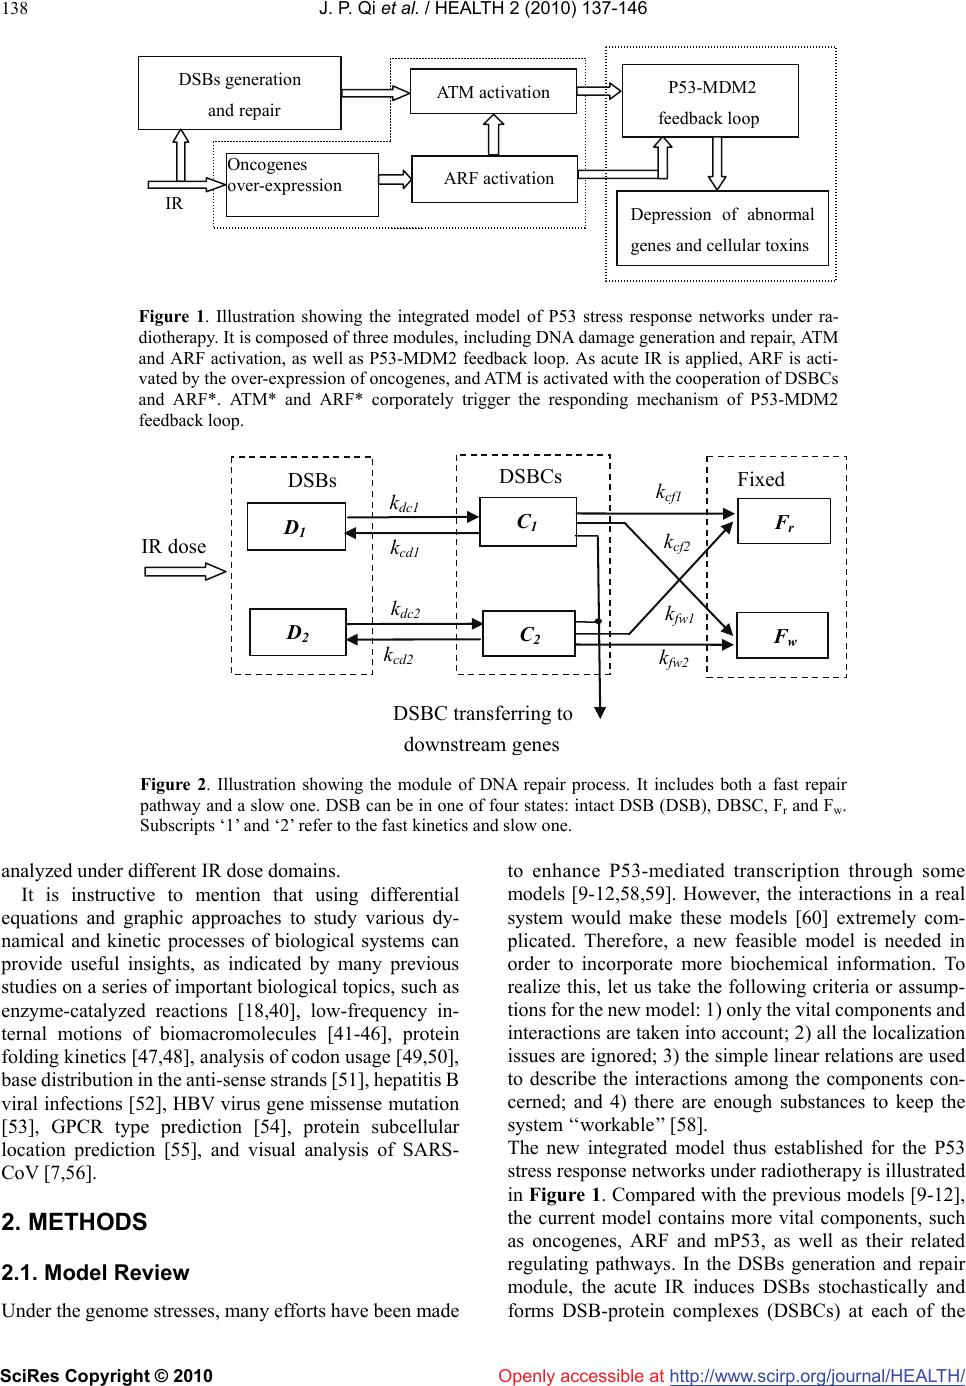 J. P. Qi et al. / HEALTH 2 (2010) 137-146 SciRes Copyright © 2010 http://www.scirp.org/journal/HEALTH/ 138 Openly accessible at DSBs generation and repair ATM activation IR P53-MDM2 feedback loop Oncogenes over-expression ARF activation Depression of abnormal genes and cellular toxins Figure 1. Illustration showing the integrated model of P53 stress response networks under ra- diotherapy. It is composed of three modules, including DNA damage generation and repair, ATM and ARF activation, as well as P53-MDM2 feedback loop. As acute IR is applied, ARF is acti- vated by the over-expression of oncogenes, and ATM is activated with the cooperation of DSBCs and ARF*. ATM* and ARF* corporately trigger the responding mechanism of P53-MDM2 feedback loop. D 1 k dc1 k dc2 k cf2 k fw1 k fw2 k cd1 k cd2 DSBs Fixed D 2 C 1 C 2 F r F w DSBCs k cf1 IR dose DSBC transferring to downstream enes Figure 2. Illustration showing the module of DNA repair process. It includes both a fast repair pathway and a slow one. DSB can be in one of four states: intact DSB (DSB), DBSC, Fr and Fw. Subscripts ‘1’ and ‘2’ refer to the fast kinetics and slow one. analyzed under different IR dose domains. It is instructive to mention that using differential equations and graphic approaches to study various dy- namical and kinetic processes of biological systems can provide useful insights, as indicated by many previous studies on a series of important biological topics, such as enzyme-catalyzed reactions [18,40], low-frequency in- ternal motions of biomacromolecules [41-46], protein folding kinetics [47,48], analysis of codon usage [49,50], base distribution in the anti-sense strands [51], hepatitis B viral infections [52], HBV virus gene missense mutation [53], GPCR type prediction [54], protein subcellular location prediction [55], and visual analysis of SARS- CoV [7,56]. 2. METHODS 2.1. Model Review Under the genome stresses, many efforts have been made to enhance P53-mediated transcription through some models [9-12,58,59]. However, the interactions in a real system would make these models [60] extremely com- plicated. Therefore, a new feasible model is needed in order to incorporate more biochemical information. To realize this, let us take the following criteria or assump- tions for the new model: 1) only the vital components and interactions are taken into account; 2) all the localization issues are ignored; 3) the simple linear relations are used to describe the interactions among the components con- cerned; and 4) there are enough substances to keep the system ‘‘workable’’ [58]. The new integrated model thus established for the P53 stress response networks under radiotherapy is illustrated in Figure 1. Compared with the previous models [9-12], the current model contains more vital components, such as oncogenes, ARF and mP53, as well as their related regulating pathways. In the DSBs generation and repair module, the acute IR induces DSBs stochastically and forms DSB-protein complexes (DSBCs) at each of the  J. P. Qi et al. / HEALTH 2 (2010) 137-146 SciRes Copyright © 2010 http://www.scirp.org/journal/HEALTH/Openly accessible at 139 damage sites after interacting with the DNA repair pro- teins [2,3]. As a sensor of genome stress, ATM is acti- vated by the DSBCs signal transferred from DSBs. Meanwhile, the over-expression of oncogenes prompted by acute IR can trigger the activation of ARF, further prompting the ATM activation [2,7]. The cooperating effects of active ATM (ATM*) and active ARF (ARF*) switch on or off the P53-MDM2 feedback loop [2,7,9], further regulating the downstream genes to control the cell-cycle arrest and the cell apoptosis in response to genome stresses [8]. Here, we use the superscript * to represent the activate state as done in [61]. 2.2. DSBs Generation and Repair Under the continuous effect of acute IR dose, DSBs occur and trigger two major repair mechanisms in eukaryotic cells: homologous recombination (HR) and nonhomolo- gous end joining (NHEJ) [62,63]. About 60-80% of DSBs are rejoined quickly, whereas the remaining 20-40% of DSBs are rejoined more slowly [64,65]. As shown in Figure 2, the module of DSBs generation and repair process contains both the fast and slow kinetics, with each being composed of a reversible binding of repair proteins and DSB lesions into DSBCs, and an irreversible process from the DSBCs to the fixed DSBs [62,65]. DSBCs are synthesized by binding the resulting DSBs with repair proteins (RP), which is the main signal source to transfer the DNA damage to P53-MDM2 feedback loop by ATM activation [2]. Due to the misrepair part of DSBs (Fw) having the profound consequences on the subsequent cellular vi- ability and the cellular response in fighting against ge- nome stresses [1,3], we obviously distinguish between correct repair part of DSBs (Fr) and Fw [9,10,12]. Moreover, we further deal the total Fw in both repair processes as a part of toxins within the cell [2,4,11], which can be eliminated by the regulatory functions of P53 during and after radiotherapy, and treated as an in- dicator of outcomes in cellular response to genome stresses [2]. Some experimental data suggest that the quantity of the resulting DSBs within different IR dose domains obey a Poisson distribution [11]. In accordance with the ex- periments, we assume that the stochastic number of the resulting DSBs per time scale is proportional to the number generated by a Poisson random function during the period of acute radiation [11]. The DSBs generation process is formulated as follows: [DT] Poissrnd( IR) tir dka dt (1) where [DT] is the concentration of total resulting DSBs induced by IR in both fast and slow repair processes. kt is the parameter to set the number of DSBs per time scale, and air is the parameter to set the number of DSBs per IR dose. Moreover, we assume that the limited repair proteins are available around DSBs sites, and 70% of the initial DSBs are fixed by the fast repair process. Each DSB can be in one of the four states: intact DSB, DSBC, Fr and Fw [9,10,12]. Thus, we have the following differential equa- tions: 1 11 [D ][D ][C ] tcd dak dt 1 dc1 1cross12 [RP]([D ]([D ][D]))kk (2) 2 2t cd22 [D ][D ][C] dak dt dc2 2cross12 [RP]([D ]([D][D])kk (3) 1 dc11 cd11 cf11 [C ][D ][C ][C ] dkkk dt (4) 2 dc2 2cd22cf22 [] [D ][C ][C ] dC kkk dt (5) pcd1 1cd22 [RP] [C ][C] r dSk k dt dc1 1dc22cross12 [RP]([D][D]([D ][D]))kk k (6) w w1 1fw22 [F ][C ][C] f dkk dt (7) where [D], [C], and [Fw] represent the concentrations of DSBs, DSBCs, and Fw in the fast and the slow repair kinetics respectively, kdc, kcd, kcf, and kfw are the tran- sition rates among the above three states; kdc, and kcross represent the first-order and second-order rate constants in both the fast and the slow repair kinetics respectively [65]. Srp is the basal induction rate of repair mRNA, and sub- scripts ‘1’ and ‘2’ refer to the fast and the slow kinetics. 2.3. ATM and ARF Activation As a DNA damage detector, ATM exists as a dimer in unstressed cells. After IR is applied, intermolecular autophosphorylation occurs, causing the dimer to disso- ciate rapidly into the active monomers. The active ATM monomer (ATM*) can prompt the P53 expression further [64]. Meanwhile, ARF, another tumor suppressor, is ac- tivated by hyperproliferative signals emanating from oncogenes, such as Ras, c-myc etc., further prompting the ATM activation [2, 7, 10]. Based on the existing model of ATM switch [11], we present an ATM and ARF activation module under IR. Shown in Figure 3 is the module scheme of ATM and ARF activation, which includes five components: ATM dimer, inactive ATM monomer, ATM*, ARF, and ARF*. Compared with the previous studies in 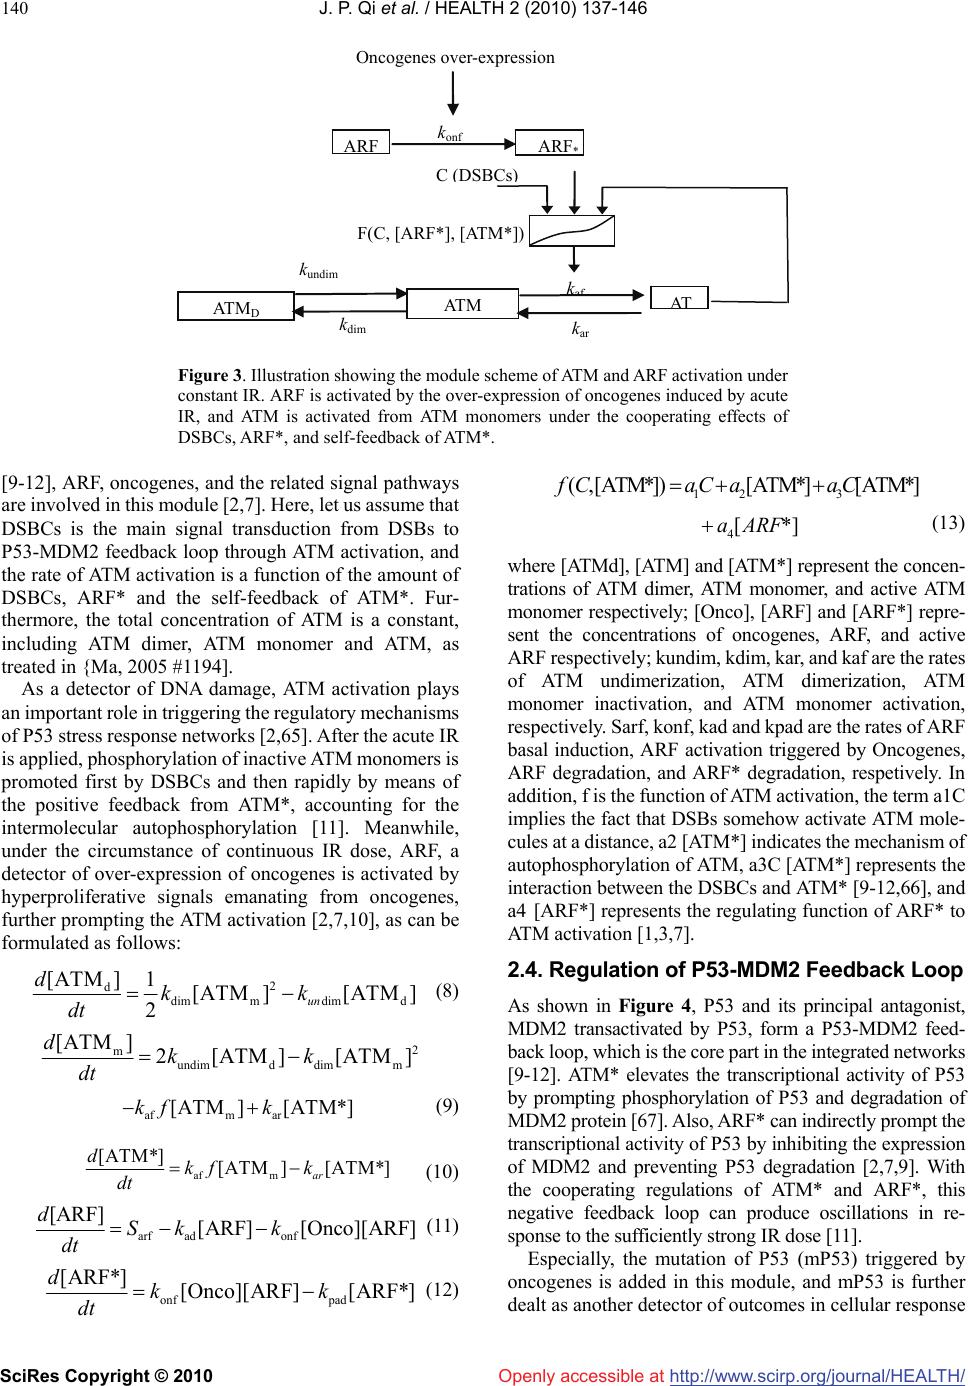 J. P. Qi et al. / HEALTH 2 (2010) 137-146 SciRes Copyright © 2010 http://www.scirp.org/journal/HEALTH/ 140 Openly accessible at AT M D AT M k undim C DSBCs ARF ARF * Oncogenes over-expression k onf F C, [ARF*], [ATM*] k ar k dim Figure 3. Illustration showing the module scheme of ATM and ARF activation under constant IR. ARF is activated by the over-expression of oncogenes induced by acute IR, and ATM is activated from ATM monomers under the cooperating effects of DSBCs, ARF*, and self-feedback of ATM*. [9-12], ARF, oncogenes, and the related signal pathways are involved in this module [2,7]. Here, let us assume that DSBCs is the main signal transduction from DSBs to P53-MDM2 feedback loop through ATM activation, and the rate of ATM activation is a function of the amount of DSBCs, ARF* and the self-feedback of ATM*. Fur- thermore, the total concentration of ATM is a constant, including ATM dimer, ATM monomer and ATM, as treated in {Ma, 2005 #1194]. As a detector of DNA damage, ATM activation plays an important role in triggering the regulatory mechanisms of P53 stress response networks [2,65]. After the acute IR is applied, phosphorylation of inactive ATM monomers is promoted first by DSBCs and then rapidly by means of the positive feedback from ATM*, accounting for the intermolecular autophosphorylation [11]. Meanwhile, under the circumstance of continuous IR dose, ARF, a detector of over-expression of oncogenes is activated by hyperproliferative signals emanating from oncogenes, further prompting the ATM activation [2,7,10], as can be formulated as follows: 2 d dim mdim d [ATM ]1[ATM][ATM ] 2un dkk dt (8) 2 m undimd dimm [ATM ]2[ATM] [ATM dkk dt ] afmar [ATM ][ATM*]kf k (9) af m [ATM*] [ATM ][ATM*] ar dkf k dt (10) arf adonf [ARF] [ARF] [Onco][ARF] dSk k dt (11) onf pad [ARF*] [Onco][ARF] [ARF*] dkk dt (12) 12 3 (, [ATM*])[ATM*][ATM*]fCaC aaC *][ 4ARFa (13) where [ATMd], [ATM] and [ATM*] represent the concen- trations of ATM dimer, ATM monomer, and active ATM monomer respectively; [Onco], [ARF] and [ARF*] repre- sent the concentrations of oncogenes, ARF, and active ARF respectively; kundim, kdim, kar, and kaf are the rates of ATM undimerization, ATM dimerization, ATM monomer inactivation, and ATM monomer activation, respectively. Sarf, konf, kad and kpad are the rates of ARF basal induction, ARF activation triggered by Oncogenes, ARF degradation, and ARF* degradation, respetively. In addition, f is the function of ATM activation, the term a1C implies the fact that DSBs somehow activate ATM mole- cules at a distance, a2 [ATM*] indicates the mechanism of autophosphorylation of ATM, a3C [ATM*] represents the interaction between the DSBCs and ATM* [9-12,66], and a4 [ARF*] represents the regulating function of ARF* to ATM activation [1,3,7]. 2.4. Regulation of P53-MDM2 Feedback Loop As shown in Figure 4, P53 and its principal antagonist, MDM2 transactivated by P53, form a P53-MDM2 feed- back loop, which is the core part in the integrated networks [9-12]. ATM* elevates the transcriptional activity of P53 by prompting phosphorylation of P53 and degradation of MDM2 protein [67]. Also, ARF* can indirectly prompt the transcriptional activity of P53 by inhibiting the expression of MDM2 and preventing P53 degradation [2,7,9]. With the cooperating regulations of ATM* and ARF*, this negative feedback loop can produce oscillations in re- sponse to the sufficiently strong IR dose [11]. Especially, the mutation of P53 (mP53) triggered by oncogenes is added in this module, and mP53 is further dealt as another detector of outcomes in cellular response 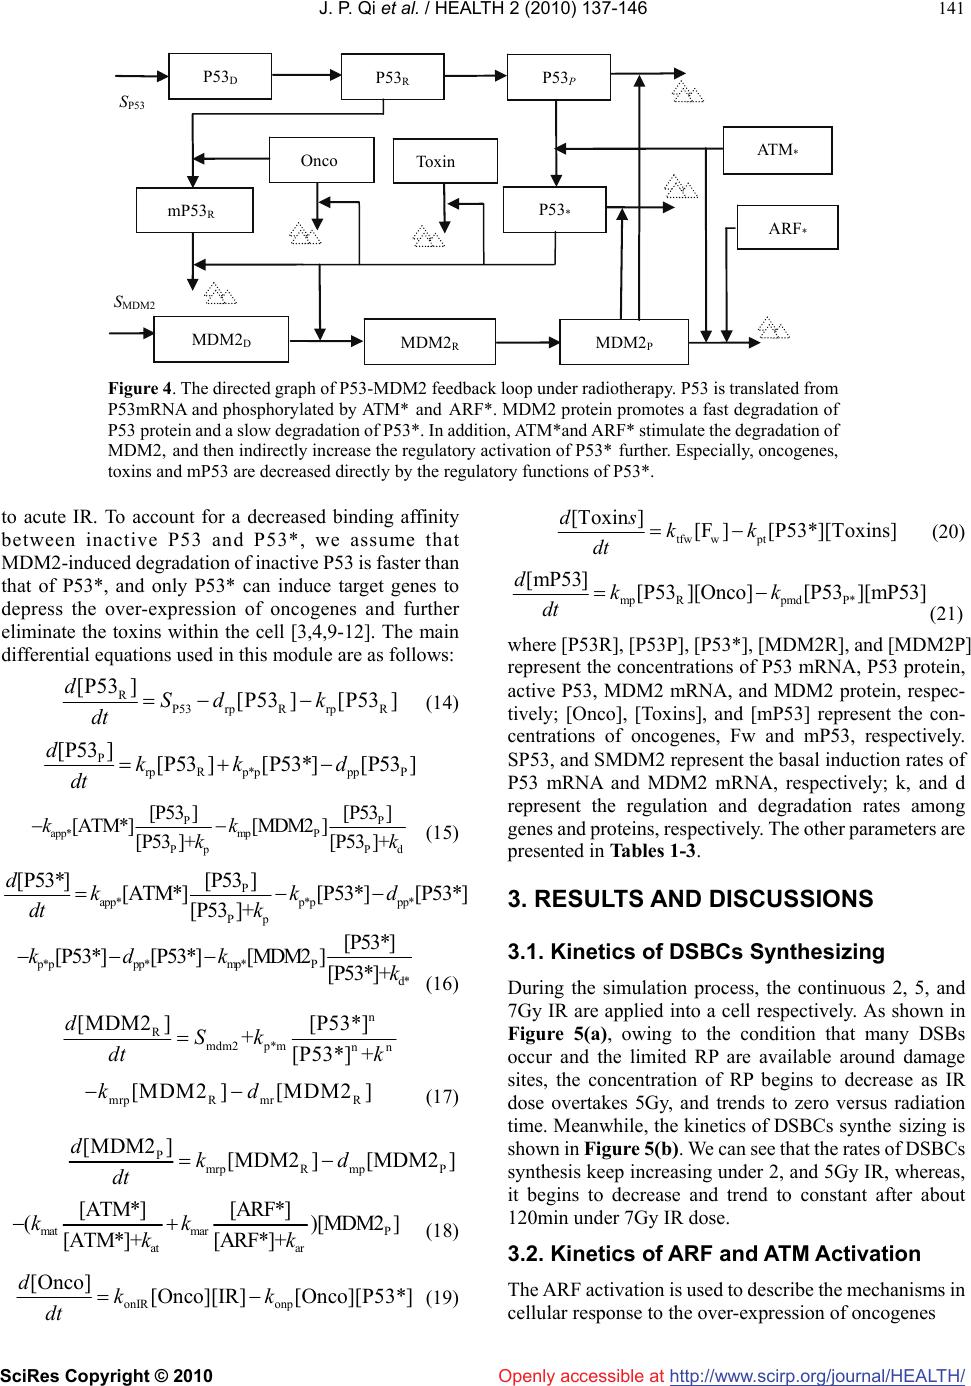 J. P. Qi et al. / HEALTH 2 (2010) 137-146 SciRes Copyright © 2010 http://www.scirp.org/journal/HEALTH/ 141 Openly accessible at Onco P53 D P53 R P53 P P53 * mP53 R MDM2 D MDM2 R MDM2 P Toxin ATM * ARF * S P53 S MDM2 Figure 4. The directed graph of P53-MDM2 feedback loop under radiotherapy. P53 is translated from P53mRNA and phosphorylated by ATM* and ARF*. MDM2 protein promotes a fast degradation of P53 protein and a slow degradation of P53*. In addition, ATM*and ARF* stimulate the degradation of MDM2, and then indirectly increase the regulatory activation of P53* further. Especially, oncogenes, toxins and mP53 are decreased directly by the regulatory functions of P53*. to acute IR. To account for a decreased binding affinity between inactive P53 and P53*, we assume that MDM2-induced degradation of inactive P53 is faster than that of P53*, and only P53* can induce target genes to depress the over-expression of oncogenes and further eliminate the toxins within the cell [3,4,9-12]. The main differential equations used in this module are as follows: R P53rp Rrp R [P53 ][P53 ][P53 ] dSdk dt (14) P rp Rp*ppp P [P53 ][P53][P53*][P53 ] dkk d dt P app*mp P Pp Pd [P53 ][P53 ] [ATM*][MDM2 ] [P53 ]+[P53 ]+ kk k P k (15) P app*p*p pp* Pp [P53] [P53*] [ATM*][P53*] [P53*] [P53]+ dkk dt k d p*ppp*mp* P d* [P53*] [P53*][P53*][MDM2][P53*]+ kdk k (16) n R mdm2 p*mnn [MDM2 ][P53*] +[P53*] + dSk dt k mrpR mrR [MDM2 ][MDM2]kd (17) P mrp Rmp P [MDM2 ][MDM2][MDM2 ] dkd dt mat marP at ar [ATM*] [ARF*] ( [ATM*]+ [ARF*]+ kk kk )[MDM2] (18) onIR onp [Onco] [Onco][IR] [Onco][P53*] dkk dt (19) tfw wpt [Toxin ][F][P53*][Toxins] ds kk dt (20) mp Rpmd P* [mP53] [P53 ][Onco][P53][mP53] dkk dt (21) where [P53R], [P53P], [P53*], [MDM2R], and [MDM2P] represent the concentrations of P53 mRNA, P53 protein, active P53, MDM2 mRNA, and MDM2 protein, respec- tively; [Onco], [Toxins], and [mP53] represent the con- centrations of oncogenes, Fw and mP53, respectively. SP53, and SMDM2 represent the basal induction rates of P53 mRNA and MDM2 mRNA, respectively; k, and d represent the regulation and degradation rates among genes and proteins, respectively. The other parameters are presented in Tables 1-3. 3. RESULTS AND DISCUSSIONS 3.1. Kinetics of DSBCs Synthesizing During the simulation process, the continuous 2, 5, and 7Gy IR are applied into a cell respectively. As shown in Figure 5(a), owing to the condition that many DSBs occur and the limited RP are available around damage sites, the concentration of RP begins to decrease as IR dose overtakes 5Gy, and trends to zero versus radiation time. Meanwhile, the kinetics of DSBCs synthe sizing is shown in Figure 5(b). We can see that the rates of DSBCs synthesis keep increasing under 2, and 5Gy IR, whereas, it begins to decrease and trend to constant after about 120min under 7Gy IR dose. 3.2. Kinetics of ARF and ATM Activation The ARF activation is used to describe the mechanisms in cellular response to the over-expression of oncogenes  J. P. Qi et al. / HEALTH 2 (2010) 137-146 SciRes Copyright © 2010 http://www.scirp.org/journal/HEALTH/ 142 Openly accessible at 020406080100120140160180200 0 2 4 6 8 10 12 14 16 18 the dynamic traces of RP avaliable around DSBs under 2,5,7Gy, respectively (a) Radiation Time(Min) Concentration under IR=2Gy under IR=5Gy under IR=7Gy (a) 050 100 150 200 250 300 0 2 4 6 8 10 12 14 16 18 the kinetics of DSBCs synthesizing under 2,5,7Gy IR, respectively (b) Radiation Time(Min) Concentration under IR=2Gy under IR=5Gy under IR=7Gy Under 7Gy IR, the rate of DSBCs synthesizing begin to decrease after this plausible time threshold (b) Figure 5. The kinetics of DSBs repairing and transferring under continuous effect of 2, 5, 7Gy IR. (a) The dynamics of RP available around the resulting DSBs under different IR dose domains. (b) The kinetics of DSBCs synthesized by DSBs and RP versus continuous radiation time under different IR dose domains. induced by acute IR [2,7]. The kinetics of ARF activation is shown in Figure 6(a). Owing to the over-expression of oncogenes without depressing functions of P53*, ARF is activated fast and ARF* keeps increasing followed by trending to dynamic equilibrium versus radiation time. Meanwhile, the ATM activation module was estab- lished to describe the switch-like dynamics of the ATM activation in response to DSBCs increasing, and the regulation mechanisms during the process of the ATM transferring DNA damage signals to the P53-MDM2 feedback loop. Under the cooperative function of DSBCs, ARF*, and the positive self-feedback of ATM*, the ATM would reach the equilibrium state within minutes due to the fast phosphorylation [2,11,67]. Kinetics of ATM ac- tivation is shown in Figure 6(b). ATM is activated rap- idly and switches to “on” state with respective rates, and then trends to the saturation state. The step- like traces suggest that the ATM module can produce an on-off switching signal, and transfer the damage signal to the P53-MDM2 feedback loop [3]. Furthermore, under the cooperation effects of ATM* and ARF*, DNA damage 0100 200300 400 500 600 700800 0 0.1 0.2 0.3 0.4 0.5 0.6 0.7 0.8 the kinetics of ARF activation under different IR dose domains (a) Radiation Time(Min) Concentration under IR=2Gy under IR=5Gy under IR=7Gy (a) 0100 200300 400 500 600 700 800 0 0.2 0.4 0.6 0.8 1 Concent ration (b) Radiation Time(Min) the kinetics of ATM activation under different IR dose domains under IR=2Gy under IR=5Gy under IR=7Gy the rate of ATM activation begin to decrease after this plausible time threshold under 7Gy IR (b) Figure 6. The kinetics of ARF and ATM activation under 2, 5, 7Gy IR. (a) The kinetics of ARF activation in response to over-expression of oncogenes induced by different IR dose. (b) The switch-like kinetics of ATM activation, ATM* reach satu- ration and trend to constant state in response to continuous radiation time of different IR dose domains. signals can be further transferred to the downstream genes and their signal pathways more efficiently [2,7]. 3.3. Outcomes of Cellular Responding Radiotherapy The P53-MDM2 feedback loop is a vital part in control- ling the downstream genes and regulation pathways to- fight against the genome stresses [6,67,68]. In response to the input signal of ATM* and ARF*, the P53-MDM2 module generates one or more oscillations. The response traces of P53 and MDM2 protein under continuous appli- cation of 2, 5, and 7Gy IR from time 0 are shown in Figure 7(a). Upon the activation by ATM*, ARF* and decreased degradation by MDM2, the total amount of P53 proteins increases quickly. Due to the P53-dependent induction of MDM2 transcription, the increase of MDM2 proteins is sufficiently large to lower the P53 level, which in turn reduces the amount of the MDM2 proteins.  J. P. Qi et al. / HEALTH 2 (2010) 137-146 SciRes Copyright © 2010 http://www.scirp.org/journal/HEALTH/Openly accessible at 143 The oscillation pulses shown in Figure 7(a) have a pe- riod of 400 min, and the phase difference between P53 and MDM2 is about 100 min. Moreover, the first pulse is slightly higher than the second, quite consistent with the experimental observations [2,7,11] as well as the previous simulation results [9,10,12,69]. Also, by comparing these simulation results, we can see that the strength and swing of these oscillations begin to decrease as IR overtakes 7Gy, suggesting that the ability of cellular responding genome stresses begin to 0100 200300 400 500 600 700800 0 0.5 1 1.5 2 2.5 3 3.5 4 4.5 5 the kinetics of Fw elimination with the regulating functions of P53* under different IR (b) Radiation Time(Min) Concentration Fw under IR=2Gy Fw under IR=5Gy Fw under IR=7Gy (a) 0100 200 300 400 500600 700 800 0 0. 1 0. 2 0. 3 0. 4 0. 5 0. 6 0. 7 0. 8 0. 9 the oscillating kinetics of P53* and MDM2 in response to different IR dose domains (a) Radiation Time(Min) Conce ntratio n P53* under IR=2Gy P53* under IR=5Gy P53* under IR=7Gy MDM2 under IR=2Gy MDM2 under IR=5Gy MDM2 under IR=7Gy (b) 0100 200 300 400 500600 700 800 0.1 5 0.1 6 0.1 7 0.1 8 0.1 9 0.2 0.2 1 0.2 2 0.2 3 0.2 4 0.2 5 the kinetics of Oncogenes depressed by the functions of P53* in response to different IR (c) Radiation Time(Min) Concentration Onco under IR=2Gy Onco under IR=5Gy Onco under IR=7Gy (c) 0100 200 300 400 500 600 700 800 0.48 0.5 0.52 0.54 0.56 0.58 0.6 0.62 0.64 0.66 the kinetics of mP53 degradated by P53* under different IR dose domains (d) Radiation Time(Min) Concentration mP53 under IR=2Gy mP53 under IR=5Gy mP53 under IR=7Gy (d) Figure 7. The outcomes of cellular responding 2, 5, 7Gy IR under radiotherapy. (a) The oscillating kinetics of P53* and MDM2 in response to the cooperative effect of ATM* and ARF* under different IR dose domains; (b) The kinetics of toxins elimination triggered by the functions of P53*; (c) The depressing dynamics of oncogenes over-expression with the regulations of P53*; (d) The kinetics of mP53 elimination triggered by the effect of P53*. decrease as IR dose exceeds a certain threshold. Furthermore, because in the current model the toxins, mP53 and oncogenes can be degraded directly by P53* in this module, we can plot the predictable outcomes of cellular response in fighting against genome stresses under different IR dose domains. As shown in Figure 7(b), Fw remaining within the cell keeps decreasing with respective rate, and trends to zero versus continuous radiation time under 2 and 5Gy IR. Whereas, when IR exceeds 7Gy, Fw begins to increase slightly with some oscillations. Also, the kinetics of oncogenes degrading is plotted in Figure 7(c). As we can see, owing to the nega- tive regulations of P53*, the expression level of onco- genes keeps decreasing after the first climate under 2 and 5Gy IR dose, and then begins to increase slowly under 7Gy IR dose. Meanwhile, as shown in Figure 7(d), quite similar to the results in Figure 7(b) and Figure 7(c), mP53 keeps decrease after reaching the first maximum under 2 and 5Gy IR dose, and then begins to increase slowly under 7Gy IR dose. All these results obtained by the above simulations based on the new model indicate that that P53* indeed acts an important role in regulating downstream genes and their signal pathways, whereas its capabilities in cellular responding DNA damage under radiotherapy begin to decrease as the strength of IR ex- ceeds a certain maximal threshold. 4. CONCLUSIONS A new model was proposed to simulate the P53 stress response network under radiotherapy. It is demonstrated according to our model that ATM and ARF exhibits a strong sensitivity and switch-like behavior in response to  J. P. Qi et al. / HEALTH 2 (2010) 137-146 SciRes Copyright © 2010 http://www.scirp.org/journal/HEALTH/ 144 Openly accessible at the number of DSBs, fully consistent with the experi- mental observations. Interestingly, it is shown in this study that after the DNA damage signals transferring, P53-MDM2 feedback loop will produce oscillations, then triggering the cellular self-defense mechanisms to de- grade the toxins remaining within the cell, such as Fw, oncogenes, and mP53. Particularly, under different IR dose domains, the new model can reasonably predict outcomes of cellular response in fighting against genome stresses, and hence providing a framework for analyzing the complicated regulations of P53 stress response net- works, as well as the mechanisms of the cellular self- defense under radiotherapy. 5. ACKNOWLEDGMENT The current work was supported in part by Specialized Research Fund for Natural Science Foundation of Shanghai (No.10ZR1401600), the Doctoral Program of Higher Education from Ministry of Education of China (No.20060255006), Project of the Shanghai Committee of Sci- ence and Technology (No. 08JC1400100), and the Open Fund from the Key Laboratory of MICCAI of Shanghai (06dz22103). REFERENCES [1] Li, L., Story, M. and Legerski, R.J. (2001) Cellular re- sponses to ionizing radiation damage. Int J Radiat Oncol Biol Phys, 49, 1157-1162. [2] Kohn, K.W. and Pommier, Y. (2005) Molecular interac- tion map of the p53 and Mdm2 logic elements, which control the Off-On switch of p53 in response to DNA damage. Biochem Biophys Res Commun, 331, 816-827. [3] Perez, C.A. and Purdy, J.A. (1998) Treatment planning in radiation oncology and impact on outcome of therapy. Rays, 23, 385-426. [4] Tjebbes, G.W., Kreijveld, P.A., Tilanus, M.G., Hordijk, G. J. and Slootweg, P.J. (2002) P53 tumor suppressor gene mutations in laryngeal cancer and in recurrent disease following radiation therapy. Oral Oncol, 38, 296-300. [5] Duchting, W., Ulmer, W. and Ginsberg, T. (1996) Cancer: a challenge for control theory and computer modelling. Eur J Cancer, 32A, 1283-1292. [6] Ritter, M.A., Gilchrist, K.W., Voytovich, M., Chappell, R. J. and Verhoven, B.M. (2002) The role of p53 in radiation therapy outcomes for favorable-to-intermediate-risk prostate cancer. Int J Radiat Oncol Biol Phys, 53, 574-580. [7] Lindstrom, M.S. and Wiman, K.G. (2003) Myc and E2F1 induce p53 through p14ARF-independent mechanisms in human fibroblasts. Oncogene, 22, 4993-5005. [8] Pauklin, S., Kristjuhan, A., Maimets, T. and Jaks, V. (2005) ARF and ATM/ATR cooperate in p53-mediated apoptosis upon oncogenic stress. Biochem Biophys Res Commun, 334, 386-394. [9] Qi, J.P., Shao, S.H., Li, D.D. and Zhou, G.P. (2007) A dynamic model for the p53 stress response networks under ion radiation. Amino Acids, 33, 75-83. [10] Qi, J.P., Shao, S.H., Xie, J. and Zhu, Y. (2007) A mathemtical model of P53 gene regulatory networks un- der radiotherapy. Biosystems, 90, 698-706. [11] Ma, L., Wagner, J., Rice, J.J., Hu, W., Levine, A.J. and Stolovitzky, G.A. (2005) A plausible model for the digital response of p53 to DNA damage. Proc Natl Acad Sci USA, 102, 14266-14271. [12] Qi, J.P., Shao, S.H. and Shen, Y.Z. (2008) Cellular re- sponding DNA damage: An improved modeling of P53 gene regulatory networks under ion radiation (IR). Ap- plied Mathematics and Computation, 205, 73-83. [13] Chou, K.C. and Zhou, G.P. (1982) Role of the protein outside active site on the diffusion-controlled reaction of enzyme. Journal of American Chemical Society, 104, 1409-1413. [14] Chou, K.C. (1988) Review: Low-frequency collective motion in biomacromolecules and its biological functions. Biophysical Chemistry, 30, 3-48. [15] Chou, K.C. (1989) Graphical rules in steady and non- steady enzyme kinetics. J. Biol. Chem., 264, 12074- 12079. [16] Chou, K.C. (1990) Review: Applications of graph theory to enzyme kinetics and protein folding kinetics. Steady and non-steady state systems. Biophysical Chemistry, 35, 1-24. [17] Ginsberg, T., Ulmer, W. and Duchting, W. (1993) Com- puter simulation of fractionated radiotherapy: further re- sults and their relevance to percutaneous irradiation and brachytherapy. Strahlenther Onkol, 169, 304-310. [18] Chou, K.C., Kezdy, F.J. and Reusser, F. (1994) Review: Steady-state inhibition kinetics of processive nucleic acid polymerases and nucleases. Analytical Biochemistry, 221, 217-230. [19] Chou, K.C. (2004) Review: Structural bioinformatics and its impact to biomedical science. Current Medicinal Chemistry, 11, 2105-2134. [20] Chou, K.C. In Structural bioinformatics and its impact to biomedical science and drug discovery, In: Frontiers in Medicinal Chemistry. Bentham Science Publishers: The Netherlands, 3, 2006. [21] Huang, R.B., Du, Q.S., Wang, C.H. and Chou, K.C. (2008) An in-depth analysis of the biological functional studies based on the NMR M2 channel structure of influenza A virus. Biochem. Biophys. Res. Comm., 377, 1243-1247. [22] Chou, K.C. and Shen, H.B. (2008) Cell-PLoc: A package of web-servers for predicting subcellular localization of proteins in various organisms. Nature Protocols, 3, 153-162. [23] Wang, J.F., Gong, K., Wei, D.Q., Li, Y.X. and Chou, K.C. (2009) Molecular dynamics studies on the interactions of PTP1B with inhibitors: From the first phosphate binding site to the second one. Protein Engineering Design and Selection, 22, 349-355. [24] Althaus, I.W., Chou, J.J., Gonzales, A.J., Diebel, M.R., Chou, K.C., Kezdy, F.J., Romero, D.L., Aristoff, P.A., Tarpley, W.G. and Reusser, F. (1993) Steady-state kinetic studies with the non-nucleoside HIV-1 reverse transcrip- tase inhibitor U-87201E. J. Biol. Chem., 268, 6119-6124. [25] Althaus, I.W., Gonzales, A.J., Chou, J.J., Diebel, M.R., Chou, K.C., Kezdy, F.J., Romero, D.L., Aristoff, P.A., Tarpley, W.G. and Reusser, F. (1993) The quinoline U- 78036 is a potent inhibitor of HIV-1 reverse transcriptase. J. Biol. Chem., 268, 14875-14880. [26] Althaus, I.W., Chou, J.J., Gonzales, A.J., Diebel, M.R., Chou, K.C., Kezdy, F.J., Romero, D.L., Aristoff, P.A., Tarpley, W.G. and Reusser, F. (1993) Kinetic studies with the nonnucleoside HIV-1 reverse transcriptase inhibitor  J. P. Qi et al. / HEALTH 2 (2010) 137-146 SciRes Copyright © 2010 http://www.scirp.org/journal/HEALTH/Openly accessible at 145 U-88204E. Biochemistry, 32, 6548-6554. [27] Chou, K.C., Wei, D.Q. and Zhong, W.Z. (2003) Binding mechanism of coronavirus main proteinase with ligands and its implication to drug design against SARS. (Erratum: ibid., 2003, Vol.310, 675). Biochem Biophys Res Comm, 308, 148-151. [28] Du, Q.S., Wang, S.Q., Jiang, Z.Q., Gao, W.N., Li, Y.D., Wei, D.Q. and Chou, K.C. (2005) Application of bioin- formatics in search for cleavable peptides of SARS-CoV Mpro and chemical modification of octapeptides. Me- dicinal Chemistry, 1, 209-213. [29] Zhang, R., Wei, D.Q., Du, Q.S. and Chou, K.C. (2006) Molecular modeling studies of peptide drug candidates against SARS. Medicinal Chemistry, 2, 309-314. [30] Du, Q.S., Sun, H. and Chou, K.C. (2007) Inhibitor design for SARS coronavirus main protease based on “distorted key theory”. Medicinal Chemistry, 3, 1-6. [31] Zheng, H., Wei, D.Q., Zhang, R., Wang, C., Wei, H. and Chou, K.C. (2007) Screening for new agonists against Alzheimer's disease. Medicinal Chemistry, 3, 488-493. [32] Wei, H., Wang, C.H., Du, Q.S., Meng, J. and Chou, K.C. (2009) Investigation into adamantane-based M2 inhibitors with FB-QSAR. Medicinal Chemistry, 5, 305-317. [33] Gong, K., Li, L., Wang, J.F., Cheng, F., Wei, D.Q. and Chou, K.C. (2009) Binding mechanism of H5N1 influ- enza virus neuraminidase with ligands and its implication for drug design. Medicinal Chemistry, 5, 242-249. [34] Chou, K.C. (1987) The biological functions of low- fre- quency phonons: 6. A possible dynamic mechanism of allosteric transition in antibody molecules. Biopolymers, 26, 285-295. [35] Chou, K.C. (1989) Low-frequency resonance and coop- erativity of hemoglobin. Trends in Biochemical Sciences, 14, 212. [36] Schnell, J.R. and Chou, J.J. (2008) Structure and mecha- nism of the M2 proton channel of influenza A virus. Na- ture, 451, 591-595. [37] Gordon, G. (2008) Extrinsic electromagnetic fields, low frequency (phonon) vibrations, and control of cell func- tion: a non-linear resonance system. Journal of Biomedi- cal Science and Engineering (JBiSE), 1, 152-156 (open accessible at http://www.srpublishing.org/journal/jbise/). [38] Du, Q.S., Huang, R.B., Wang, C.H., Li, X.M. and Chou, K. C. (2009) Energetic analysis of the two controversial drug binding sites of the M2 proton channel in influenza. A virus Journal of Theoretical Biology, 259, 159-164. [39] Pielak, R.M., Jason, R., Schnell, J.R. and Chou, J.J. (2009) Mechanism of drug inhibition and drug resistance of in- fluenza A M2 channel. Proceedings of National Academy of Science, USA, 106, 7379-7384. [40] Chou, K.C. and Jiang, S.P. (1974) Studies on the rate of diffusion-controlled reactions of enzymes. Scientia Sinica, 17, 664-680. [41] Chou, K.C. (1984) The biological functions of low- fre- quency phonons: 3. Helical structures and microenvi- ronment. Biophysical Journal, 45, 881-890. [42] Chou, K.C., Kiang, Y.S. (1985) The biological functions of low-frequency phonons: 5. A phenomenological theory. Biophysical Chemistry, 22, 219-235. [43] Zhou, G.P. (1989) Biological functions of soliton and extra electron motion in DNA structure. Physica Scripta, 40, 698-701. [44] Chou, K.C., Maggiora, G.M., Mao, B. (1989) Quasi- continuum models of twist-like and accordion-like low- frequency motions in DNA. Biophysical Journal, 56, 295-305. [45] Chou, K.C., Zhang, C.T., Maggiora, G.M. (1994) Solitary wave dynamics as a mechanism for explaining the internal motion during microtubule growth. Biopolymers, 34, 143-153. [46] Sinkala, Z. (2006) Soliton/exciton transport in proteins. J Theor Biol, 241, 919-927. [47] Chou, K.C. and Shen, H.B. (2009) FoldRate: A web- server for predicting protein folding rates from primary sequence. The Open Bioinformatics Journal, 3, 31-50 (openly acces- sible at http://www.bentham.org/open/tobioij/). [48] Shen, H.B., Song, J.N. and Chou, K.C. (2009) Prediction of protein folding rates from primary sequence by fusing multiple sequential features. Journal of Biomedical Sci- ence and Engineering (JBiSE), 2, 136-143 (openly ac- cessible at http://www.srpublishing.org/journal/jbise/). [49] Chou, K.C. and Zhang, C.T. (1992) Diagrammatization of codon usage in 339 HIV proteins and its biological im- plication AIDS. Research and Human Retroviruses, 8, 1967-1976. [50] Zhang, C.T. and Chou, K.C. (1994) Analysis of codon usage in 1562 E. Coli protein coding sequences. Journal of Molecular Biology, 238, 1-8. [51] Zhang, C.T. and Chou, K.C. (1996) An analysis of base frequencies in the anti-sense strands corresponding to the 180 human protein coding sequences. Amino Acids, 10, 253-262. [52] Xiao, X., Shao, S.H. and Chou, K.C. (2006) A probability cellular automaton model for hepatitis B viral infections. Biochem. Biophys. Res. Comm., 342, 605-610. [53] Xiao, X., Shao, S., Ding, Y., Huang, Z., Chen, X. and Chou, K.C. (2005) An Application of Gene Comparative Image for Predicting the Effect on Replication Ratio by HBV Virus Gene Missense Mutation. Journal of Theo- retical Biology, 235, 555-565. [54] Xiao, X., Wang, P. and Chou, K.C. (2009) GPCR-CA: A cellular automaton image approach for predicting G- protein-coupled receptor functional classes. Journal of Computational Chemistry, 30, 1414-1423. [55] Xiao, X., Shao, S.H., Ding, Y.S., Huang, Z.D. and Chou, K.C. (2006) Using cellular automata images and pseudo amino acid composition to predict protein subcellular lo- cation. Amino Acids, 30, 49-54. [56] Wang, M., Yao, J.S., Huang, Z.D., Xu, Z.J., Liu, G.P., Zhao, H.Y., Wang, X.Y., Yang, J., Zhu, Y.S. and Chou, K. C. (2005) A new nucleotide-composition based finger- print of SARS-CoV with visualization analysis. Medicinal Chemistry, 1, 39-47. [57] Gao, L., Ding, Y.S., Dai, H., Shao, S.H., Huang, Z.D. and Chou, K.C. (2006) A novel fingerprint map for detecting SARS-CoV. Journal of Pharmaceutical and Biomedical Analysis, 41, 246-250. [58] Tyson, J.J. (1999) Models of cell cycle control in eu- karyotes. J Biotechnol, 71, 239-244. [59] Tyson, J.J. and Novak, B. (2001) Regulation of the eu- karyotic cell cycle: molecular antagonism, hysteresis, and irreversible transitions. J Theor Biol, 210, 249-263. [60] Magne, N., Toillon, R.A., Bottero, V., Didelot, C., Houtte, P.V., Gerard, J.P. and Peyron, J.F. (2006) NF-kappaB modulation and ionizing radiation: mechanisms and future directions for cancer treatment. Cancer Lett, 231,  J. P. Qi et al. / HEALTH 2 (2010) 137-146 SciRes Copyright © 2010 http://www.scirp.org/journal/HEALTH/Openly accessible at 146 158-168. [61] Chou, K.C., Watenpaugh, K.D. and Heinrikson, R.L. (1999) A Model of the complex between cyclin- de- pendent kinase 5 (Cdk5) and the activation domain of neuronal Cdk5 activator. Biochemical & Biophysical Re- search Communications, 259, 420-428. [62] Rapp, A. and Greulich, K.O. (2004) After double-strand break induction by UV-A, homologous recombination and nonhomologous end joining cooperate at the same DSB if both systems are available. J Cell Sci, 117, 4935-4945. [63] Rothkamm, K., Kruger, I., Thompson, L.H. and Lobrich, M. (2003) Pathways of DNA double-strand break repair during the mammalian cell cycle. Mol Cell Biol, 23, 5706-5715. [64] Budman, J. and Chu, G. (2005) Processing of DNA for nonhomologous end-joining by cell-free extract. EMBO J, 24, 849-860. [65] Daboussi, F., Dumay, A., Delacote, F. and Lopez, B.S. (2002) DNA double-strand break repair signalling: the case of RAD51 post-translational regulation. Cell Signal, 14, 969-975. [66] Oren, M. (2003) Decision making by p53: Life, death and cancer. Cell Death Differ, 10, 431-442. [67] Lev Bar-Or, R., Maya, R., Segel, L.A., Alon, U., Levine, A.J. and Oren, M. (2000) Generation of oscillations by the p53-Mdm2 feedback loop: a theoretical and experimental study. Proc Natl Acad Sci U S A, 97, 11250-11255. [68] Weller, M. (199) Predicting response to cancer chemo- therapy: the role of p53. Cell Tissue Res, 292, 435-445. [69] Lahav, G., Rosenfeld, N., Sigal, A., Geva-Zatorsky, N., Levine, A.J., Elowitz, M.B. and Alon, U. (2004) Dynam- ics of the p53-Mdm2 feedback loop in individual cells. Nat Genet, 36, 147-150.
|