Advances in Chemical Engineering and Science
Vol.05 No.04(2015), Article ID:60520,10 pages
10.4236/aces.2015.54054
Optimisation of Decolourisation Conditions of Crude Shea (Vitellaria paradoxa Gaertner F) Butter: Black Type
A. M. Mohagir1*, N. D. Bup2, C. F. Abi3, R. Kamga4, R. C. Kapseu4
1Faculty of Science and Technologies, University of Sarh, Sarh, Chad
2Higher Institute of the Sahel, University of Maroua, Maroua, Cameroon
3Department of Chemistry, Higher Teachers Training College, University of Yaounde 1, Yaounde, Cameroon
4National Advanced School of Agro-Process Industries, University of Ngaoundéré, Ngaoundéré, Cameroon
Email: *amohagir2003@yahoo.fr
Copyright © 2015 by authors and Scientific Research Publishing Inc.
This work is licensed under the Creative Commons Attribution International License (CC BY).
http://creativecommons.org/licenses/by/4.0/


Received 20 August 2015; accepted 20 October 2015; published 23 October 2015
ABSTRACT
In the present study, response surface methodology applying Doehlert experimental design was used to investigate decolourisation parameters of crude black shea butter. The decolourisation process was significantly influenced by three independent parameters: contact time, decolourisation temperature and adsorbent dose. The responses of the process were oil loss, acid value, peroxide value and colour index. Contour plots of the decolourisation responses were superimposed and well defined the optimum zone. The optimum decolourisation conditions were found to be: contact time (30 min), temperature (72˚C - 95˚C) and adsorbent dosage (1.5 - 2.5 mass %).
Keywords:
Black Shea Butter, Decolourisation, Doehlert Experimental Matrix, RSM, Optimisation

1. Introduction
Vegetable oils contain numerous pigments, including chlorophyll, carotenoids, xanthophylls and their derivatives, and these are removed to give the oil a colour that is acceptable to the consumer [1] . Moreover, impurities like free fatty acids, phospholipids and traces of metals were reported [2] [3] . These impurities limit the preservation and uses of the oils. Thus refining of crude oils extends its preservation period and increases its price. Among the most significant stages of any vegetable oil refining process is decolourisation by adsorption of the pigments on a solid support [4] [5] . Previous studies showed that aluminas, silicas, silico-aluminas and activated clays have the properties to adsorb pigments from vegetable oils [6] [7] . The use of clays for the decolourisation of shea butter has not been well investigated.
Efficiency of decolourisation process depends on many parameters like temperature, contact time, agitation rate, adsorbent dosage, adsorbent particle size, variety of oils [8] [9] . The evaluation of influence of these parameters on the efficiency of decolourisation process is required for any optimisation procedure. Although there are many works realised on the decolourisation of vegetable oils using different types of adsorbent such as charcoal, clay materials and aluminium and silicon oxides, very few studies had been carried out on the decolourisation of shea butter.
There are two types of shea butter in Chad, namely cosmetic (yellow) and edible (black). Their methods of preparation were described previously [10] . In the production of edible shea butter, shea kernels are roasted in red heated sand in a steel pot and then crushed with wooden mortar and finally grounds. The difference between the two methods is that the production of yellow shea butter does not include the roasting step.
Response surface methodology is based on polynomial surface analysis and it is a collection of mathematical and statistical techniques that are useful for the modeling and analysis of problems in which a response of interest is influenced by several variables [11] . Moreover, response surface methodology could be used to determine the optimum operational conditions of a process [12] . Doehlert experimental matrix represents a uniform distribution of experimental points in space of coded variables. It is used particularly when there is a need to cover an experimental domain of any form of uniformly distributed points in order to explore the total domain (margins and interiors) without proposing a model that gives the response. Moreover, it permits to follow a sequential manner in studying a response surface of second degree [11] . It has little number of experiments compared with the central composite design. The number of levels is not the same for all variables, i.e. allows flexibility in arranging the independent parameters (priority). Also the matrix is flexible for adding new parameters or extending experimental domains, without restarting the experiments that has already done. Moreover, polynomial equations with and without interaction are used as models.
The application of statistical experimental design techniques in adsorption process development can result in improved product yield and its quality [13] . Bike Mbah et al., (2005) [14] studied the decolourisation of shea butter using activated clay and reported that pigments and free fatty acids decreased and peroxides compounds were destroyed with the increase in decolourisation time. Since elimination of free fatty acids, oxidative products, and other impurities of crude oils is the main function of neutralisation process, this work was focused on the decolourisation of shea butter to improve its physicochemical properties. Hence the main objective of this was to optimise the decolourisation parameters of crude black coloured shea butter using tonsil fuller earth.
2. Material and Methods
Crude black traditionally aqueous extracted shea butter was purchased from Penie village-South of Chad in January 2008. The method of extraction was described by (Adoum, 1996) [15] . Adsorbent was Tonsil fuller earth (240 FE, Olifants, Republic of South Africa), supplied by Cotton Chad Company, Spectrophotometer: Double beam UV-Visible Spectrophotometer of model (SECOMAM, ISO 9001, France), Lovibond Tintometer: Model (F 292, Tintometer Ltd., U.K, with tungsten halogen lamp as source of light).
2.1. Modelling and Optimisation of Decolourisation Process
The response surface methodology using the Doehlert experimental matrix was used to investigate the relationship existing between the process responses and the independent parameters and to optimise the process conditions as mentioned early [16] [17] . The selected model was a second degree polynomial equation with interaction as proposed by Doehlert experimental design. The coefficients and the mathematical equations relating the response factors with the independent parameters were generated using the multiple regression techniques installed in Sigmaplot software [18] . Then the mathematical equations were used in the determination of the theoretical zones of optimal response. The validity of models was verified by the coefficient of determination R2 and the absolute average deviation (AAD). The last was calculated following Equation (1).
 (1)
(1)
where yi.exp and yi.cal are the experimental and calculated responses respectively, Z is the number of experimental run.
Three independent variables namely contact time (X1: 5 - 120 min), decolourisation temperature (X2: 50˚C - 95˚C), and adsorbent dose (X3: 1 - 6 mass %) were used as main independent parameters based on literature review and preliminary studies. A total of 13 different experiments were enough to study the decolourisation process according to the experimental design. Each experiment was repeated twice and the average values were calculated and used. The experiments are presented in Table 1 in coded values. The response functions (Yi) measured were oil loss (%) (Yloss), acid value (YAv), peroxide value (YPv) and colour (YColour) of shea butter. The oil loss was expressed as a mass ratio of decolourised oil to that of crude one, while acid and peroxide values were evaluated using the method described in AFNOR (1981) [19] . The responses were related to the coded values (xi) by the second order polynomial that shown in Equation (2).
 (2)
(2)
The coefficients of the polynomial were represented by b0 (constant term), bi (linear effects), bii (quadratic effects) and bij (interaction effects). Xi and Xj are the independent variables. The analyses of variance (ANOVA) were generated and the effect and regression coefficients of individual, quadratic and interaction terms were determined. The significances of all terms in the polynomial were judged statistically at a probability (P) of 0.001, 0.01 and 0.05. The regression coefficients were then used to make statistical calculation to generate contour map and response surface graphs from the regression models.
2.2. Procedure of Decolourisation
The decolourisation apparatus was composed of a 250 ml conical flask equipped with a mechanical agitator of model (Heidolph, RZR1, Germany). The flask was immersed in a thermostated water bath. In each experiment, 30 g of crude shea butter was heated and maintained at the desired temperature for 15 min before adding the adsorbent, and then the mixture was continuously heated and stirred. The agitation rate used was that just enough to keep the clay dispersed (150 rpm). After decolourisation, the mixture was immediately filtered using Whatman no 1 filter paper on a layer of celite 545 and a vacuum pump of model (960101, Osi-DVD-Bolong, Italy). Each experiment was repeated twice and the results reported are the means of three measurements.

Table 1. Doehlert experimental design in coded variables (xi) employed for decolourisation of black shea butter.
2.3. Lovibond Colour
This technique as described by (ISO 15305, 1998) [20] , involves matching the colour of light transmitted through a specified depth of oil with the colour of light transmitted from the same light source through a set of coloured glass slides called Lovibond colour glasses. For vegetable oils frequently it requires fixing the yellow numeral in some functional relation to the red or vice versa. The colour of shea butter was measured using Lovibond Tintometer of model (F292, Tintometer Ltd. UK). All the test samples were homogenised to clear liquids by heating them in an oven set at 50˚C ± 2˚C. In our measurement the yellow unit was fixed at 20 degree for black sample, while the red units were independently varied. The measurements were all carried out using 1 inch glass cells.
3. Results and Discussions
3.1. Modelling of Decolourisation Process
The data in Table 2 were analysed using multiple regression in Sigmaplot software [18] to fit the proposed polynomial models (Equations (3)-(7)) which explained the influence of independent parameters on the responses of decolourisation process of crude black shea butter. These models coefficients are presented in Table 3.
 (3)
(3)
 (4)
(4)
 (5)
(5)
 (6)
(6)
Table 2. Values of experimental results for the decolourisation of black shea butter.
X1: contact time (min), X2: decolourisation temperature (˚C), X3: adsorbent dose (mass %), Yloss: Oil loss (%), YAv: acid value (mg KOH/g), YPv: peroxide value (meq O2/Kg), YColour: Lovibond red colour.
Table 3. Regression coefficients, coefficient of determination (R2) and absolute average deviation (AAD) for four dependent parameters for decolourisation of black shea butter.
b1 = contact time, b2 = decolourisation temperature, b3 = adsorbent dose (mass %). *Significant at 0.05; **Significant at 0.01; ***Significant at 0.001.
From data in Table 3, the oil loss was significantly influenced by the linear (P < 0.01) and quadratic terms of the decolourisation temperature, linear (P < 0.01) effect of adsorbent dose and interaction (P < 0.01) effect between decolourisation temperature and adsorbent dosage. The linear term of decolourisation temperature was negative (b2 = −1.39) while had a positive effect on the oil loss. The linear effect of adsorbent dosage (b3 = 2.47), the quadratic influence of decolourisation temperature (b22 = 4.17) and the interaction effect between decolourisation temperature and adsorbent dose (b23 = 3.89) showed a negative effect on the oil loss, while had positive signs. Meanwhile, contact time showed no significant influence (P < 0.01) on the oil loss. The decrease in oil loss with the increase of decolourisation temperature is due to the decrease of viscosity of shea butter with the increase of temperature and the decrease of viscosity enhanced the efficiency of filtration of shea butter.
For acid value, the decolourisation temperature had a positive (P < 0.05) effect on the acid value, while showing a negative linear effect on the second order term (b2 = −0.953). The other two independent parameters (absorbent dose and contact time) showed no significant influence (P < 0.05). The increase in acid value with the increase in decolourisation temperature could be attributed to the hydrolysis of fat catalysed by lipase enzymes that were naturally found in shea kernels. On the other hand, the decrease in acid value with decolourisation temperature might be due to deactivation of lipase at elevated temperature. Ladurelle (1984) [21] reported that the deactivation of lipase usually begins at 80°C when oilseeds are boiled in water. On the other hand the decrease in acid value with an increase in adsorbent dose (mass %) could be attributed to the adsorption of free fatty acids by adsorbent. Similar observations were reported [14] [22] .
For peroxide value, only the contact time had a positive significant influence (P < 0.05), as reflected in the negative value of its linear term (b1 = −0.844). However, the values of R2 and AAD showed that the model of peroxide value had 40% lack of fit. This might be due to miss use of other independent parameters which significantly affect the peroxide value during decolourisation process. The decrease in peroxide value with the increase in contact time could be attributed to the adsorption of hydroperoxides and other oxidants by the adsorbent (2.5 mass %). The adsorption of free fatty acids and destruction of peroxides during bleaching process were also noted [14] [23] .
For lovibond colour index, while all the linear terms of contact time, decolourisation temperature and adsorbent dosage had positive influences on the colour of black shea butter, the quadratic terms of the mentioned parameters had negative influences. The effects of the interaction of contact time and decolourisation temperature, adsorbent dose and decolourisation temperature on the colour were positive, whereas that of contact time and adsorbent dose was negative. The decrease in colour with the increase in adsorbent dose could be attributed to the adsorption of colour material by the adsorbent. In fact, the bleaching process with acid-activated clays such as fuller earth is generally a combination of catalytic action “peroxide destruction” and equilibrium adsorption “pigment removal from the oil” [24] . Impurities in the oil, such as carotenes and chlorophyll, can rapidly diffuse through the sample and adhere to most of the active acid sites on the clay surface. Improved adsorptive properties for the removal of pigments from edible oils were observed [25] . Also it is reported that acidic OH groups of tonsil fuller earth can directly exchange protons with pigment molecules. In addition, the protonated A1OH2- structure can serve as an effective binding site to permit the attachment of pigments and other colouring material contained in oils [25] . Furthermore, it is noted that pigments such as β-carotene can either be adsorbed directly onto a cation to form a chemisorbed complex or react with the protonic centers present on the adsorbent surface [26] [27] .
3.2. Adequacy of the Proposed Models
The statistical analyses indicated that the proposed models were adequate with satisfactory values of R2 and AAD. The closer the value of R2 to the unity, the better the empirical model fits the actual data. The smaller the value of R2 the less relevant the dependent variables in the model have to explain the behaviour variation [28] . On the other hand, for adequate empirical model, the value of AAD should be as small as possible (0 - 10) [29] .
3.3. Optimisation of the Decolourisation Process
By analysing the influence of decolourisation conditions on oil loss, colour, acid value and peroxide value of shea butter, all the responses were found to vary substantially with decolourisation temperature and adsorbent dose (mass %) for decolourisation of black shea butter. Using the predicted polynomial models (equations 3 - 6), contour plots for the independent variables as a function of decolourisation temperature and adsorbent mass percentage were generated and the limits of acceptance were set for each attribute (Figures 1-4).
The contour plot (Figure 1) for oil loss indicated that a high decolourisation temperature and little adsorbent mass % were necessary to obtain a low oil loss. But, high decolourisation temperature and greater adsorbent dose (mass %) gave low colour intensity. It is also observed that a high decolourisation temperature gave a low acid value, whereas low decolourisation temperature and a small adsorbent dose (mass %) produced shea butter with low peroxide value.
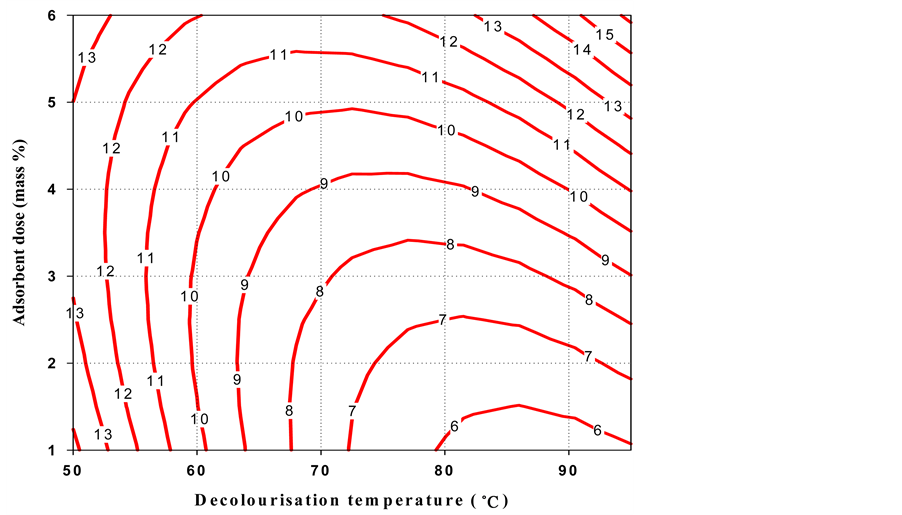
Figure 1. Contour plot of the oil loss as a function of decolourisation temperature and adsorbent dose for black shea butter.
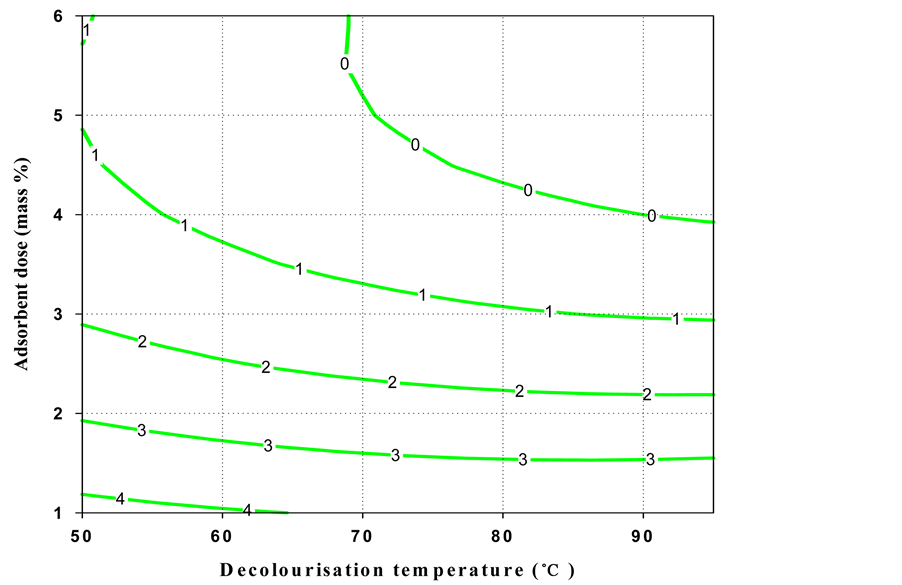
Figure 2. Contour plot of the colour of black shea butter as a function of decolourisation temperature and adsorbent dose.
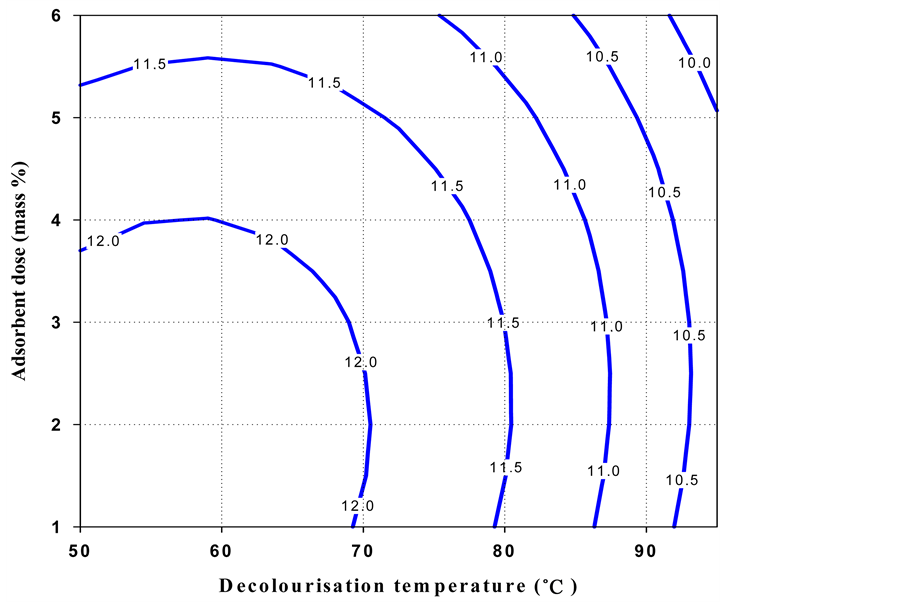
Figure 3. Contour plot of the acid value of black shea butter as a function of decolourisation temperature and adsorbent dose.
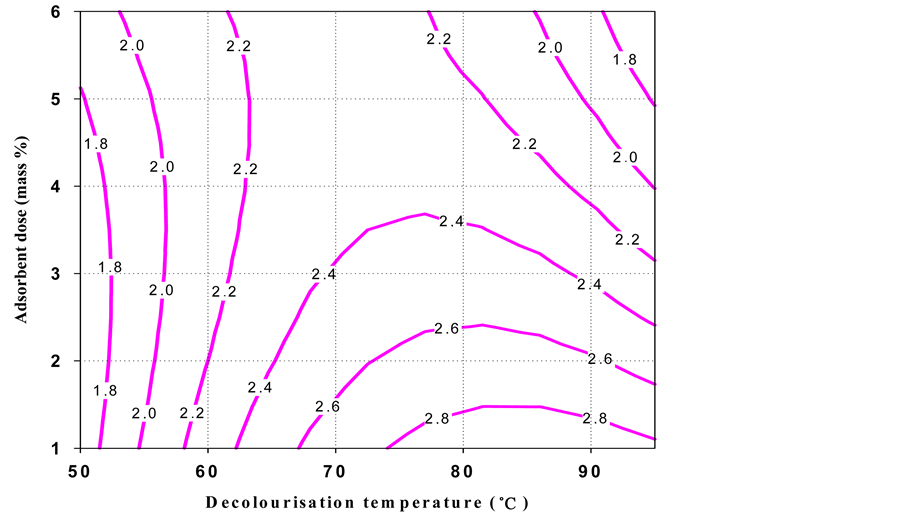
Figure 4. Contour plot of the peroxide value of black shea butter as a function of decolourisation temperature and adsorbent dose.
Numerical Optimisation
A numerical optimisation was carried out to identify the overall optimal conditions for oil loss, colour, acid value and peroxide value of shea butter. Mathcad numerical analysis was used to do this part of the work. The criteria applied for numerical optimisation included minimum oil loss (<7.0%), Lovibond colour (<3.0), acid value (<12.0%) and peroxide value (<3.0%).
3.4. Optimum Conditions
From Table 3, the decolourisation temperature and the adsorbent dose showed the ability to predict oil loss at (P < 0.05) confidence level. Using Mathcad software and the model equation 2, the optimum theoretical conditions for oil loss of black shea butter were found as follows:
If X1, X2, and X3 are contact time (5 - 60 min), decolourisation temperature (55˚C - 95˚C) and the adsorbent dosage (1 - 6 mass %) respectively, then −1, −0.866, and −0.816 are the initial coded values of X1, X2 and X3 respectively,
Given


Then the optimum condition

Accordingly the optimum oil loss = 6.23%.
Since the optimum conditions for each dependent variable do not fall exactly in the same region, the superimposition of the all contour plots obtained was done. Figure 5 shows the superimposed contour plot of oil loss
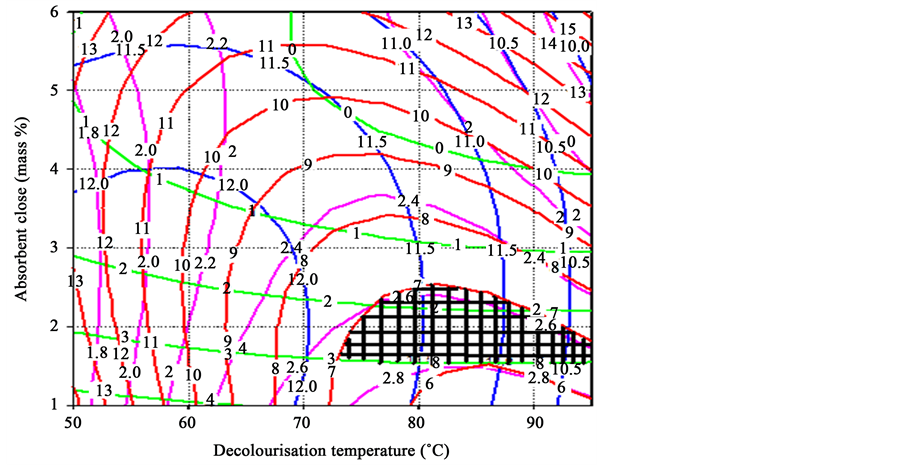

Figure 5. Overlaying contour plots for the identification of optimum decolourisation conditions of black shea butter.
(%), colour, acid value and peroxide value of black shea butter keeping the contact time constant at the central point of the domain.
The overall domain of the decolourisation temperature was considered as 72˚C - 95˚C. The main factor that affected peroxide value and acid value was decolourisation temperature. After additional confirmation experiments, 85˚C ± 2˚C was taken as optimal temperature. On the other hand, the colour and oil loss are controlled by the adsorbent dose (1.5 - 2.5 mass %), therefore some laboratory tests permitted to take 2.0 ± 0.3 mass % as the optimum value.
These optimal conditions (shaded area in Figure 1) of decolourisation process gave the following responses for black shea butter: 6.5 ± 0.9 oil loss (%), 3.3 ± 0.5 Lovibond red colour index, 11.24 ± 0.8 acid value and 2.3 ± 0.4 peroxide value.
4. Conclusion
Response surface methodology using Doehlert experimental design was successfully applied in the optimisation of decolourisation parameters of crude black shea butter. Second order polynomial models with satisfactory validation in terms of coefficient of determination (R2) and absolute average deviation (AAD) were generated and described the decolourisation process. The optimum decolourisation conditions of black shea butter were found to be: 30 min contact time, 72˚C - 95˚C decolourisation temperature and 1.5 - 2.5 mass % adsorbent dosage.
Acknowledgements
This work is supported by the French Government through EGIDE program and University of N’djamena, Chad.
Cite this paper
A. M.Mohagir,N. D.Bup,C. F.Abi,R.Kamga,R. C.Kapseu, (2015) Optimisation of Decolourisation Conditions of Crude Shea (Vitellaria paradoxa Gaertner F) Butter: Black Type. Advances in Chemical Engineering and Science,05,515-525. doi: 10.4236/aces.2015.54054
References
- 1. Kaynak, G., Ersoz, M. and Kara, H. (2004) Investigation of the Properties of Oil at the Bleaching Unit of an Oil Refinery. Journal of Colloid and Interface Science, 280, 131-138.
http://dx.doi.org/10.1016/j.jcis.2004.07.022 - 2. Boki, K., Kubo, M., Wada, T. and Tamura, T. (1992) Bleaching of Alkali-Refined Vegetable Oils with Clay Minerals. Journal of the American Oil Chemists Society, 69, 233-236.
http://dx.doi.org/10.1007/bf02635892 - 3. Sabah, E., Çinar, M. and Çelik, M.S. (2007) Decolorization of Vegetable Oils: Adsorption Mechanism of β-Carotene on Acid Activated Sepiolite. Food Chemistry, 100, 1661-1668.
http://dx.doi.org/10.1016/j.foodchem.2005.12.052 - 4. Norris, F.A. (1982) Bailey’s Industrial Oil and Fat Products. D. Swem, Ed., 4th Edition, Interscience Publishers, New York, 294-314.
- 5. Kamga, R., Kayem, J. and Rouxhet, P. (2001) Adsorption of Gossypol from Cottonseed Oil on the Oxide. Journal of Colloid and Interface, 232, 198-206.
http://dx.doi.org/10.1006/jcis.2000.7191 - 6. Hüseyin, T. (1998) Bleaching Kinetics of Sunflower Seed Oil. Journal of the American Oil Chemists’ Society, 75, 531-533.
http://dx.doi.org/10.1007/s11746-998-0260-z - 7. Falaras, P., Lezou, F., Seiragakis, G. and Petrakis, D. (2000) Bleaching Properties of Alumina-Pillared Acid-Activated Montmorillonite. Clays and Clay Minerals, 48, 549-556.
http://dx.doi.org/10.1346/CCMN.2000.0480507 - 8. Brimberg, U. (1982) Kinetics of Bleaching of Vegetable Oils. Journal of the American Oil Chemists’ Society, 59, 74-78.
http://dx.doi.org/10.1007/BF02678716 - 9. Sabah, E. and Çelik, M.S. (2005) Sepiolite: An Effective Bleaching Adsorbent for the Physical Refining of Degummed Rapeseed Oil. Journal of the American Oil Chemists’ Society, 82, 911-916.
http://dx.doi.org/10.1007/s11746-005-1164-4 - 10. Mohagir, A.M. (2003) Aqueous Extraction of Butter from Kernels of Shea Tree (Butyrospermum parkii G.Don Kotschy). M.Sc.Eng. Thesis, ENSAI (école Nationale Supérieure des Sciences Agro Industrielles), University of Ngaoundéré, Ngaoundéré, Cameroon, 87 p.
- 11. Mathieu, D. and Phan-Tan-Luu, R. (1995) Approche méthodologique des surfaces de réponse. In: Plan d’expériences “Applications à l’entreprise”, Editions Technip, Paris, 211-278.
- 12. Kumar, A., Prasad, B. and Mishra, I.M. (2007) Process Parametric Study for Ethene Carboxylic Acid Removal onto Powder Activated Carbon using Box-Behnken Design. Chemical Engineering & Technology, 30, 932-937.
http://dx.doi.org/10.1002/ceat.200700084 - 13. Annadurai, G., Juang, R.S. and Lee, D.J. (2002) Factorial Design Analysis of Adsorption of Activated Carbon on Activated Carbon Incorporated with Calcium Alginate. Advances in Environmental Research, 6, 191-198.
http://dx.doi.org/10.1016/S1093-0191(01)00050-8 - 14. Bike Mbah, J.B., Kamga, R., Nguetnkam, J.P. and Fanni, J. (2005) Adsorption of Pigments and Free Fatty Acids from Shea Butter on Activated Cameroonian Clays. European Journal of Lipid Science and Technology, 107, 387-394.
http://dx.doi.org/10.1002/ejlt.200501149 - 15. Adoum, D. (1996) Technique artisanale d’extraction dubeurre de karité à Moyen Chari sud du Tchad. Proceeding of Actes du Séminaire Atelier Oléagineux et Petites Technologies II, 23-27 Septembre 1996, “APICA, ENSAI”, Editeur: André Eberrad, 92-96.
- 16. Mohagir, A.M., Kamga, R., Kapseu, C. and Abi, C.F. (2009) Optimization of Some Pre-Treatments Involved in the Press Extraction of Shea (Vitellaria paradoxa Gaertner F.) Butter. Asian Journal of Applied Sciences, 2, 372-384.
http://dx.doi.org/10.3923/ajaps.2009.372.384 - 17. Mohagir, A.M., Ahmat-Charfadine, M., Bup, N.D., Kamga, R. and Kapseu, C. (2015) Influence of Decolourisation Condition on the Physicochemical Properties of Shea (Vitellaria paradoxa Gaertner F) Butter. Research Journal of Applied Sciences, Engineering and Technology, 9, 736-744.
- 18. SigmaPlot for Windows, Version 9.01. Systatsoftware, Inc., San Jose, CA, 2004.
- 19. AFNOR, Association Française pour la Normalisation (1981) Recueil des normes françaises, Corps gras, graines oléagineuses, produits dérivés. 2ième édition, Paris, 438 p.
- 20. ISO 15305 (1998) Animal and Vegetable Fats and Oils Determination of Lovibond Colour. In: Chinese National Standard GB 552585, 1985—Inspection of Vegetable Oils: Methods for Identification of Transparency, Colour, Odour and Taste.
- 21. Ladurelle, H. (1984) Le Beurre de karité. Thèse de Doctorat en Pharmacie, Université Scientifique et Médicale de Grenoble, Grenoble, 126 p.
- 22. Kheok, S. and Lim, E. (1982) Mechanism of Palm Oil Bleaching by Montmorillonite Clay Activated at Various Acid Concentrations. Journal of the American Oil Chemists Society, 59, 129-131.
http://dx.doi.org/10.1007/BF02662259 - 23. Nde-Aga, B., Kamga, R. and Nguetnkam, J.P. (2007) Adsorption of Palm Oil Carotene and Free Fatty Acid onto Acid Activated Cameroonian Clays. Journal of Applied Sciences, 7, 2462-2467.
http://dx.doi.org/10.3923/jas.2007.2462.2467 - 24. Henderson, J.H. (1993) A Laboratory Study of the Press Effect in Adsorptive Bleaching. Journal of the American Oil Chemists’ Society, 70, 831-835.
http://dx.doi.org/10.1007/BF02545339 - 25. Sabah, E. (2007) Decolorization of Vegetable Oils: Chlorophyll-a Adsorption by Acid-Activated Sepiolite. Journal of Colloid and Interface Science, 310, 1-7.
- 26. Morgan, D.A., Shaw, D.B., Sidebottom, M.J., Soon, T.C. and Taylor, R.S. (1985) The Function of Bleaching Earths in the Processing of Palm, Palm Kernel and Coconut Oils. Journal of the American Oil Chemists’ Society, 62, 292-299.
http://dx.doi.org/10.1007/BF02541394 - 27. Sabah, E., Çinar, M. and Çelik, M.S. (2007) Decolourisation of Vegetable Oils: Adsorption Mechanism of β-Carotene on Acid Activated Sepiolite. Food Chemistry, 100, 1661-1668.
http://dx.doi.org/10.1016/j.foodchem.2005.12.052 - 28. Mendenhall, W. (1975) Introduction to Probability and Statistics. 4th Edition, Duxbury Press, North Settuate, 273 p.
- 29. Fermeglia, M., Paricl, S. and Longo, G. (2003) Molecular Modelling and Process Simulation: Real Possibilities and Challenges. Chemical and Biochemical Engineering Quarterly, 17, 69-79.
Nomenclatures
R2 Coefficient of determination
AAD Absolute Average Deviation
Yi response function
YAv acid value (mg KOH/g oil)
YPv peroxide value (meq O2/kg oil)
YColour lovibond colour index
yi.exp experimental response
yi.cal calculated response
y yield (g/g)
t time (min)
a; b constants.
Z number of experimental run
Xi ; Xj independent variables
xi coded value
X1 contact time (min)
X2 decolourisation temperature (˚C)
X3 adsorbent dose (mass %)
b0 constant term
bi inear effect
bii quadratic effect
bij interaction effect
P probability (0.001, 0.01 and 0.05)
NOTES

*Corresponding author.