Advances in Chemical Engineering and Science
Vol.04 No.04(2014), Article ID:50729,13 pages
10.4236/aces.2014.44053
An Effective Mixing for Lithium Ion Battery Slurries
Darjen Liu1, Li-Chun Chen1, Ta-Jo Liu1*, Tan Fan1, Erh-Yeh Tsou1, Carlos Tiu2
1Department of Chemical Engineering, National Tsing Hua University, Hsinchu, Taiwan
2Department of Chemical Engineering, Monash University, Clayton, Australia
Email: *tjliu@che.nthu.edu.tw
Copyright © 2014 by authors and Scientific Research Publishing Inc.
This work is licensed under the Creative Commons Attribution International License (CC BY).
http://creativecommons.org/licenses/by/4.0/


Received 29 July 2014; revised 20 August 2014; accepted 18 September 2014
ABSTRACT
Coating slurries for making anodes and cathodes of lithium batteries contain a large percentage of solid particles of different chemicals, sizes and shapes in highly viscous media. A thorough mixing of these slurries poses a major challenge in the battery manufacturing process. Several types of mixing devices and mixing methods were examined. The conventional turbine stirrers or ball mill mixers could be adequately used for the preparation of anode slurries, but not suitable for cathode slurries. In this study, a newly three-dimensional mixer, in conjunction with a multi-stage mixing sequence was proposed. The mixing effectiveness was examined by means of rheological measurements and flow visualization techniques. Preliminary electrical performance results indicated that the battery obtained using the 3D mixing device with a multi-stage mixing sequence was more efficient to those obtained from conventional methods.
Keywords:
Lithium Ion Battery Electrode Slurries, Three-Dimensional Mixer, Flow Visualization, Battery Performance, Rheology

1. Introduction
Preparation of a good dispersion of micro- or nano-scaled powders and highly viscous polymer solutions has always been a problem for experimentalists. The uniformity of the dispersion, as assessed from its rheological behaviour, is strongly dependent on the sequence of mixing, solution preparation, mixing devices and operating conditions [1] -[6] .
In lithium batteries, the electrodes are made up of multi-component mixtures. The key component in the cathode is an active material such as LiCoO2, LiNiO2, or a three-dimensional material such as LiNiMnCoO2 [7] . The three-dimensional active material usually gives a better battery performance and has been adopted in the production of lithium batteries for the automobile industry [8] . Other components in the formulation [5] [7] generally include a binder, such as polyvinylidene fluoride (PVDF); a solvent, such as N-methyl-2-pyrrolidone (NMP); and an additive, such as carbon black, to improve the conductivity of the battery. The active material in the anode mixture is either carbon or graphite [9] , while other ingredients such as binder, solvent and conductive agents are usually the same as those in the cathode [5] [7] . The solid contents for both anode and cathode are around 50% - 70% for a standard formulation. The concentration of the binder is around 3% - 15%. Higher concentrations of the binder may improve the adhesion, but they may also deteriorate the performance of the battery.
Both electrodes are normally prepared in the form of viscous slurries in order to facilitate the downstream coating operation. A thorough mixing of the slurries is critical for the coating and drying operations, which will eventually affect the performance and quality of the batteries [1] . Therefore, a proper selection of mixing devices and mixing procedures for the electrode slurries is an essential first step towards the production of good quality batteries.
Several types of mixing devices such as ball mills, magnetic stirrers [10] [11] and magnetic stirrers with supersonic waves [2] have been examined for their effectiveness as a laboratory tool. Large scale mixers including planetary mixers [12] [13] , high speed mixers, homogenizers, universal type mixers and static mixers [14] are generally used in industry. In addition to selecting a proper mixer for the highly viscous anode and cathode slurries, the procedures of adding solid particles and binders into solvents are also critical in achieving a well dispersed slurry mixture.
Many different mixing procedures have been explored to achieve well-mixed slurries. Yang et al. [15] found that mixing the dry particles including the binder first and then adding the mixture into the solvent could be useful for prolonging the life of batteries. In contrast, Kim et al. [3] found that mixing the dry powders first, followed by adding the binders and solvents could be more effective. Lee et al. [4] examined the effects of multiple additions of solvents on the performance of a lithium battery, with the storage modulus G’ and loss modulus G” used as indicators of the results of mixing. Zhang et al. [8] studied the effects of adding a non-ionic surfactant on the dispersion of the active material LiFePO4, and found that both mixing and discharge capacity could be improved. Li et al. [16] studied the effects of adding adhesive and thickener in different steps and found that sequential addition of adhesive and thickener yielded the best mixing results for cathode slurries. For anode slurries, Zheng et al. [17] proposed mixing together the carbon black and binders in the solvent first, then using an ultrasonic device for subsequent dispersion.
Both cathode and anode materials are made of concentrated slurries. They are likely to exhibit non-Newtonian flow characteristics, which may include shear-thinning, time-dependent, and pseudo-plastic behaviours [4] [18] - [22] . Ligneel et al. [10] studied the effect of solid content on the rheological properties of anode materials, and found that yield stress became significant when the amount of solvent was gradually reduced. Several research groups [1] [2] [18] [12] - [25] analysed the mixing of lithium battery materials using ball mill mixers, and found that the solution viscosity would drop gradually and approached a stable, limiting value after a long period of mixing.
A ball mill mixer appears to be a suitable device for mixing electrode slurries, although its effectiveness is overshadowed by the long mixing time. It is therefore desirable to seek alternate mixers that can reduce the mixing time and improve the mixing efficiency. The performance of a mixer can be examined either theoretically by numerical simulation of the flow field [26] or experimentally by using a flow visualization technique and rheological measurements [27] [28] .
In the present study, a new three-dimensional mixing device was designed for electrode slurry mixing. The performance of the mixing device was examined initially by a flow visualization technique using clear solutions with a tracer. The effectiveness of mixing anode and cathode materials was then examined rheologically through shear viscosity and dynamic measurements. The resulting batteries fabricated from the slurries obtained with different mixers and mixing schemes were tested for their electrical performance.
2. Experimental
The cathode and anode slurries are usually made up of four major components. These are an active material, a conductive agent, a binder and a solvent. The active and conductive materials are solids in powder form, whose size varies from nano- to micro-scales. These solid powders are bound together with a binder in either an aqueous or an organic solvent. The organic solvent and polymer binder used in the present study were N-me- thyl-2-pyrrolidone (NMP) and polyvinylidene fluoride (PVDF), respectively [5] [7] . The most common active materials for the cathode are complex inorganic compounds containing Li ions. These include LiCoO2, LiNiO2, LiMn2O4, LiFePO4 and LiNixMnyCo1−x−yO2 [7] . Batteries produced with these active materials have shown high energy capacity, long life and high heat resistance. They have been widely used as cathode material in many consumer products and in batteries for the automotive industry [5] . The active material used in this study was LiNi0.4Mn0.4Co0.2O2 (LNMC) supplied by Shenzhen Tianjiao Technology Co. LTD. The average size of these particles is around 8 - 12 µm. Two carbon black powders: a 1.28 wt% Super-P with an average size around 40 nm, and a 2.58 wt% KS-6 with an average size around 6 µm, were chosen as the conductive agents. Both Super-P and KS-6 were supplied by Timcal Company. The total solids loading in the slurry was 63.5 wt%. The composition of LNMC was higher than 80 wt% in the total solid phase.
The conductive agent and the polymer binder used for the preparation of the anode slurry were the same as for the cathode except that the active material was replaced by a meso-phase graphite powder MGP-A with an average size of 22 µm. This material was supplied by China Steel Chemicals. Unlike the cathode slurry, only a single carbon black Super-P was used as the conductive agent for the anode. The total solid content for the anode slurry system was 54 wt%, containing over 90 wt% of MGP-A. The respective compositions of anode and cathode materials are listed in Table 1. The rheological properties of the calibrated liquids and electrode slurries were measured with ARES-2 (TA Instrument) equipped with a cone and plate system.
(a)  (b)
(b)
Table 1. Components and Concentration of Cathode and Anode Materials. (a) The components of anode slurry; (b) The components of cathode slurry.
Many types of mixing equipment were employed by the researchers in the preparation of electrode slurries. In this study, three kinds of mixing devices were used to examine the mixing effectiveness for the anode and cathode slurries. These included a simple Rushton type turbine mixer, a ball mill mixer and a specially designed three dimensional mixer. The first two mixers were used only for comparison purposes, whereas the construction and mixing behaviour of the 3-D mixer were presented in details here.
The cathode and anode slurries after mixing were coated onto aluminum and copper foils, respectively, by using an automatic transfer roll comma coater (Hirano). The electrodes travelling at a speed of 1 m/s were dried at 120˚C in a convection oven to evaporate the solvent, and then pressed through a roll press. By varying the gap of the roll coater, all electrode films were cast approximately to the same loading of active material (Cathode: 13.4 mg/cm2, Anode: 5.92 mg/cm2) in order to eliminate the thickness effect on the electrochemical performance of the electrode. The electrodes were then pressure-rolled to a predetermined thickness with their densities kept at 2.5 g/cm3 for cathode and 1.7 g/cm3 for anode.
Further drying was carried out for each electrode in a vacuum dryer for 3 h at 120˚C before the assembly of battery in a dry room. The cathode and anode were cut into rectangular films each with an area of 2.0 × 2.0 and 2.2 × 2.2 cm2 respectively. A 2.5 cm square PP/PE/PP tri-layer separator (Celgard 2320) of thickness 20 μm was placed in between the cathode and anode. The electrolyte used was 1.0 M lithium hexafluorophoshate (LiPF6) dissolved in an equal volume mixture of ethylene carbonate (EC) and ethylmethyl carbonate (EMC), together with a 2 wt% of vinylene carbonate (VC). The so-arranged cell stack was packed in an aluminum-plastic laminated film case with 160 μL electrolyte, and the exterior was then evacuated and thermally sealed.
The electrical performance of the resulting batteries were measured on a Maccor Battery Tester series 4000. The batteries were charged at 0.1 C to 4.2 V, and maintained at constant voltage of 4.2 V charging until the charge dropped to less than 0.01 C. The formation was expressed in terms of voltage/capacity profiles and the battery life was examined over 100 cycles at a charge of 1 C and voltages between 3.0 V and 4.2 V.
3. Results and Discussion
3.1. Design and Calibration of the 3-D Mixer
A major criterion of the 3-D mixer is in its ability to generate mixing in all directions. A schematic diagram of the mixer is shown in Figure 1. The mixer consists of three major parts: a rotating cylindrical glass container which provides mixing in the θ-direction, a Rushton turbine to provide r-direction mixing, and an off-centered helical ribbon-type impeller to generate mixing in the z-direction. Both the turbine and helical ribbon impeller are rotating at the same speed controlled by a common central axle. In addition, a rectangular plate is inserted near the wall region to scrape off any stagnant or slowly moving fluid during mixing. The dimensions and operating conditions of the mixer are given in Table 2. Flow visualization was carried out by attaching a video camera focused on the container to monitor the fluid motion and flow pattern. Figure 2 displays a photograph of the newly designed mixing device, together with various attachments.
The calibration of the mixer was carried out using several aqueous polyvinyl alcohol (PVA, Chang Chun petrochemical Co. LTD.) solutions of different viscosities. PVA was chosen as the calibration liquid not only that it was transparent but also behaved as a Newtonian liquid having a viscosity range similar to the steady state viscosity of the electrode slurries, i.e. around 1 to 2 Pa∙s at a nominal shear rate of 102 sec−1. This shear rate range is typical of that encountered in a slot die coating operation [3] [4] [29] . During the mixing process, a red
Table 2. Dimensions and operating parameters for the 3D mixing devices.

Figure 1. A schematic for the newly designed mixing device.

Figure 2. A photo of the 3D mixing device. (A) agitator axle; (B) tank; (C) rotational axles; (D) rotional based; (E) Rushton turbine; (F) helical ribbon impeller; (G) vertical plate.
ink was added as a tracer. The dispersion of the ink indicated the degree of mixing, which was monitored by flow visualization with a video camera.
For effective liquid mixing in a tank, the content must be able to move randomly in all directions. Initially, the mixer was tested with a PVA solution using only a single Rushton turbine attachment. A sequence of photos showing the mixing conditions at 3 time intervals is presented in Figure 3. It could be seen that the red ink tracer initially formed a spiral ring around the central shaft at the onset of the ink injection, and expanded radially outward to the cylinder wall. The mixing was primarily in r-direction. The θ-direction mixing was generated with the aid of the rotating base. This was illustrated from the movement of the red ink spot at different time intervals shown in Figure 4. Figure 5 showed the fluid motion in the mixer using only the helical impeller at-


 (a) (b) (c)
Figure 3. Fluid motion in a tank with the newly designed mixing devices installed. Mixing conditions with a Ruston turbine, the fluid motion is mainly in the r-direction. (a) t = 0 s; (b) t = 7 s; (c) t = 25 s.

 (a) (b)
 (c) (d)
Figure 4. Fluid motion in a tank with the newly designed mixing devices installed. Mixing conditions with a rotational base. Rotational speed = 6 rpm. (a) t = 0 s; (b) t = 4 s; (c) t = 8 s; (d) t = 10 s.

 (a) (b) (c)
Figure 5. Fluid motion in a tank with the newly designed mixing devices installed. Mixing conditions with a helical mixer. Mixing mainly in the z-direction. Rotational speed = 180 rpm. (a) t = 0 s; (b) t = 30 s; (c) t = 50 s.
tachment taken at 3 time intervals. The photo images clearly indicated that mixing occurred primarily in the z- direction. When a buffer plate was inserted close to the wall, any stagnant liquid was continuously scrapped off and mixed into the bulk stream. This phenomenon could be observed from various images shown in Figure 6. The newly designed 3-D mixer combined the three essential features inside the rotating cylindrical vessel. The overall performance of the 3-D mixer was demonstrated visually with images taken at 3 time intervals shown in Figure 7. As seen in Figure 7(c), complete mixing of the PVA solution was achieved within 30 seconds, which was substantially shorter than using a conventional one directional mixer. The effectiveness of mixing electrode slurries was subsequently tested using the 3D mixer.
The maximum power number, Po = P/(ρN3D5), estimated for the Rushton impeller and the helical ribbon each of diameter 3 cm and at a rotational speed of 180 rpm, was 1270, at a corresponding Reynolds number, NRe = D2Nρ/μ of 0.17. This set of data indicated that mixing was in laminar regime [30] .
3.2. Anode Slurry Mixing
The mixing of anode slurry was relatively simple compared to the mixing of the cathode slurry. The main difference of the two electrodes is the active agent. It was easier to disperse the graphite powder MGP-A in anode than the Li complex compound in cathode. The effective mixing of electrode slurries is dependent not only on the type of mixer used but also on the mixing procedure or the sequence of adding various constituents in the mixture.
Figure 8 shows the mixing strategy of the anode slurry. The mixing was carried out in our sequential steps. Initially, the liquid solution was prepared separately by gradually adding the binder PVDF to the solvent NMP, and mixed for 40 min. The solution sample was removed periodically from the mixing cylinder for viscosity measurements. As expected, the solution viscosity increased with increasing PVDF content, but exhibited mainly Newtonian characteristics as shown in Figure 9. After reaching the desired consistency, the active material


 (a) (b) (c)
Figure 6. Fluid motion in a tank with the newly designed mixing devices installed. Mixing conditions with a plate near the wall to remove the slowly moving liquid. Rotational speed = 6 rpm. (a) t = 0 s; (b) t = 38 s; (c) t = 50 s.

 (a) (b) (c)
Figure 7. Fluid motion in a tank with the newly designed mixing devices installed. Over all performance with the Ruston turbine, the helical mixer, a scraper plate and a rotational base. Rotational speed = 180 rpm. (a) t = 0 s; (b) t = 15 s; (c) t = 30 s.
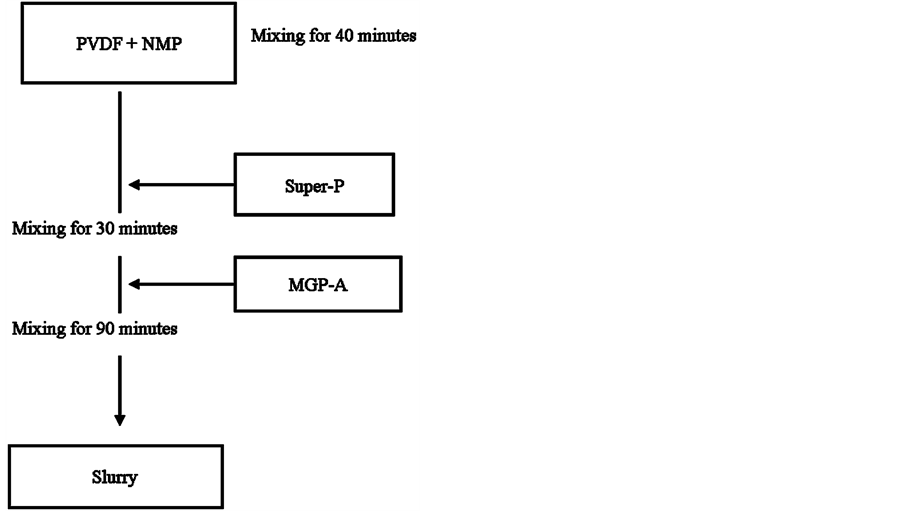
Figure 8. Mixing strategy for the anode materials with a Rushton turbine mixer.

Figure 9. Viscosity data as a function of the concentration of Super-P in the PVDF/NMP solution.
Super-P was then gradually added to the PVDF/NMP solution and mixed for another 30 min. Finally, the conductive agent MGP-A was introduced into the mixture and thoroughly mixed for further 30 min. The steady shear viscosity behaviour changed from Newtonian to highly shear-thinning with increasing amount of Super-P, as indicated in Figure 9. This behaviour was consistent with the study of Liganel et al. [10] . The shape of the viscosity curve for the mixture containing Super-P remained relatively unchanged beyond 30 min of continuous mixing. To ensure that all components in the anode slurry were thoroughly mixed, different samples were taken at various time intervals (10, 30, 60 min) and the steady shear viscosity was measured for each sample. As shown in Figure 10, very minor variations were detected among various viscosity curves measured for samples taken at different time intervals. Furthermore, no Newtonian plateau was reached despite the prolonged mixing.

Figure 10. Viscosity behavior of anode slurry mixed according the mixing steps given in Figure 8. (─ 10 min, ─ 30 min, ─ 60 min).
This indicated that the slurry mixture was already well mixed and there was no further change of structure even after only 10 minutes of mixing time. It appeared that mixing of anode slurry was relatively simple. A single Rushton turbine mixer was adequate for anode slurry mixing over a short period of time without relying on the 3-D mixer, provided the proposed mixing sequence was followed.
3.3. Cathode Slurry Mixing
As mentioned earlier, it was more difficult to disperse active material LNMC in the cathode slurry mixture. A new mixing scheme in conjunction with the 3-D mixer had to be used for this purpose.
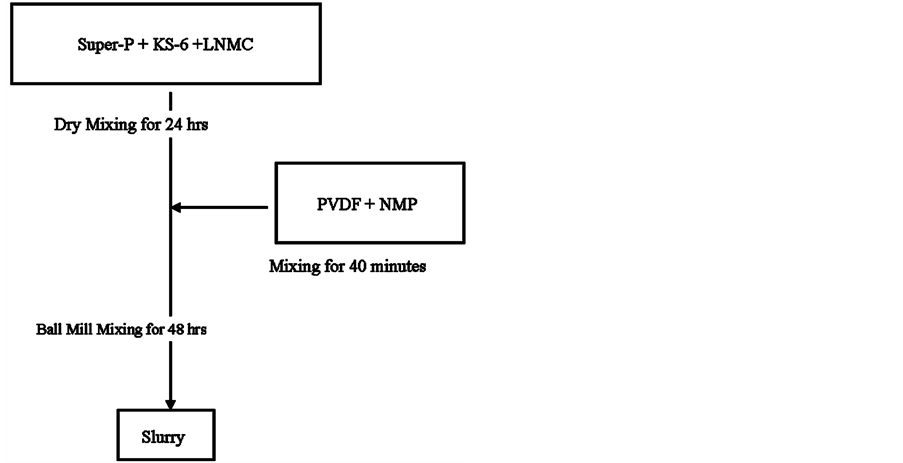
The ball mill mixer had been considered a standard mixer for the preparation of electrode slurries both in laboratory and industry [1] [23] . This mixer was initially attempted here to mix the cathode slurry using a normal mixing scheme. Figure 11(a) was an outline of the normal mixing scheme. In this scheme, the dry powders were pre-mixed together for 24 hr and then added in the solution containing the binder and solvent. The final mixing was carried out in the ball mill for 2 days. Overall, it took more than 3 days of mixing time to achieve a well-mixed sample on a ball mill mixer. It was decided to carry out the final mixing stage in the 3-D mixer. After considering various results published in the literature [4] [7] [11] [17] [25] , three different cathode slurry mixing schemes were attempted, as outlined in Figures 11(a)-(c). Figure 11(a) was the normal scheme. Figure 11(b) was the second mixing scheme in which the conductive agent, Super-P was mixed first with the solution for 30 min, then KS-6 was added for another 30 min mixing. Finally, the active material LNMC was introduced into the mixer and mixed for an hour. Figure 11(c) was the third multi-stage mixing scheme. The procedure involved mixing half of the total solids mixture with half of the solution containing binder and solvent for 30 min first, followed by mixing in the remaining solids for another 30 min. Finally the remaining half of the solution was introduced. The entire content was mixed an additional 60 min.
Figure 12 compares various viscosity data obtained with different mixing schemes and mixers. The upper two flow curves depict the viscosity behaviour of the cathode slurries obtained using different mixing schemes and mixers. One was using the third (multi-stage) mixing scheme in a single Rushton turbine mixer [■]; while the other was using the second mixing scheme in the 3-D mixer [▼]. Both curves appeared to achieve similar degree of mixing, but manifested significant shear-thinning characteristics over the shear rate range up to 1000 s−1. The lower two curves in Figure 12 represent the viscosity behaviour of the cathode slurries mixed in the 3-D [▲] and ball mill [●] mixers using the third (multi-stage) and the first (normal mixing) These two flow curves agree extremely well and both exhibit nearly Newtonian behaviour over the same shear rate range. This suggests that the cathode slurries were well-mixed and attained their final slurry consistency. Although the ball
 (a)
(a)
 (b) (c)
Figure 11. (a) Multiple addition of cathode components for the ball mill mixer; (b) Mixing schemes for the cathode materials with the 3D mixer; (c) A multiple addition mixing schemes for the cathode materials with the 3D mixer and also for the cathode materials with the simple Rushton turbine mixer.
mill mixer appeared to be adequate for mixing the cathode slurry using a multiple mixing sequence, it took a considerable longer time and energy to achieve the same result. After examining various combinations of mixing schemes and mixers, it was concluded that a most effective mixing of cathode slurries could be achieved using a multi-stage mixing scheme in the newly designed 3-D mixer.
The uniformity of the cathode slurry was further reaffirmed with dynamic property measurements of the mixed slurries. The combinations of mixing schemes and mixers were identical to those used in obtaining the viscosity data in Figure 12. Figure 13(a) shows the transient response of the shear modulus , G* = (G’2 + G”2)1/2, for the mixed cathode slurries obtained with the three mixers at a frequency of 1.0 rad/s, over a period of 300 sec. The symbols here were the same as those used in Figure 12. Initially, values of G* were very small and gradually increased with time for the samples obtained with the Rushton and the 3D mixers; whereas G* from

Figure 12. Comparison of the viscosity data based on a ball mill and the 3D mixing device. ● Ball mill mixing with the mixing scheme in Figure 11(a); ■ Rushton turbine mixing with the mixing scheme in Figure 11(b); ▼3D mixing device with the mixing scheme in Figure 11(b). ▲ 3D mixing device with the mixing scheme in Figure 11(c).

 (a) (b)
Figure 13. (a) Comparison of the transient response of the shear modulus on a ball mill, Rushton impeller and the 3D mixing device. ● Ball mill; ■ Rushton turbine; ▲ 3D mixing; (b) A replot of the Figure 13(a) in terms of stress vs. strain at a frequency of 1.0 rad/s. ● Ball mill; ■ Rushton turbine; ▲ 3D mixing.
the ball mill mixer had a finite value of around 25 Pa even at t = 10 s. Eventually, after a long period of time, values of G* for the ball mill and the 3D mixers approached each other, while the curve for the Rushton impeller deviated further away from the others. This is consistent with the steady shear viscosity results showed in Figure 12.
Figure 13(b) is a replot of the same cathode data in terms of stress vs. strain at a frequency of 1.0 rad/s. It can be seen that over the strain of 10 to 80 rad, the three curves were relatively flat, and increased rapidly beyond that point. Uhlherr et al. [31] suggested that there was a shear-induced solid to liquid transition region in yield stress or viscoplastic materials. At very low strain, the yield stress materials behaved like an elastic solid, in which the stress and strain obeyed Hooke’s Law. Then the structure began to break up at a certain yield point over a short range of strain, and changed to liquid-like behaviour, at which the stress increased with shear rate (strain/time). The plateau region gave an average yield stress value, which was a function of frequency. The present results followed exactly the same trend since the solid content of the slurry was very high (>50%). Unfortunately, the rheometer used in the current study could not sensibly obtain the stress/strain response at very low strain or time, and therefore not possible to observe the elastic solid region at very low strain. Nevertheless, following the mechanism proposed by Uhlherr et al. [31] , the yield stress of the cathode sample obtained from the Rushton and the 3D mixers was around 1 Pa, and from the ball mill was around 25 Pa. Hence, there was a difference in the internal structure of the slurry when subjected to low strain oscillation flow. At high strain, all three samples behaved like a viscous liquid and the curves for the ball mill and the 3D mixers were closer to each other.
Figure 14 and Figure 15 illustrate the electrical performance of two Li-ion batteries, one of which the electrode slurries were prepared using the conventional Rushton turbine mixer with the mixing procedure outlined in Figure 11(b) while the other using the new 3D mixer with the multi-stage mixing sequence outlined in Figure 11(c). Following the fabrication of batteries, the charge-discharge profile and the battery life was measured. Figure 14 shows the plot of voltage against the capacity. The battery was charged at 0.1 C to a voltage of 4.0 V. The upward curves shows the charged profiles of the two batteries, with the square symbol representing the one prepared from Rushton mixer and the triangular symbol from the 3D mixer. It is evident that the two charged

Figure 14. Diagram of cell charge-discharge profiles. □ Rushton turbine; △ 3D mixing device.

Figure 15. Cycling performance of the different mixing devices. □ Rushton turbine; △ 3D mixing device.
profiles are quite different. The discharged profiles obtained when the voltage was reduced to 3.0 V indicates that the capacity of the one produced the Rushton mixer dropped more rapidly than the one from 3D mixer. This suggests that the battery produced using the 3D mixer has a better capacity as a result of better particle distribution of active and conductive components in the electrodes [3] [4] . Figure 15 shows the cyclic life behavior of the batteries when they were charged at 1 C to 4.2 V and then discharged to 3.0 V, repeated for 100 times. Both batteries show relatively stable after 100 cycles, with the capacity maintained at around 135 mAh/g from the 3D mixer as compared to around 125 mAh/g from the Rushton mixer.
4. Conclusions
The effective mixing of anode and cathode materials for lithium battery was experimentally investigated in the present study. A new 3D mixer was designed, constructed and successfully applied for mixing electrode slurries, especially for the cathode slurry mixing. The device consisted of a Rushton impeller turbine, an off-center helical stirrers located inside the mixing vessel, and a rotating base. The device was able to generate fluid mixing in all directions. The effectiveness of the mixing device was verified by flow visualization and rheological measurements of a clear liquid and electrode slurries.
Mixing of anode slurry was relatively easy and could be achieved using a normal mixing procedure in a conventional mixer such as a single turbine mixer. Mixing of cathode slurry was more difficult. The most effective way of mixing the cathode slurry was using a specific multi-stage mixing scheme in a three-dimensional mixer. Preliminary electrical performance on the fabricated batteries also indicated the superiority of the proposed 3D mixer and multiple-stage mixing scheme over the conventional methods of electrode slurry preparation.
Acknowledgements
This research was supported by the Ministry of Economic Affairs R.O.C., under Grant No. 101-EC-17-A-09-S1- 198.
References
- Cheon, S.E., Kwon, C.W., Kim, D.B., Hong, S.J., Kim, H.T. and Kim, S.W. (2000) Effect of Binary Conductive Agents in LiCoO2 Cathode on Performance of Lithium Ion Polymer Battery. Electrochimica Acta, 46, 599-605. http://dx.doi.org/10.1016/S0013-4686(00)00626-5
- Ponrouch, A. and Palacin, M.R. (2011) On the Impact of the Slurry Mixing Procedure in the Electrochemical Performance of Composite Electrodes for Li-Ion Batteries: A Case Study for Mesocarbon Microbeads (MCMB) Graphite and Co3O4. Journal of Power Sources, 196, 9682-9688. http://dx.doi.org/10.1016/j.jpowsour.2011.07.045
- Kim, K.M., Jeon, W.S., Chun, I.J. and Chang, S.H. (1999) Effect of Mixing Sequences on the Electrode Characteristics of Lithium-Ion Rechargeable Batteries. Journal of Power Sources, 83, 108-113. http://dx.doi.org/10.1016/S0378-7753(99)00281-5
- Lee, G.W., Ryu, J.H., Han, W.J., Ahn, K.H. and Oh, S.M. (2010) Effect of Slurry Preparation Process on Electrochemical Performances of LiCoO2 Composite Electrode. Journal of Power Sources, 195, 6049-6054. http://dx.doi.org/10.1016/j.jpowsour.2009.12.101
- Yoshio, M., Brodd, R.J. and Kozawa, A. (2009) Lithium-Ion Batteries Science and Technologies. Springer, New York, 183-185. http://dx.doi.org/10.1007/978-0-387-34445-4
- Zheng, H., Yang, R., Liu, G., Song, X.G. and Battaglia, V.S. (2012) Cooperation between Active Material, Polymeric Binder and Conductive Carbon Additive in Lithium Ion Battery Cathode. The Journal of Physical Chemistry A, 116, 4875-4822.
- Li, J., Daniel, C. and Wood, D. (2011) Materials Processing for Lithium-Ion Batteries. Journal of Power Sources, 196, 2452-2460. http://dx.doi.org/10.1016/j.jpowsour.2010.11.001
- Zheng, H., Tan, L., Liu, G., Song, X.G. and Battaglia, V.S. (2012) Calendering Effects on the Physical and Electrochemical Properties of Li[Ni1/3Mn1/3Co1/3]O2 Cathode. Journal of Power Sources, 208, 52-57. http://dx.doi.org/10.1016/j.jpowsour.2012.02.001
- Yoo, M., Frank, C.W. and Mori, S. (2003) Interaction of Poly(Vinylidene Fluoride) with Graphite Particles. 1. Surface Morphology of a Composite Film and Its Relation to Processing Parameters. Chemistry of Materials, 15, 850-861. http://dx.doi.org/10.1021/cm0209970
- Ligneel, E., Lestriez, B. and Guyomard, D. (2007) Relationships between Processing, Morphology and Discharge Capacity of the Composite Electrode. Journal of Power Sources, 174, 716-719. http://dx.doi.org/10.1016/j.jpowsour.2007.06.158
- Ligneel, E., Lestriez, B., Hudhomme, A. and Guyomard, D. (2007) Effects of the Solvent Concentration (Solid Loading) on the Processing and Properties of the Composite Electrode. Journal of the Electrochemical Society, 154, A235- A241. http://dx.doi.org/10.1149/1.2431316
- Tanguy, P.A., Thibault, F., Dubois, C. and Aitkadi, A. (1999) Mixing Hydrodynamics in a Double Planetary Mixer. Chemical Engineering Research and Design, 77, 318-324.
- Zhou, G., Tanguy, P.A. and Dubois, C. (2000) Power Consumption in a Double Planetary Mixer with Non-Newtonian and Viscoelastic Materials. Chemical Engineering Research and Design, 78, 445-453.
- Morishima, H. (2008) Method of Producing Electrode and Method of Producing Nonaqueous Electrolyte Battery. US Patent, US 20080102196 A1.
- Yang, C.Y., Cheng, C.H., Jo, S.M., Chen, J.C. and Hung, W.M. (1997) Performance Study of the LiCoO2/Graphite System. Journal of Power Sources, 68, 440-442. http://dx.doi.org/10.1016/S0378-7753(97)02590-1
- Li, C. and Lin, Y. (2012) Interaction between Organic Additives and Active Powders in Water-Based Lithium Iron Phosphate Electrode Slurries. Journal of Power Sources, 220, 413-421. http://dx.doi.org/10.1016/j.jpowsour.2012.07.125
- Zhang, W.J., He, X., Pu, W., Li, J. and Wan, C. (2011) Effect of Slurry Preparation and Dispersion on Electrochemical Performances of LiFePO4 Composite Electrode. Ionics, 17, 473-477. http://dx.doi.org/10.1007/s11581-011-0560-4
- Despotopoulou, M. and Burchill, M.T. (2002) Coatings for Electrochemical Applications. Progress in Organic Coatings, 45, 119-126. http://dx.doi.org/10.1016/S0300-9440(02)00105-4
- Usui, H., Kishimoto, K. and Suzuki, H. (2001) Non-Newtonian Viscosity of Dense Slurries Prepared by Spherical Particles. Chemical Engineering Science, 56, 2979-2989. http://dx.doi.org/10.1016/S0009-2509(00)00476-0
- Cho, K.Y., Kwon, Y.I., Youn, J.R. and Song, Y.S. (2013) Interaction Analysis between Binder and Particles in Multiphase Slurries. Analyst, 138, 2044-2050. http://dx.doi.org/10.1039/c3an36720g
- Stickel, J.J. and Powell, R.L. (2005) Fluid Mechanics and Rheology of Dense Suspensions. Annual Review of Fluid Mechanics, 37, 129-149. http://dx.doi.org/10.1146/annurev.fluid.36.050802.122132
- Mustafa, H.U., Ishizuki, M., Shige, I. and Suzuki, H. (2003) Rheological Characteristics of Non-Spherical Graphite Suspensions. Korea-Australia Rheology Journal, 15, 19-25.
- Li, C.C. and Wang, Y.W. (2011) Binder Distributions in Water-Based and Organic-Based LiCoO2 Electrode Sheets and Their Effects on Cell Performance. Journal of the Electrochemical Society, 158, A1361-A1370. http://dx.doi.org/10.1149/2.107112jes
- Jeon, B.H., Yeon, J.H., Kim, K.M. and Chung, I.J. (2002) Preparation and Electrochemical Properties of Lithium-Sulfur Polymer Batteries. Journal of Power Sources, 109, 89-97. http://dx.doi.org/10.1016/S0378-7753(02)00050-2
- Belliard, F. and Irvine, J.T.S. (2001) Electrochemical Performance of Ball-Milled ZnO-SnO2 Systems as Anodes in Lithium-Ion Battery. Journal of Power Sources, 97-98, 219-222. http://dx.doi.org/10.1016/S0378-7753(01)00544-4
- Jiang, A.M., Li, G.C. and Tian, A.P. (2012) Modelling of the Mixing of Composite Solid Propellant Slurry in a Kneading Mixer. Advanced Materials Research, 490, 3334-3338. http://dx.doi.org/10.4028/www.scientific.net/AMR.490-495.3334
- Woziwodzki, S., Broniarz-Press, L. and Ochowiak, M. (2010) Transitional Mixing of Shear-Thinning Fluids in Vessels with Multiple Impellers. Chemical Engineering Technology, 33, 1099-1106. http://dx.doi.org/10.1002/ceat.201000121
- Adachi, N., Hashiba, M. and Sakurada, O. (2004) Rheological Properties of Slurries Prepared Using a Planetary Mixer. Ceramics International, 30, 1055-1058. http://dx.doi.org/10.1016/j.ceramint.2003.11.008
- Usui, H. (2003) Rheological Characteristics of Non-Spherical Graphite Suspensions. Korea-Australia Rheology Journal, 15, 19-25.
- Perry, R.H. and Green, D.W. (2007) Perry’s Chemical Engineering’s Hand Book. 7th Edition, McGraw-Hill, New York, 1449-1451.
- Uhlherr, P.H.T., Guo, J., Tiu, C., Zhang, X.M., Zhou, J.Z.Q. and Fang, T.N. (2005) The Shear-Induced Solid-Liquid Transition in Yield Stress Materials with Chemically Different Structures. Journal of Non-Newtonian Fluid Mechanics, 125, 101-119. http://dx.doi.org/10.1016/j.jnnfm.2004.09.009
NOTES

*Corresponding author.