Atmospheric and Climate Sciences
Vol. 2 No. 1 (2012) , Article ID: 17131 , 7 pages DOI:10.4236/acs.2012.21011
Spectral Variations of AOD and Its Validation Using MODIS: First Cut Results from Kannur, India
1Department of Physics, Sir Syed College, Kannur, India
2Department of Physics, Government Brennen College, Thalassery, India
3Department of Atmospheric Sciences, Kannur University, Kannur, India
Email: *praseedkm@rediffmail.com
Received November 8, 2011; revised December 9, 2011; accepted December 22, 2011
Keywords: Aerosol; MICROTOP; MODIS; Meteorological Parameters; Kannur
ABSTRACT
The properties of aerosols present in the atmosphere are often influenced by the environment in which they are being disbursed. Subsequently, the variation in the environmental conditions may severely affect the aerosol size and distribution. Thus it is quite exciting to investigate the spatial and temporal variations of AOD that are being affected by the significant changes in the environment to a large extent. This paper presents preliminary observations of diurnal variation of Aerosol Optical Depth (AOD) over two distinct locations in Kannur, India. The AOD over a location which has strong marine influence shows the presence of coarse particles while that on a valley of Western Ghats reveals the combined influences of both land and the ocean. The correlation between AOD measured from the ground and that retrieved from MODIS is fairly good. The AODs retrieved from ground based observation is validated with that estimated from MODIS in the context of meteorological parameters observed during the period of this observation.
1. Introduction
Aerosols are miniature particles in solid or liquid phase suspended in the air. Some occur naturally, originating from volcanoes, windblown dust, forest and grassland fires, living vegetation and sea spray. They occur over a wide range of sizes extending from 10–3 µm to about 102 µm. Aerosol particles larger than about 1 µm in size are produced by windblown dust and sea salt from sea spray. Aerosols smaller than 1 µm are mostly formed by condensation processes such as conversion of sulphur dioxide gas which is released from volcanic eruptions to sulphate particles and by formation of soot and smoke during burning processes.
Atmospheric aerosols are major climatic forcing agents. In the atmosphere, aerosols play a vital role in the radiation budget directly by scattering and absorption of solar radiation [1-3]. They scatter solar radiation back to space thereby enhancing the planetary albedo and exerting a negative (cooling) climate forcing. Aerosols also indirectly cause a negative climate forcing through formation of clouds and influence cloud lifetime. On the other hand, they cause positive feedback (warming) by absorbing reflected radiation from the earth’s surface, and preventing them from escaping to space [4,5]. The direct and indirect effects of atmospheric aerosols on radiative forcing and cloud physics are strongly dependent on particle size characteristics and chemical composition [6-8]. In addition, they are responsible for visibility impairment and have significant implications for human health [9].
The basic parameter that determines the aerosol loading in the atmosphere is the column Aerosol Optical Depth (AOD) which is a measure of extinction of solar radiation while propagating through a column of atmosphere. The AODs are usually found to be higher during hazy days, moderate during partially clear days and low on clear-sky days. Apart from its varied physico-chemical characteristics, the atmospheric aerosols also have a large spatial as well as temporal variability. Extensive research on aerosols are being pursued in India under a consistent network programme launched by Indian Space Research Organization Geosphere Biosphere Program (ISRO-GBP) to explore annual and inter-annual variability of aerosol parameters [10,11]. This has been materialized by using an indigenously built Multi Wavelength solar Radiometer (MWR), which has been employed since 1980. Presently these studies are carried out in various geographical regions: urban, semi urban, coastal region, over oceans [12-15] as well as in the ecologically delicate Himalayan regions [10,16-19] of India. Over the Arabian Sea and Indian Ocean, AOD analysis is conceded using Advanced Very High Resolution Radiometer (AVHRR) data [20-25] during Indian Ocean Experiment (INDOEX), which shows a significant inter annual variations in spectral AODs. Satellite measurements provide large spatial coverage and long-term data on aerosol and trace gas measurements, despite their accuracies caused due to the precise retrieval [26].
In the present study, diurnal variations of AOD on clear sky days in February 2011 were investigated over two locations, a coastal site and on the valley of a hill station at Kannur. Further, validation of MODIS sensor derived AODs and MICROTOP derived AODs was carried out by regression analysis of data retrieved for the same wavelength of solar radiation.
2. Theory
The aerosol optical depth spectrum can be fitted by a power law of the type [27].
 (1)
(1)
in which the wavelength λ is expressed in µm. The wavelength exponent α describes the spectral behaviour of the optical depth which is a good indicator of their size or of the fraction of the fine mode aerosols in the atmosphere [28] and the coefficient, β is a measure of the vertical column burden of aerosols and is classified as AOD at λ = 1 µm. The natural logarithm of (1) yields
 (2)
(2)
α can be computed for any region using the expression:
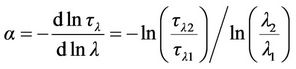 (2a)
(2a)
where τλ1 and τλ2 are the AODs for two different wavelengths λ1 and λ2. From this expression α is retrieved by taking the negative slope or the negative of the first derivative of τλ versus wavelength (λ) in logarithmic scale. In general, α is found to reduce with the enhancement in particle size. For coarse-mode soil particles, magnitude of α is nearly zero, whilst it varies from 1 to 3 for fine-mode particles of anthropogenic origin. Thus, the magnitude of α depends strongly on the wavelength region selected for its determination. Different α values determined in various spectral bands were already reported by various authors [29]. Some of the studies revealed negative values of α obtained in the visible (VIS) and near-infrared (NIR) region of the solar spectrum [30].
3. Observational Site and General Meteorology
The observations were made in Kannur District which is located in the northern part of Kerala State. We have selected two locations, one at Kannur University Campus (KUC) and other at Paithalmala, a pristine hill station in the Western Ghats near Kerala-Karnataka border and the atmosphere in these locations is weakly subjected to industrial impact. KUC is situated very close to the Arabian Sea and at an elevation of 5 m from mean sea level. The air distance to KUC is about 4 km and that to the Western Ghats is 50 km. The land area of Kannur is about 3000 km2 with an average population density of 1000 per square kilometers. KUC is situated in an open land to receive plenty of sunshine throughout the day without any shadows, and the land is surrounded with a good amount of vegetation. We selected a another location at Paithalmala, which is a pristine hill station in the Western Ghats near Kerala-Karnataka border and the atmosphere over this location is feebly influenced to industrial activities. Being a hill which is positioned at a height of 1372 m above sea level, the morning sky is quite clear while in the evening, casting of clouds over this location may wrap the sun frequently. Hence the AODs measured beyond 1600 hr (IST) were not included in this study. The geographical map of the locations is shown in Figure 1.
The most prominent meteorological feature at this location is the monsoon rainfall occurring in two spells during a year. The south-west monsoon is quite active during the months of June, July and August, and this intense

Figure 1. Schematic layout of the observational sites.
rainfall over this region has been classified as the southwest Monsoon Season. This is followed by the return monsoon or north-east monsoon which lasts till November. Hence September, October and November are earmarked as the post-monsoon (autumn) season with some scattered showers accompanied with heavy thunder and lightning. The intensity of summer is masked by the south-west monsoon season over the entire region. About 80% of the total rainfall occurs from June to August which constitutes the main monsoon season. The period from December to March records the maximum sunshine hours of more than 9 - 10 hours/day due to the clear sky and the minimum from June-August due to cloudy sky conditions. During the first phase of the monsoon season (June-August), winds are stronger and the circulation is southwesterly-westerly (from ocean to land), by which this site experiences heavy rainfall. The southwesterlywesterly wind gets weakened by September and northeasterly wind starts in November. The wind direction continues to be northeasterly until February, when the air flow is mostly from the continent. The months, December, January and February with scanty amount of rain and relatively low humidity constitute the winter season at this site, while from March to May the turn goes to summer which scorches with high convective activities on the surface. Being a coastal belt, the land breeze and sea breeze have a significant impact on the transport of aerosols over this region. The sea breeze usually sets in the noon time around 1200 hr (IST) and lasts till late evening. Figure 2 shows the monthly mean variations of meteorological parameters like relative humidity, temperature, wind speed and direction at Kannur in the month of February 2011.
4. Instrument Used for the Study
Spectral AODs were measured by a hand-held multiband Sun Photometer (MICROTOPS II) of Solar Light Company, USA (2002) and the details of the instrument is described extensively [31]. The instrument is equipped with five accurately aligned optical collimators, with a full field view of 2.5˚. Internal baffles are integrated into the device to eliminate internal reflections. AODs at wavelengths centered at 340, 440, 500, 675, 870 and 1020 nm were directly retrieved from instantaneous solar flux measurements using its internal calibration; the typical error in AOD measurement using a MICROTOPS II Sun Photometer is quite low [31]. Each channel is fitted with a narrow-band interference filter (with a full width half maximum band width is 5 - 10 nm) and a suitable photodiode is used for the detection of the solar intensity in a particular wavelength range. Data were collected daily from 03:30-11:30 hr UTC (09:00-17:00 hr, IST) at 30 minutes intervals. A Global positioning System (GPS) receiver attached with the photometer pro-
 (a)
(a) (b)
(b) (c)
(c)
Figure 2. Diurnal variations of (a) maximum and minimum relative humidity; (b) Maximum and minimum temperature; (c) Wind speed and wind direction at Kannur during February 2011.
vides geographical details. Extreme care was taken during the collection of AOD data so as to avoid the strong seasonal effects such as strong wind, cloudy sky and drizzle. Thus data collected only on clear sky conditions were included in this analysis.
In this study, we present diurnal variations of spectral AOD measured at KUC and Paithalmala on clear sky days in February 2011. The Angstrom parameters associated with this were estimated to identify the nature of aerosols present over the respective locations. Further, validation of observed AOD and MODIS derived AOD for one year was carried out to investigate the correlation between them. We could collect ground based AOD data for a total of 169 days of which only 57 clear sky day’s data were processed for making a comparison with MODIS data. This is due to the presence of frequent cloudy days at Kannur. However, the maximum number of clear sky days available in Kannur is in February during which this observation was conducted.
5. Observations
5.1. Diurnal Variation of AOD at KUC and Paithalmala on a Typical Day in February 2011
At the KUC, the peak observed in AOD during the midday hours could be attributed to the local convective activity leading to a change in aerosol particle number distributions. On the other hand, a slight enhancement in AOD was observed in the other two lower wavelengths during afternoon hours. Moreover, a sharp enhancement in AOD was found during 1530 hr (IST) at 340 nm, which results in horizontal advection of pollution leading to higher aerosol column content. These results are in the general agreement with those reported earlier by different investigators [12]. The magnitudes of α and β are found to be 0.935 and (0.146 ± 0.03) respectively which indicates the dominance of coarse mode aerosols over KUC. This may be due to the dominance of marine aerosols which are hygroscopic in nature.
From Figure 3, it is clear that the AOD over two locations are found to show more or less of the same pattern, except a sharp increase at Paithalmala at 1330 hr (IST). This may be due to the impact of sea breeze which used to set here at 1200 hr by which coarse particles may be transported to this hill region. Moreover, the convective activities on the surface may transport dust to this pristine location. While at KUC, which is close to the proximity of the Arabian Sea, marine influence is more dominant
 (a)
(a)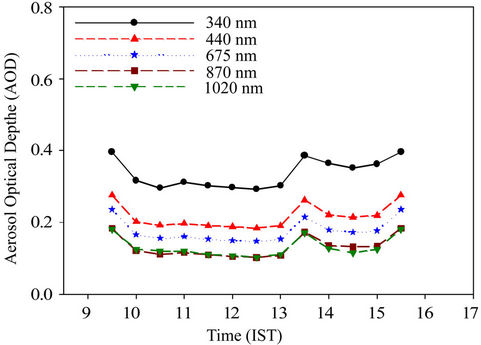 (b)
(b)
Figure 3. Diurnal variation of AOD at (a) KUC and (b) Paithalmala.
at all times and thus the abundance of coarse particles is much higher. But in hilly areas, the combined effect of land breeze and sea breeze is more pronounced than at a location which is much influenced by marine environment. Likewise, the magnitude of α at Paithalmala is higher than that at KUC (α =1.242 and β = 0.121 ±.01) which implies the domination of fine mode particles at this location. Figure 4 illustrates the contour plots of diurnal profile of AOD at theses two locations.
5.2. Validation with MODIS Data
The Moderate Resolution Imaging Spectroradiometer (MODIS) on board the Earth Observing System (EOS) Terra and Aqua satellites [32] provides a unique opportunity in deriving spectral information of aerosol parameters over land in the visible wavelength region. MODIS is a remote sensor on board two Earth Orbiting Systems, Terra and Aqua satellites. These satellites operate at an altitude of 705 km with Terra spacecraft crossing the equator at about 1030 hr (IST) and Aqua space craft crossing the equator at about 1330 hr (IST). In the present study, validation of MODIS sensor derived AODs (level-3 MODIS-Aqua ver. 5.1 atmosphere daily global data product aerosol optical depth at 550 nm at 1˚ × 1˚ grid) was attempted by comparing it with the MICROTOP derived data at the same wavelength. MICROTOP derived AOD at 440 nm was applied to evaluate AOD at 550 nm using linear interpolation technique in power law [33] as under
 (3)
(3)
where α was estimated from MICROTOP derived AODs in the visible spectra ranging from 340 to 675 nm. Thus the AOD derived from the MICROTOP for the wavelength 550 nm is plotted with that derived from MODIS and the scatter plot is shown in Figure 5.
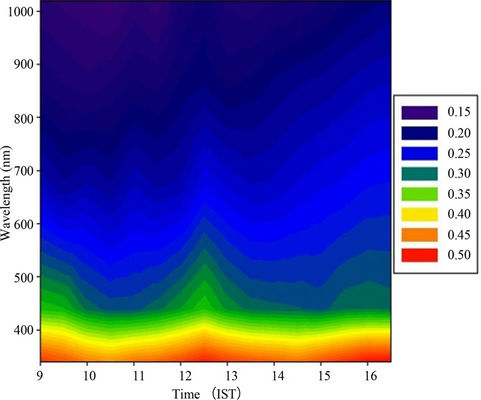 (a)
(a) (b)
(b)
Figure 4. Contour plots showing the diurnal variation of AOD at (a) KUC (b) Paithalmala.

Figure 5. Scatter plot showing daily) AODs derived from MICROTOP and MODIS (Aqua) over Kannur.
6. Result and Discussion
Ground based measurement of AOD at two locations in Kannur shows some distinctions based on their geographical features. At a hill region, the influence of both land and the sea is more pronounced while along the coastal belt, marine influence is more dominant.
Statistical analysis revealed a close agreement between AOD from Aqua satellite and the daily averaged AOD from MICROTOP interpolated, at 550 nm. The Karl Pearson’s correlation coefficient between (MICROTOP) AOD and (MODIS)AOD is found to be 0.914, an attempt was made to fit a regression line between (MICROTOP) AOD and (MODIS)AOD, The estimated values of the yintercept and slope from the regression are 0.025 and 1.047 respectively, so that the regression equation becomes
 (4)
(4)
The t-test for the significance of the regression coefficient reveals that the sample regression coefficient (1.047) does not differ significantly from the ideal value (the calculated value of “t” is 0.735 which is less that 1.96 the 5% critical value of t). The slope slightly higher than unity, during the period of observation indicates an over estimate of AOD by MODIS with respect to MICROTOP retrieval. The slight difference may be due to the selection of spatial coordinates for retrieval of satellite data.
7. Conclusion
The correlation shows a good agreement with the data derived out of the two independent measurements over a specific location and supportive well within the instrument uncertainties. This study further reveals that MODIS data is equally precise in the determination of AOD over this location compared to ground based measurement of AOD using sun photometers. The α and β values obtained during this study indicate the need of further microscopic analysis to reveal the size distribution of the particles.
8. Acknowledgements
This work has been carried out with the financial support of the Kerala State Council for Science, Technology and Environment (KSCSTE) in the form of a project allotted to the Department of Atmospheric Science, Kannur University.
REFERENCES
- Y. Kaufman, “Smoke Cloud and Radiation Experiment in Brazil (SCAR-B),” Journal of Geophysical Research, Vol. 103, No. D24, 1998, pp. 31783-31808. doi:10.1029/98JD02281
- R. J. Charlson, S. E. Schwartz, J. M. Hales, R. D. Cess, J. A. Coakley Jr., J. E. Hansen and D. Hoffmann, “Climate Forcing by Anthropogenic Aerosols,” Science, Vol. 255, No. 5043, 1992, pp. 423-440. doi:10.1126/science.255.5043.423
- M. O. Andreae, “In World Survey of Climatology, Future Climates of the World,” In: A. Henderson-Sellers, Ed., Elsevier, New York, Vol. 16, 1995, pp. 341-392.
- Y. J. Kaufman, D. Tanre and O. Boucher, “A Satellite View of Aerosols in the Climate System,” Nature, Vol. 419, No. 6903, 2002, pp. 215-223. doi:10.1038/nature01091
- U. Lohmann and J. Feichter, “Global Indirect Aerosol Effects: A Review,” Atmospheric Chemistry and Physics, Vol. 5, No. 3, 2005, pp. 715-737. doi:10.5194/acp-5-715-2005
- D. A. Hegg, P. V. Hobbs, S. Gasso, J. D. Nance and A. L. Rango, “Aerosol Measurements in the Artic Relevant to Direct and Indirect Radiative Forcing,” Journal of Geophysical Research, Vol. 101, No. 9, 1996, pp. 23349- 23363. doi:10.1029/96JD02246
- J. M. Haywood, D. L. Roberts, A. Slingo, J. M. Edwards and K. Shine, “General Circulation Model Calculations of the Direct Radiative Forcing by Anthropogenic Sulphate and Fossil Fuel Soot Aerosol,” Journal of Climate, Vol. 10, No. 7, 1997, pp. 1562-1577. doi:10.1175/1520-0442(1997)010<1562:GCMCOT>2.0.CO;2
- D. Muller, U. Wandinger and A. Ansmann, “Microphysical Particle Parameters from Extinction and Backscatter Lidar Data by Inversion with Regularization: Theory,” Applied Optics, Vol. 38, No. 12, 1999, pp. 1981- 1999.
- R. Kumar, S. S. Srivastava and K. M. Kumari, “Characteristics of Aerosols over Suburban and Urban Site of Semiarid Region in India: Seasonal and Spatial Variation,” Aerosol and Air Quality Research, Vol. 7, No. 4, 2007, pp. 531-549.
- K. K. Moorthy, S. K. Satheesh and K. Murthy, “Characteristics of Spectral Optical Depths and Size Distributions of Aerosols over Tropical Oceanic Regions,” Journal of Atmospheric and Solar-Terrestrial Physics, Vol. 60, No. 10, 1998, pp. 981-992. doi:10.1016/S1364-6826(98)00044-3
- B. H. Subbaraya, A. Jayaraman, K. K. Moorthy and M. Mohan “Atmospheric Aerosol Studies under ISRO-GBP,” J. Ind. Geophys. Un, Vol. 4, 2000, pp. 77-90.
- P. C. S. Devara, G. Pandithurai, P. E. Raj and S. Sharma, “Investigations of Aerosol Optical Depth Variations Using Spectroradiometer at an Urban Station, Pune, India,” Journal of Aerosol Science, Vol. 27, No. 4, 1996, pp. 621-632. doi:10.1016/0021-8502(95)00550-1
- K. K. Moorthy, S. K. Satheesh and B. V. Krishna Murthy, “Investigations of Marine Aerosols over the Tropical Indian Ocean,” Journal of Geophysical Research, Vol. 102. No. D15, 1997, pp. 18827-18842. doi:10.1029/97JD01121
- K. Parameswaran, P. R. Nair, R. Rajan and M. V. Ramana, “Aerosol Loading in Coastal and Marine Environments in the Indian Ocean during Winter Season,” Current Science India, Vol. 91, 1999, pp. 1053-1061.
- P. Pant, P. Hegde, U. C. Dumka, A. Saha, M. K. Srivastava and R. Sagar, “Aerosol Characteristics at a High Altitude Location during ISRO-GBP Land Campaign-II,” Current Science India, Vol. 76, 2006, pp. 947- 955
- A. Jayaraman, “Aerosol Radiation Cloud Interactions over the Tropical Indian Ocean Prior to the Onset of the Summer Monsoon,” Current Science India, Vol. 81, No. 11, 2001, pp. 1437-1445.
- K. K. Moorthy, K. Niranjan, B. Narasimhamurthy, V. V. Agashe and B. V. Krishna Murthy, ISRO-GBP Scientific Report 03-99, 1999.
- S. S. Moorthy, S. K. Satheesh, K. K., Babu and C. B. S. Dutt, “Integrated Campaign for Aerosols, Gases and Radiation Budget (ICARB): An Overview,” Journal of Earth System Science, Vol. 117, No. 1, 2008, pp. 243- 262. doi:10.1007/s12040-008-0029-7
- N. L. Sharma, J. C. Kuniyal, M. Singh, M. Sharma and R. P. Guleria, “Characteristics of Aerosol Optical Depth and Ångström Parameters over Mohal in the Kullu Valley of Northwest Himalayan Region,” India Acta Geophysica, Vol. 59, No. 2, 2011, pp. 334-360. doi:10.2478/s11600-010-0046-1
- K. Rajeev, V. Ramanathan and J. Meywerk, “Regional Aerosol Distribution and Its Long Range Transport over the Indian Ocean,” Journal of Geophysical Research, Vol. 105, No. D2, 2000, pp. 2029-2043. doi:10.1029/1999JD900414
- F. Li and V. Ramanathan, “Winter to Summer Monsoon Variation of Aerosol Optical Depth over the Tropical Indian Ocean,” Journal of Geophysical Research, Vol. 107, No. D16, 2002, p. 4284. doi:10.1029/2001JD000949
- S. K. Nair, K. Rajeev and K. Parameswaran, “Wintertime Regional Aerosol Distribution and the Influence of Continental Transport over the Indian Ocean,” Journal of Atmospheric and Terrestrial Physics, Vol. 65, No. 2, 2003, pp. 149-165. doi:10.1016/S1364-6826(02)00215-8
- V. Ramanathan, P. J. Crutzen, J. Lelieveld, A. P. Mitra, D. Althausen, J. Anderson, M. O. Andreae, W. Cantrell, G. R. Cass, C. E. Chung, A. D. Clarke, J. A. Coakley, W. D. Collins, W. C. Conant, F. Dulac, J. Heintzenberg, A. J. Heymsfield, B. Holben, S. Howell, J. Hudson, A. Jayaraman, J. T. Kiehl, T. N. Krishnamurti, D. Lubin, G. McFarquhar, T. Novakov, J. A. Ogren, I. A. Podgorny, K. Prather, K. Priestley, J. M. Prospero, P. K. Quinn, K. Rajeev, P. Rasch, S. Rupert, R. Sadourny, S. K. Satheesh, G. E. Shaw, P. Sheridan and F. P. J. Valero, “Indian Ocean Experiment: An Integrated Analysis of the Climate and the Great Indo-Asian Haze,” Journal of Geophysical Research, Vol. 106, No. D22, 2001, pp. 28371-28398. doi:10.1029/2001JD900133
- S. K. Satheesh, V. Ramanathan, X. L. Jones, J. M. Lobert, I. A. Pod-gorny, J. M. Prospero, B. N. Holben and N. G. Loeb, “A Model for the Natural and Anthropogenic Aerosols for the Tropical Indian Ocean Derived from Indian Ocean Experiment Data,” Journal of Geophysical Research, Vol. 104, No. D22, 1999, pp. 27421-27440. doi:10.1029/1999JD900478
- S. K. Satheesh and K. K. Moorthy, “Radiative Effects of Natural Aerosols: A Review,” Atmospheric Environment, Vol. 39, No. 17, 2005, pp. 2089-2110. doi:10.1016/j.atmosenv.2004.12.029
- F. Vachon, A. Royer, M. Aube, B. Toubbe, N. T. O’Neill and P. M. Teillet, “Remote Sensing of Aerosols over North American Land Surfaces from POLDER and MODIS Measurements,” Atmospheric Environment, Vol. 38, No. 21, 2004, pp. 3501-3515. doi:10.1016/j.atmosenv.2004.01.046
- A. Ångström, “Techniques of Determining the Turbidity of the Atmosphere,” Tellus, Vol. 8, No. 2, 1961, pp. 214-223.
- G. L. Schuster, O. Dovobik and B. N. Holben, “Angstrom Exponent and Bimodal Aerosol Size Distribution,” Journal of Geophysical Research, Vol. 111, 2006, Article ID: D07207. doi:10.1029/2005JD006328
- T. F. Eck, B. N. Holben, J. S. Reid, O. Dubovik, N. T. O’Neil and S. Kinnie, “Wavelength Dependence of the Optical Depth of Biomass Burning, Urban and Desert Dust Aerosols,” Journal of Geophysical Research, Vol. 103, 1999, pp. 31333-31349. doi:10.1029/1999JD900923
- Z. D. Adeyewa and E. E. Balogun, “Wavelength Dependence of Aerosol Optical Depth and the Fit of the Ångström Law,” Theoretical and Applied Climatology, Vol. 74, No. 1-2, 2003, pp. 105-122. doi:10.1007/s00704-002-0707-3
- I. Ichoku, R. Levy, Y. J. Kaufman, L. A. Remer, R. R. Li, V. J. Mar-tins, B. N. Holben, N. Abuhassan, I. Slutsker, T. F. Eck and C. Pietras, “Analysis of the Performance Characteristics of the Five-Channel Microtops II Sun Photometer for Measuring Aerosol Optical Thickness and Precipitable Water Vapor,” Journal of Geophysical Research, Vol. 107, No. D13, 2002, p. 4179. doi:10.1029/2001JD001302
- I. A. Remer, et al., “The MODIS Aerosol Algorithm, Products and Validation,” Journal of Atmospheric Science, Vol. 62, 2005, pp. 947-973. doi:10.1175/JAS3385.1
- A. K. Prasad, S. Singh, S. S. Chauhan, M. K. Srivasthava, R. P. Singh and R. Singh, “Aerosol Radiative Forcing over the Indo-Gangetic Plains during Major Dust Storms,” Atmospheric Environment, Vol. 41, 2007, pp. 6289-6301. doi:10.1016/j.atmosenv.2007.03.060
NOTES
*Corresponding author.