Open Journal of Geology
Vol.07 No.03(2017), Article ID:75002,12 pages
10.4236/ojg.2017.73024
Petrology and Geochemistry of Igneous Rocks in Zarinkamar Area, NE of Shahrood, Iran
Ebrahim Nazemi1, Mohammad Ali Arian1*, Abdoreza Jafarian2, Mohsen Porkermani1
1Department of Geology, Faculty of Science, North Tehran Branch, Islamic Azad University, Tehran, Iran
2Department of Geology, Islamic Azad University, Shahrood Branch, Shahrood, Iran

Copyright © 2017 by authors and Scientific Research Publishing Inc.
This work is licensed under the Creative Commons Attribution International License (CC BY 4.0).
http://creativecommons.org/licenses/by/4.0/


Received: October 22, 2016; Accepted: March 27, 2017; Published: March 30, 2017
ABSTRACT
Zarinkamar area is located in northeast of Shahrood, northeast of Iran, between latitudes of 36˚37’ - 36˚42’ and longitudes of 55˚07’ - 55˚12’. Different types of igneous rocks have an outcrop on the region. Intrusive igneous rocks include a type of syenite with aegirine pyroxene and the other includes quartz from 5 to 20 percent. Moreover, aegirine syenite, ordinary syenite, and quartz syenite have been injected into Karaj Formation with an age of middle to early Eocene. Also, some parts of trachyte magma have given rise to produce trachyte outcrops after passing the crust and current flows. Studying major and rare elements shows that a magma separation has been caused by separation smelting or a crystal separation. These magmas are alkaline and shoshonites and they have been originated in a continental rift. The magma of Zarinkamar region has been combined with acidic continent crust as it rose to the surface. High amount of Th, and Rb and low amount of Ti, P, Sr, and Ba can prove this hypothesis.
Keywords:
Zarinkamar, Sharood, Syenite, Trachyte

1. Introduction
Study area is located 28 km northeast of Shahrood in Semnan province in Iran. As far as geological classification of Iran is concerned, the area belongs to eastern Alborz zone. This zone is a subzone of northern part of Alp-Himalia orogeny belt in Western Asia. It is also collided with Caspian block and central Iran block toward north and south, respectively. Based on the geochemical databases and related geochemical figures of major, rare and cation figures, the composition of the magma is classified as Alkaline and Shoshonite magma. As far as petrological issue is concerned, the rocks include intrusive rocks, alkali feldspar aegirine syenite, alkali feldspar quartz syenite and volcanic rocks (e.g. tracite and crystalline silica) which specifies that the tectonic regime of these rocks are continental alkaline rifts with a depletion of Eu (negative anomaly). Based on geochemical studies and related geochemical figures, Eu shows a negative anomaly which is related to plagioclase separation. Also, the magma shows a concentration of LREE/HREE. A concentration of LREE is one of the specifications of OIB showing a presence of garnet in a magma resource. La/Yb is about 6.16 to 8.8 and La/Sm is approximately 2.98 to 3.49; also a notable negative anomaly of Eu is considered (Eu/Eu* = 0.05 − 0.69). Based on the geochemical database and related figures of major and rare elements, the magma of Zarinkamar region is classified as an alkaline and Shoshonite magma which consists of syenite, syenite alkali feldspar with quartz, and syenite quartz. The pattern of related normalized to diagonal values of the rare elements demonstrate the concentration of lithophile elements with high ion radius (LILE) of Th, K, and Rb; while, the elements with high ionic strength (HFSE) show depletion. A negative anomaly of Ti, P, Sr, and Ba shows a fractional crystallization and lack of depletion of Nb-Ta illustrates Shoshonite masses which have been originated within continent environments. Also, their tectonic source of these rocks is continental alkaline rifts.
2. Petrography
2.1. Alkali Feldspar Quartz Syenite
Linear alkali feldspar with long and stretched shapes which has been getting gray and dusty color has been identified in thin sections, they are almost similar and in the same size. Also, some of them have kept their primitive shape and shown a simple macle. Their frequencies are about 90 to 95 percent which have crossed each other. Pyroxenes (acmite and aegirine) have been identified among them with a dark and olive green color to brownish green color with a zonal condition and semi shaped frame which all of them show a zonal condition vividly. Quartz has been placed in residual spaces among minerals as micro crystalline with a frequency of 5 percent and it shows a hypidiomorphic intergranular (Figure 1).

 (PPL) (XPL)
Figure 1. Microscopic image of Alkali feldspar aegirine quartz syenite.
2.2. Alkali Feldspar Aegirine Quartz Syenite
Elongated minerals of feldspars are often gray and dusty and show a simple macle with a regular shape and different size. The macles are usually crossed each other and they normally have been altered and become kaolinitized. Their frequencies are approximately 80 to 90 percent. Quartz crystalline appears in a shaped and hypidiomorphic formation among vacant spaces among minerals and their frequency is about 10 to 15 percent. Pyroxenes are in light to dark green colors in a stockwork texture with small to big crystalline which the bigger the pyroxenes are, the better zoning and vertical cleavage properties are identified. Apart from pyroxene, amphiboles are appeared with inclined cleavage with a green to brown and dark green color which all of them are macro crystalline with angled and amorphous shapes. Ferrous minerals are in dark red which are amorphous and mostly in stockwork texture with angled shapes. According to the thin-section interpretation, this sample has hypidiomorphic intergranular texture (Figure 2).
3. Geochemistry
After plotting geochemical databases of the samples on QAP [1] figure, sample (A.23) with a value of Q=0 has been set to the alkali feldspar syenite class and sample C.02 has been set to alkali feldspar granite with a value of Q = 14.77 in their norms; rest of samples have been set to quartz alkali feldspar syenite group (Figure 3). Also, based on the diagram of (Na2O+K2O) versus (SiO2) [2] , the samples within syenite class have ranged from semi acidic to alkaline groups (Figure 4). Based on the diagram of K2O versus SiO2 [3] , the rocks in sample A.01 has been classified in tholeiitic part and A.02 sample has been set to an upper part of K2O; the rest of samples have been classified in shoshonites part (Figure 5). Based on the diagram of Ab-An-Or [4] , sample A.01 has been classified in a sodic region and rest of samples have been classified in potassic region (Figure 6). The total value of alkaline values in igneous rocks in ZarinKamar region is 10.54 and the ratio of K2O to Na2O is about 0.87 to 1.015. Also the value of TiO2 is about 0.8 to 0.011 and the average value of Al2O3 is 12.3. As far as the diagrams of major elements versus SiO2 [5] are concerned, CaO shows a reduc-
 (PPL) (XPL)
Figure 2. Microscopic image of alkali feldespar quartz aegirinesenyite in Zarinkamar region.

Figure 3. The figure classifying intrusive igneous rocks saturated in silica (AQP diagram) [1] .

Figure 4. The diagrams introducing extrusive igneous rocks based on TAS method [2] .
ing trend versus SiO2 which can illustrate the separation process and it had been consumed in the minerals such as pyroxene, sphene, titanite, calcite and epidote. FeO (and Fe total) shows a decreasing trend which determines a separation

Figure 5. Diagram of K2O versus SiO2 [3] .

Figure 6. An-Ab-Or diagram classifying alkaline igneous rocks (Sodic from potassic) [4] .
process and it also has taken part in the opaque mineral structures like pyroxene, and ilmenite. The source of magma with a high potassium causes an increase on K2O versus SiO2. Also, potassic minerals (e.g. alkali feldspar) show an increasing trend as SiO2 increases. The phenomena can be seen on microscopic sections by the presence of plenty of alkali feldspar. Also, this trend can be related to remaining potassium in the final step of magma separation and concentrating on feldspar phases. MgO reduces versus SiO2. Mg is a consistent element and this reduction explains a more magma separation process and it shows that the rock has faced more separation phases and it is far away from its parent. Na2O shows a decreasing trend versus SiO2 which has been consumed in the structure of alkali feldspars and sodic pyroxenes (acmite) (Figure 7). Pyroxene is a key fractionating phase in alkaline magmatic systems and has the potential to control the behaviour of the rare metals (REE + HFSE) during crystallization [6] .
K2O and SiO2 increment and CaO and MgO reduction show a magma separation and generally it can be concluded that the rocks in Zarinkamar region have passed a magma separation phase [7] . As separation phase expands, the percentage of ferromagnesium minerals like olivine and pyroxene content decreases while feldspar concentration increases significantly. Na2O increases and SiO2 decreases as separation phase continues. They finally contribute in the structure of silicate minerals (e.g. alkaline feldspar) and residual SiO2 of quartz is produced inconsiderably which can be seen on thin sections. Al2O3 shows a decreasing trend as the separation phase continues. Al2O3 has positioned in alkaline feldspar minerals (e.g. Albite, orthoclase, anorthoclase, and microcline). CaO concentration was low in the primitive phases and it increased as separation phase developed. It is consistent with presence of pyroxene in the final process of separation. K2O content in Zarinkamar magma which is a high potassic magma is controlled by alkaline feldspar minerals (i.e. potassium feldspar). K2O

Figure 7. Geochemical database of Zarinkamar samples on the major elements versus SiO2 diagram [5] .
was high in the beginning of the separation and it decreases as separation pro- cess develops and it dropped to its minimum content in the final stages of the separation and it locates finally in the crystalline structure. Total iron content increases as separation phase expands and it reaches to its maximum concentration at the final stages of the separation process and it contributes in ferrous mineral compositions (Figure 8).
K, Th, Rb, Nb, Hf, Zr, Sm, Y are concentrated in the rocks of Zarinkamar region and Ba, Sr, P, Ti are depleted in these samples. High content of Rb is related to Shoshonite properties and it also may relate to contamination with crust. Solubility of titanium minerals decreases as pressure increases in aqueous fluids. These minerals can be remained as residual phases during partial melting pro- cesses in the depth of over 30 km and it causes a negative anomaly in the melt [9] . Based on a theory [10] , LREE concentration in the rocks shows an intervention of continental crust on forming the magma (Figure 9).
In the normalized multi elements of spider diagram related to chondrite [11] , Ba, Sr, P, and Ti elements show depletion and Rb, Th, La, Ce, and Nd show concentration. The high amount of Rb, and Th and low amount of Ba, Sr, P, and Ti are consistent with crust properties which shows that crust materials have made some impurities during magma evaluation. Sr also enters to feldspar structures and Rb is placed in the potassium feldspar structure. Based on the theory raised by [12] , negative anomalies of Ba, Sr, P, and Ti shows fractional crystallization and non-depletion of Nb-Ta shows a source of Shoshonite masses formed mainly within inter continent environment (Figure 10).
In the normalized diagrams to the REE chondrite [13] , LREE to HRE shows a moderate concentration (Figure 11). Concentration of LREE is the unique specification of OIB which shows presence of residual garnet in the source. N (La/Yb) = 6.16 - 8.8 and N (La/Sm) = 2.98 - 3.49 and negative anomaly of Eu

Figure 8. Geochemical database of Zarinkamar samples on the major elements versus separation coefficient [6] .

Figure 9. Normalized spider diagram related to MORB [8] .
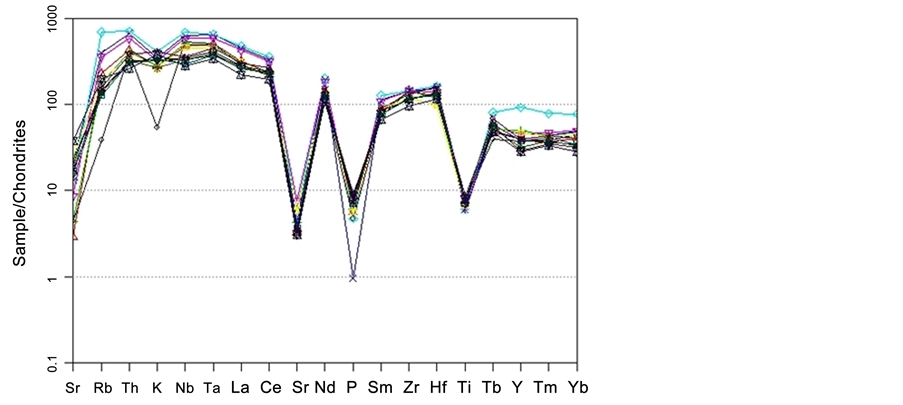
Figure 10. Spider diagram related to chondrite [11] .

Figure 11. Spider diagram of normalized REE to the chondrite [13] .
(Eu/Eu* = 0.05 - 0.69), Figure 12, are notable. Figure 13 shows that all the samples have been placed within a negative anomaly of Eu. Eu anomalies are often controlled by feldspars since Eu is stable in its bivalency in calcium feldspars; while, other trivalent REE are inconsistent in calcium feldspars. Therefore, separating calcium feldspar from the melting phase can lead to a negative anomaly of Eu in the magma either the separation has been caused by crystalline separation or partial separation (which feldspar is remained in the magma). The Eu

Figure 12. Diagram of Eu/Eu* versus SiO2 [16] .

Figure 13. Diagram of Ta versus Yb [17] .

Figure 14. Triplex diagram of Y-Nb-Ce [A1: Continental rift or inter-plate magma; A2: Continent-continent collision or island-arc magma] [18] .

Figure 15. Tectonic position of rock samples in Zarrinkamar region [19] .
depletion is probably because of plagioclase removal from the source or later discarding by fractional crystallization in the magma chamber prior to emplacement [14] . Also, the absence of plagioclase in the macroscopic samples proves the negative anomaly of Eu in samples [15] .
4. Tectonomagmatic Environments
In the diagram of Yb versus Ta [17] , rock samples have been placed in the interplate tectonic region (Figure 13). Also, in the triplex diagram of Y-Nb-Ce [18] which consists of two parts, A1, and A2, all samples have been placed in A1 part which is the interpolate magma or continental rifts (Figure 14). Based on the Figure 15 the samples have been placed as interpolate continent alkaline rifts.
5. Conclusions
A small and limited magmatism of trachyte have taken place at Zarinkamar region, north east of Shahrood with the age of middle Eocene. The raised magma had been frozen in the host rocks and types of syenite have been formed. This magma could also get to surface and it caused a limited trachyte flows.
Agirine syenite of Zarinkamar region is generally elongated alkaline feldspars with semi to fully shaped formation which are often crossed each other.
Agirine with an almost vertical cleavage (87 degree) has been placed within feldspars which their origin is shoshonite. As far as diagrams related to sodic and potassic alkaline igneous rocks are concerned, A.01 has been placed in the tholeiitic region and the rest of the samples have been placed in the potassic region. Based on Harker diagrams, Zarinkamar rocks have passed magma separation process. In comparison to inter-oceanic basalts, Zarinkamar rocks are concentrated in K, Th, Rb, Nb, Hf, Zr, Sm, and Y and depleted from Ba, Sr, P, and Ti. High concentration of Rb can be related either to Shoshonite properties or mixing with earth crust. In the normalized multi element (to chondrite) spider diagram, related values of the samples to the chondrite showed depletion of Ba, Sr, P, and Ti and concentration of Rb, Th, La, Ce, and, Nd. High content of Rb and Th and low content of Ba, Sr, P, and Ti are consistent with magmas related to the earth crust. The elements in the earth crust have been contaminated during magma evaluation. In the rock samples of Zarinkamar LREE to HREE shows a moderate concentration which LREE concentration is the specification of OIB. (La/Sm) N was 2.98 - 3.49 and a negative anomaly of Eu is notable (Eu/Eu* = 0.05 - 0.69). Eu anomalies are usually controlled by feldspars since Eu in its bivalent is consistent with calcium feldspars while other triplex REEs are inconsistent with feldspars. Therefore, separation of calcium feldspar from magma leads to a negative anomaly of Eu whether it is provided by crystalline or partial separation. The absence of plagioclase in the microscopic samples confirms the negative anomaly of Eu. According to the tectonomagmatic diagrams, the rock samples have been placed within interpolate environments and inter-continental rifts.
Cite this paper
Nazemi, E. and Arian, M.A., Jafarian, A. and Porkermani, M. (2017) Petrology and Geochemistry of Igneous Rocks in Zarinkamar Area, NE of Shahrood, Iran. Open Journal of Geology, 7, 348-359. https://doi.org/10.4236/ojg.2017.73024
References
- 1. Streckeisen, A. (1974) Classification and Nomenclature of Plutonic Rocks. Geologische Rundschau, 63, 773-786.
https://doi.org/10.1007/BF01820841 - 2. Cox, K.G., Bell, J.D. and Pankhurst, R.J. (1979) The Interperatation of Ignouse Rock. George Allen and Unwin, London.
https://doi.org/10.1007/978-94-017-3373-1 - 3. Peccerillo, A. and Taylor, S.R. (1976) Geochemistry of Eocene Calc-Alkaline Volcanic Rocks from the Kastamonu Area, Northern Turkey. Contributions to Mineralogy and Petrology, 58, 63-81.
https://doi.org/10.1007/BF00384745 - 4. Irvine, T.N. and Baragar, W.R.A. (1971) A Guide to the Chemical Classification of the Common Volcanic Rocks. Canadian Journal of Earth Sciences, 8, 523-548.
https://doi.org/10.1139/e71-055 - 5. Harker, A. (1909) The Natural History of Igneous Rocks. Methuen, London, 348 p.
- 6. Beard, C., van Hinsberg, V., Stix, J. and Wilke, M. (2016) Aegirine-Melt Element Partitioning in Alkaline Magmatic Systems.
https://www.researchgate.net/publication/303106053 - 7. Karimipour, M.H. (1998) Petrology of Igneous Rocks and Magmatic Deposits. Mashhad Publication, Mashhad, Iran.
- 8. Pearce, J.A. (1983) Role of the Sub-Continental Lithosphere in Magma Gensis at Active Continental Margins. In: Hawkesworth, C.J. and Norry, M.J., Eds., Continental Basalts and Mantle Xenoliths, Shiva, Nantwich, 230-249.
- 9. Glenn, A.G. (2004). The Influence of Melt Structure on Trace Element Partitioning Near the Peridotite Solidus. Contributions to Mineralogy and Petrology, 147, 511-527.
https://doi.org/10.1007/s00410-004-0575-1 - 10. Wilson, M. (1989) Igneous Petrogenesis: A Global Tectonic Approach. Unwin Hyman, London, 466 p.
https://doi.org/10.1007/978-1-4020-6788-4 - 11. Thompson, R.N. (1982) Magmatism of the British Tertiary Volcanic Province. Scottish Journal of Geology, 18, 49-107.
https://doi.org/10.1144/sjg18010049 - 12. Li, X.H., Zhou, H.W., Liu, Y., Lee, C.Y., Sun, M. and Chen, C.H. (2000) Shoshonitic Intrusive Suite in SE Guangxi: Petrology and Geochemistry. Chinese Science Bulletin, 45, 653-659.
https://doi.org/10.1007/BF02886045 - 13. Nakamura, N. (1974) Determination of REE, Ba, Fe, Mg, Na and K in Carbonaceous and Ordinary Chondrites. Geochimica et Cosmochimica Acta, 38, 757-775.
- 14. Niktabar, S.M., et al. (2015) Petrogenesis of the Lalezargranitoid Intrusions (Kerman Province-Iran). Journal of Sciences, Islamic Republic of Iran, 26, 333-348.
- 15. Nazemi, E. (2013) Petrology and Geochemistry Intrusive Rocks Located in the Square Zarinkamar 1: 100,000 Khoshyeilagh. M.S. Thesis, Department of Geology, Islamic Azad University of Shahrood, Shahrood, Iran.
- 16. Brady, J.B., and Cheney, J.T. (2004) The Cape Ann Plutonic Suite: A Field Trip for Petrology Classes. In: Hanson, L.S., Ed., Guidebook to Field Trips from Boston, MA to Saco Bay, ME, New England Intercollegiate Geological Conference, 96th Annual Meeting, Salem, Massachusetts, B5, 1-26.
- 17. Pearce, J.A., Harris, N.W. and Tindle, A.G. (1984) Trace Element Discrimination Diagrams for the Tectonic Interpretation of Granitic Rocks. Journal of Petrology, 25, 956-983.
https://doi.org/10.1093/petrology/25.4.956 - 18. Eby, G.N. (1992) Chemical Subdivision of the A-Type Granitoids: Petrogenetic and Tectonic Implications. Geology, 20, 641-644.
https://doi.org/10.1130/0091-7613(1992)020<0641:CSOTAT>2.3.CO;2 - 19. Cabanis, B. and Lecolle, M. (1989) Le diagramme La/10 – Y/15 – Nb/8: Un outil pour la discrimination des series volcaniques et en evidence des mélange et/ot de vontamination crustale. Comptes Rendus de l'Académie des Sciences, Série II, 309, 2023-2029.