Journal of Geoscience and Environment Protection
Vol.08 No.06(2020), Article ID:100851,14 pages
10.4236/gep.2020.86001
Total Trihalomethane Levels in Major Watersheds across the United States
Kaleh Karim1,2, Sujata Guha1, Ryan Beni1*
1Department of Chemistry, Tennessee State University, Nashville, TN, USA
2Department of Biological Sciences, Tennessee State University, Nashville, TN, USA

Copyright © 2020 by author(s) and Scientific Research Publishing Inc.
This work is licensed under the Creative Commons Attribution International License (CC BY 4.0).
http://creativecommons.org/licenses/by/4.0/


Received: April 2, 2020; Accepted: June 9, 2020; Published: June 12, 2020
ABSTRACT
Trihalomethanes, such as chloroform, bromoform, dibromo(chloro)methane, and bromo(dichloro)methane, are present in the major watersheds across the United States. These chemicals play an important role in the development of cancer, have adverse reproductive outcomes, and were found to be present above the threshold established by the Environmental Protection Agency. To understand the impact of socioeconomic background on the quality of water and possible disparities, we have analyzed the levels of total trihalomethanes in the metropolitan areas in the major watersheds across the United States, in 2018, as they correlated to average household incomes. Our study found that Arkansas, Nevada, and Rhode Island demonstrated higher than federally mandated levels of total trihalomethanes in their watersheds. The median annual household and per capita incomes of the three states (Arkansas, Nevada, and Rhode Island) were lower than the national average. In addition, Delaware, New Hampshire, and Wisconsin, which had higher median income levels, demonstrated the lowest total trihalomethane levels across the United States.
Keywords:
Total Trihalomethanes, Contaminants, Watersheds, Household Income, Income per Capita, Environmental Justice, Chlorination

1. Introduction
Drinking water is often derived from groundwater or surface water. However, these water bodies all drain into drainage basins along with rain runoff and melted snow ( The Physical Environment, 2003 ). A watershed is a topographic region that drains into a river, lake, or stream ( What Is a Watershed and Why Should I Care?, 2012 ). Watersheds can essentially act as a funnel for collecting water from surrounding rivers, lakes, bays, sub-watersheds or any other water bodies, and drain them into a larger water basin. Considering the flow of water, it is empirical to examine the composition of water bodies as they integrate and play a significant role in the distribution of contaminants.
Total organic halides, present in raw water, are the main precursors for the formation of trihalomethanes ( Jung & Son, 2008 ). Hence, watersheds containing large volumes of total organic compounds are more susceptible to the presence of higher levels of trihalomethanes ( Babcock & Singer, 1979 ). The presence of humic acid is shown to contribute to very high levels of bromoform formation during the ozonation process of water disinfection ( Huang et al., 2005 ). According to the Environmental Protection Agency (EPA), chlorinated water contains varying trihalomethane levels ( Symons, 1975 ), and concentration of these carcinogens may vary depending on water composition ( Guha et al. 2019 ). In addition to water acidity or alkalinity, algal abundance can also contribute to the elevation of organic precursors that can further react with chlorine residues to form trihalomethanes ( Saunders et al., 2015 ).
Epidemiological studies have attributed various reproductive health anomalies to the consumption of water containing trihalomethanes and deemed it as a carcinogenic chemical ( Symons, 1975 ). Scientists have demonstrated a positive correlation between trihalomethane oral consumption and an array of sexual abnormalities in rats including toxicity to fetus ( Thompson et al., 1974 ), embryonic death and anomalies in the sperm formation ( Klinefelter et al., 1995 ). Human research has been limited; however, a handful of investigators have determined similar reproductive anomalies in human subjects ( Waller et al., 1998 ; Grazuleviciene et al., 2011 ). Exposure to trihalomethanes can slightly increase one’s susceptibility to colorectal and bladder cancers ( Villanueva et al., 2017 ; Klaassen, 2019 ), and cause major organ damage ( World Health Organization, 2004 ).
Due to the obvious health burden as a result of exposure to trihalomethanes, the EPA has established the “Stage 1 Disinfectants/Disinfection Byproducts Rule” to enforce the maximum allowable annual average to remain below 80 parts per billion (ppb) ( Environmental Protection Agency, 2001 ). However, raw water and watersheds are not regulated by the EPA. If present in watersheds, trihalomethanes may navigate into drinking water source interfering with the water treatment process. In addition, communities with unregulated water source, such as rural areas, are more susceptible to consuming water contaminated with trihalomethanes which calls for water laws that are more efficient in ensuring feasible clean water for all citizens. Environmental justice seekers continue to shed light on the expansion of infrastructure that ensure the availability of clean, regulated water to all citizens, regardless of socioeconomic background or location ( Freyfogle, 1986 ). Studies have shown that overwhelming amount to toxic chemical as a result of industrial use is released in locations populated with low income communities calling this practice “environmental racism” ( Collins et al., 2016 ). In addition, infrastructure for the treatment and disposal of toxic waste tends to also be built in low-income communities ( Mohai & Saha, 2015 ). In Tennessee, lower income communities were shown to have higher levels of trihalomethane presence albeit being below federally mandated regulations ( Guha et al., 2019 ).
In order to address the disparities in attaining justified distribution of water, investigators have formulated framework studies to elaborate on the existing environmental inequalities, attributing them to sociocultural factors, and have attempted to offer possible remedies ( Zwarteveen & Boelens, 2014 ). To our knowledge, there have not been any studies conducted to explore the relation between the levels of trihalomethanes and median household incomes in the watersheds affecting metropolitan cities across the United States. Our research is the first of its kind to explore trihalomethane concentrations in the most densely populated metropolitan city in each state, during 2018, in an attempt to evaluate watershed conditions across the country. In this manner, our research provides novelty and adds to the existing literature on contaminants affecting water quality in different areas of the United States. The data obtained will be used to analyze watershed health and uncover any disparities that may be present in the levels of total trihalomethanes between metropolitan areas with different median household incomes. The information provided by our research will also be useful in educating and empowering people from low-income communities, and with enable them to take appropriate measures about the water quality affecting their areas.
2. Materials and Methods
Secondary data related to the concentrations of trihalomethanes was obtained from the annual water safety report for the metropolitan area watersheds across United States for 2018 ( City of Dallas Water Quality Report, 2018 ; The City of Fargo, 2008 ; City of White Plains, 2018 ; West Virginia American Water, 2019 ; Baton Rouge Water Company, 2018 ; Central Arkansas Water, 2018 ; Minneapolis Public Works, 2018 ; Fulton County, 2019 ; Department of Water, County of Kaua’I, 2019 ; Allen County Water District, 2018 ; Mariposa County Public Works Department, 2018 ; Miami-Dade County, 2018 ; Massachusetts Water Resources Authority, 2018 ; New York City, 2018 ; Manchester Water Works, 2018 ; Salt Lake City Department of Public Utilities, 2019 ; City of St. Louis Water Division, 2019 ; Town of Bernalillo, 2018 ; Yarmouth Water District, 2018 ; City of Arvada, 2018 ; Charlotte Water, 2018 ; Milwaukee Water Works, 2018 ; City of Florence, 2018 ; Gallatin Local Water Quality District, 2018 ; Georgetown Water Department, 2019 ; Mississippi State Department of Health, 2018 ; Polk City Government, 2018 ; City of Port Orchard, 2019 ; Anchorage Water & Wastewater Utility, 2019 ; Burlington Water, 2018 ; City of Cheyenne, 2018 ; Denver Water, 2019 ; Fairfax Water, 2019 ; City of Fort Lauderdale, 2018 ; City of Goddard, 2019 ; Grand Forks Government, 2018 ; Greenville Water, 2018 ; Public Works, Lake County Illinois, 2018 ; Louisville Water, 2018 ; Las Vegas Valley Water District, 2019 ; Minnehaha Community Water Corp, 2018 ; SUEZ Idaho Operations, 2018 ; Metro Water Services, 2018 ; Oklahoma City Utilities Department, 2018 ; Philadelphia Water Department, 2018 ; City of Phoenix Water Services Department, 2018 ; Portland Water Bureau, 2019 ; Providence Water, 2018 ; Regional Water Authority, 2018 ; City of Detroit Water & Sewerage Department, 2018 ; Washington Suburban Sanitary Commission, 2018 ). Additional information was collected by contacting water service offices to obtain information not readily available in the annual water safety report. The molecular structures of trihalomethanes are shown in Figure 1 ( Jung & Son, 2008 ; Singer & Chang, 1989 ; Bellar & Lichtenberg, 1974 ; Rook, 1974 ).
Scheme 1 shows how trihalomethanes are formed via the famous haloform reaction ( March & Smith, 2007 ; Fuson & Bull, 1934 ).
Data including median annual household income was obtained from the United States Census Bureau ( United States Census Bureau, 2020 ). The water quality data was then prepared for descriptive statistical analysis. Histograms were used to illustrate the levels of total trihalomethanes in metropolitan areas across the United States for 2018. Tables were generated to record income per capita for the metropolitan city of each state (provided by the Census Bureau)

Figure 1. Molecular structure of common trihalomethanes in watersheds. From left: Chloroform; Bromoform; Dibromo(chloro)methane; and Bromo(dichloro)methane. Green = chlorine; Grey = carbon; White = hydrogen; Red = bromine.
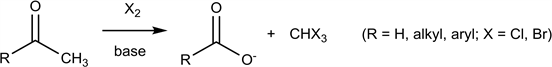
Scheme 1. Formation of trihalomethanes via haloform reaction.
and their watersheds and sources (provided by the state and local water services departments), and correlated to the levels of trihalomethanes. The disparities among the average household income in different counties and their water quality are shown using multi-variable charts.
3. Results and Discussion
The water chemistry and composition of raw water can be influenced by many factors including human activity and wildlife population surrounding the water source. The water source or watersheds can be comprised of different types of water bodies including aquifers, lakes, rivers, creeks and reservoirs. The concentration of fulvic and humic acids present in these water bodies highly influences the level of total trihalomethanes present due to chlorination of potable water. Regardless of water source or raw water composition, trihalomethanes levels must not exceed federally mandated levels. Each state must follow federal and state laws to ensure the availability of clean, regulated water to all citizens, regardless of socioeconomic background or location. Table 1 shows the watersheds or water source in the metropolitan city of each state in the United States.
As shown in Figure 2, three states (Rhode Island, Arkansas and Nevada) demonstrated the highest levels of trihalomethanes across the nation. Water sources or watersheds for these states included lakes, creeks and reservoirs indicating that the types of water source did not play a significant role in the level of total trihalomethanes.
Although the EPA sets the standard for maximum allowable level for total trihalomethanes at 80 ppb, the data for the metropolitan cities of Rhode Island, Arkansas and Nevada proved to be in violation of the federally mandated regulations.
When examining the median annual household income and income per capita (Table 2) for these three states in violation, it was determined that two (Arkansas and Nevada) out of the three states had income that was significantly lower than the national average household income of $60,330, as provided by the United States Census Bureau. In addition, three states (Delaware, New Hampshire, and Maryland) with the lowest levels of total trihalomethanes belonged to higher income groups, as they had median annual household income and income per capita above or at the national average (Figure 3).
These disparities in total trihalomethane levels in correlation to income levels are in conjunction with water justice inequalities that have been previously investigated by scientists and environmentalists. Our findings that lower income communities face injustice obtaining and sustaining high water quality agree with previous investigations ( Collins et al., 2016 ; Mohai & Saha, 2015 ; Guha et al., 2019 ). In order to overcome such disparities among households in obtaining and sustaining clean drinking water, the water quality information should be shared with the public, so that they can be better informed. A concerted effort must be made by federal agencies, such as the Environmental Protection Agency, Department of Agriculture, and the Army Corps of Engineers, to collaborate with community-based organizations and bridge water-based community needs. Various steps have been suggested ( Vanderwarker, 2013 ), such as priorities being set by governmental agencies to create specific action plans with time frames for communities facing inequalities in water quality, collaboration of federal agencies with state and local governments, and other stakeholders, to address water-related environmental justice issues, incorporating social, economic, and community health factors into the decision-making processes, and taking proactive steps to ensure purposeful public participation, such as providing information in languages apart from English. Additionally, the methods of data collection and assessment of threats within aquifers and groundwater systems should be improved, and sufficient funding should be allocated to ensure program maintenance. The rapidly growing risks of climate change, such as flooding and

Table 1. Watersheds or water source in the metropolitan city of each state.

Figure 2. Average total trihalomethane (TTHM) concentration measured in parts per billion (ppb) in major watersheds across the United States.
Table 2. Median household income along with income per capita (US dollars) for metropolitan city of each state. The incomes are separated by a slash (/).

Figure 3. Median household income as it correlates to income per capita in the metropolitan city of each state.
rise of sea levels, should also be taken into account, especially for vulnerable populations, in developing water resource management policies. State and local agencies receiving federal funding should be required to demonstrate collaboration with affected communities, and ongoing efforts to address water quality disparities should be proven, in order to receive continued funding.
Our study could serve as a guide for lawmakers to apportion resources toward the improvement of infrastructure in communities with poor water quality, and to support ordinances issued by the Environmental Protection Agency and other governmental agencies. The results obtained from this research can be used to educate and empower communities, particularly low-income populations, to take action regarding water quality in their respective areas. Our project will provide information about the health risks associated with the presence of trihalomethanes in watersheds, and assist in further data collection and analysis of information. Such steps are essential in order to minimize, and eventually eliminate, the gap between socioeconomic backgrounds and the availability of clean, sustainable water to the population.
4. Conclusion
Investigating the presence of harmful and possibly carcinogenic compounds in water is essential to the well-being of communities. The health ramifications of consuming water contaminated with trihalomethanes are of social and epidemiological interest. As shown in this study, in 2018, Arkansas, Nevada, and Rhode Island, which had median annual household income and income per capita lower than the national average, demonstrated higher than federally mandated levels of total trihalomethanes in their watersheds. On the other hand, the states with significantly low levels of total trihalomethane (Delaware, New Hampshire, and Wisconsin) had high average household income and income per capita. Although many factors play a role in water quality, socioeconomic background should not be one. However, socioeconomic background seems to exasperate poor water quality, particularly in older and less fortunate communities. Additionally, knowing that water bodies are interconnected further increases the urgency to regulate the trihalomethanes entering the watersheds. Information obtained from the present study could be used by governmental agencies to draft guidelines, in order to keep the population better informed of the drinking water quality in their areas. Such information will serve as a precursor in initiating appropriate measures to overcome the discrepancy in the quality of water available to people from different socioeconomic backgrounds.
Acknowledgements
We acknowledge the financial support from the USDA National Institute of Food and Agriculture, Grant# TENX-1608-FS. We thank US Department of Education, Title III Part B, grant number P031B090214 for partial financial support.
Conflicts of Interest
The authors declare no conflicts of interest regarding the publication of this paper.
Cite this paper
Karim, K., Guha, S., & Beni, R. (2020). Total Trihalomethane Levels in Major Watersheds across the United States. Journal of Geoscience and Environment Protection, 8, 1-14. https://doi.org/10.4236/gep.2020.86001
References
- 1. (2012). What Is a Watershed and Why Should I Care? https://web.archive.org/web/20120121122519/http://www.wr.udel.edu/cb/whatwhycare.html [Paper reference 1]
- 2. (2018). City of Dallas Water Quality Report. http://dallascityhall.com/departments/waterutilities/DCH%20Documents/pdf/water-quality-report.pdf [Paper reference 1]
- 3. Adin, A., Katzhendler, J., Alkaslassy, D., & Rav-Acha, Ch. (1991). Trihalomethane Formation in Chlorinated Drinking Water: A Kinetic Model. Water Research, 25, 797-805. https://doi.org/10.1016/0043-1354(91)90159-N [Paper reference 1]
- 4. Allen County Water District (2018). Water Quality Report.http://www.krwa.org/2018ccr/allencounty.pdf [Paper reference 1]
- 5. Anchorage Water & Wastewater Utility (2019). Anchorage Water Quality Report. https://awwu.maps.arcgis.com/apps/Cascade/index.html?appid=e926951637be415780b9171fc285b4ab [Paper reference 1]
- 6. Babcock, D. B., & Singer, P. C. (1979). Chlorination and Coagulation of Humic and Fulvic Acids. Journal of the American Water Works Association, 71, 149-152. https://doi.org/10.1002/j.1551-8833.1979.tb04318.x [Paper reference 1]
- 7. Baton Rouge Water Company (2018). Water Quality Report to Consumers. http://www.brwater.com/brwc_ccr.pdf [Paper reference 1]
- 8. Bellar, T. A., & Lichtenberg, J. J. (1974). Determining Volatile Organics at Microgram- per-Litre Levels by Gas Chromatography. Journal of the American Water Works Association, 66, 739-744. https://doi.org/10.1002/j.1551-8833.1974.tb02138.x [Paper reference 1]
- 9. Brewer, P. G., & Barry, J. (2008). Rising Acidity in the Ocean: The Other CO2 Problem. Scientific American. https://doi.org/10.1038/scientificamericanearth0908-22 https://www.scientificamerican.com/article/rising-acidity-in-the-ocean [Paper reference 1]
- 10. Burlington Water (2018). Annual Water Quality Report.https://www.burlingtonvt.gov/sites/default/files/2018%20Consumer%20Confidence%20Report.pdf [Paper reference 1]
- 11. Central Arkansas Water (2018). Water Quality Report. http://www.carkw.com/wp-content/uploads/2019/05/CARW-005-General-WQR_v2.pdf [Paper reference 1]
- 12. Charlotte Water (2018). Annual Drinking Water Quality Report. https://charlottenc.gov/Water/WaterQuality/Documents/CCR_2018_May232019.pdf [Paper reference 1]
- 13. City of Arvada (2018). Annual Water Quality Report. https://arvada.org/source/Water%20Quality%20Reports/Water%20Quality%20Report%202018%20Webpage.pdf [Paper reference 1]
- 14. City of Cheyenne, Board of Public Utilities (2018). Consumer Confidence Report.https://www.cheyennecity.org/2520/Consumer-Confidence-Report [Paper reference 1]
- 15. City of Detroit Water & Sewerage Department (2018). Detroit Water Quality Report: 2018 Results. https://detroitmi.gov/sites/detroitmi.localhost/files/2019-06/DWSD%20Water%20Quality%20Report%20for%202018%20%28Published%20June%202019%29.pdf [Paper reference 1]
- 16. City of Florence, Alabama (2018). Annual Water Quality Report. https://florenceal.org/document_center/utilities/water%20quality%20reports/WaterQ_Report2018_PROOF.pdf [Paper reference 1]
- 17. City of Fort Lauderdale (2018). Water Quality Report. https://www.fortlauderdale.gov/departments/public-works/water-quality-report-online-registration-form [Paper reference 1]
- 18. City of Goddard (2019). Consumer Confidence Report.https://www.goddardks.gov/ArchiveCenter/ViewFile/Item/287 [Paper reference 1]
- 19. City of Phoenix Water Services Department (2018). Water Quality Report. https://www.phoenix.gov/waterservicessite/Documents/wsdprimarywqr.pdf [Paper reference 1]
- 20. City of Port Orchard (2019). Water Quality Report for 2019. https://www.cityofportorchard.us/documents/city-of-port-orchard-water-quality-report [Paper reference 1]
- 21. City of St. Louis Water Division (2019). Consumer Confidence Report 2019. http://www.stlwater.com/water-quality/confidence [Paper reference 1]
- 22. City of White Plains (2018). Annual Drinking Water Quality Report for 2018. https://www.cityofwhiteplains.com/DocumentCenter/View/5027/2018-Water-Quality-Report [Paper reference 1]
- 23. Collins, M. B., Munoz, I., & JaJa, J. (2016). Linking “Toxic Outliers” to Environmental Justice Communities. Environmental Research Letters, 11, 1-9. https://doi.org/10.1088/1748-9326/11/1/015004 [Paper reference 2]
- 24. Denver Water (2019). Water Quality Report. https://www.denverwater.org/sites/default/files/water-quality-report-2019.pdf [Paper reference 1]
- 25. Department of Water, County of Kaua’i (2019). Water Quality Report.http://www.kauaiwater.org/wqr_anahola.pdf [Paper reference 1]
- 26. Environmental Protection Agency (EPA) (2001). Disinfection Byproducts: A Reference Source. https://archive.epa.gov/enviro/html/icr/web/html/gloss_dbp.html [Paper reference 1]
- 27. Fairfax Water (2019). Annual Water Quality Report.https://www.fairfaxwater.org/sites/default/files/newsletters/ccr_2019.pdf [Paper reference 1]
- 28. Freyfogle, E. T. (1986). University of Illinois Law Review. 481-519. [Paper reference 1]
- 29. Fulton County (2019). Annual Water Quality Report. http://www.co.fulton.ga.us/images/stories/WR2/2017/Fulton_County_2018_Water_Quality_Report_6_21_2019_002.pdf [Paper reference 1]
- 30. Fuson, R. C., & Bull, B. A. (1934). The Haloform Reaction. Chemical Reviews, 15, 275-309. https://doi.org/10.1021/cr60052a001 [Paper reference 1]
- 31. Gallatin Local Water Quality District (2018). Annual Report, Activities and Services—Fiscal Year 2018. https://glwqd.files.wordpress.com/2018/10/fy18-annual-report-final.pdf [Paper reference 1]
- 32. Georgetown Water Department (2019). Water Quality Report.https://imageserv11.team-logic.com/mediaLibrary/286/Georgetown_Water_Department_2019_CCR_Report_1.pdf [Paper reference 1]
- 33. Grand Forks Government (2018). Water Quality Report. https://www.grandforksgov.com/Home/ShowPublishedImage/7613/636969705058470000 [Paper reference 1]
- 34. Grazuleviciene, R., Nieuwenhuijsen, M. J., Vencloviene, J., Kostopoulou-Karadanelli, M., Krasner, S. W., Danileviciute, A., Balcius, G., & Kapustinskiene, V. (2011). Individual Exposures to Drinking Water Trihalomethanes, Low Birth Weight and Small for Gestational Age Risk: A Prospective Kaunas Cohort Study. Environmental Health, 10, Article No. 32. https://doi.org/10.1186/1476-069X-10-32 [Paper reference 1]
- 35. Greenville Water (2018). Water Quality Report. https://www.greenvillewater.com/waterquality.pdf [Paper reference 1]
- 36. Guha, S., Harlin, P., & Beni, R. (2019). The Effect of Trihalomethanes in Contaminating the Major Watersheds of Middle Tennessee. Natural Science, 11, 233-245. https://doi.org/10.4236/ns.2019.117023 [Paper reference 3]
- 37. Huang, W. J., Fang, G. C., & Wang, C. C. (2005). The Determination and Fate of Disinfection By-Products from Ozonation of Polluted Raw Water. Science of the Total Environment, 345, 261-272. https://doi.org/10.1016/j.scitotenv.2004.10.019 [Paper reference 1]
- 38. Jung, C.-W., & Son, H.-J. (2008). The Relationship between Disinfection By-Products Formation and Characteristics of Natural Organic Matter in Raw Water. Korean Journal of Chemical Engineering, 25, 714-720. https://doi.org/10.1007/s11814-008-0117-z [Paper reference 2]
- 39. Klaassen, C. D. (2019). Casarett and Doull’s Toxicology: The Basic Science of Poisons (9th ed.). New York: McGraw-Hill Education. [Paper reference 1]
- 40. Klinefelter, G. R., Suarez, J. D., Roberts, N. L., & DeAngelo, A. B. (1995). Preliminary Screening for the Potential of Drinking Water Disinfection Byproducts to Alter Male Reproduction. Reproductive Toxicology, 9, 571-578. https://doi.org/10.1016/0890-6238(95)02007-1 [Paper reference 1]
- 41. Las Vegas Valley Water District (2019). Reports. https://www.lvvwd.com/assets/pdf/water-quality-report-las-vegas-valley-archive.pdf [Paper reference 1]
- 42. Louisville Water (2018). Annual Water Quality Report. https://www.louisvillewater.com/sites/louisvillewater.com/files/user_uploads/WaterQuality/2018CCRAnnualReport521web.pdf [Paper reference 1]
- 43. Manchester Water Works (2018). Annual Water Quality Report.https://www.manchesternh.gov/Portals/2/Departments/water_works/watersupply/CCR_Web_Version_2018.pdf [Paper reference 1]
- 44. March, J., & Smith, M. (2007). March’s Advanced Organic Chemistry: Reactions, Mechanisms, and Structure (6th ed., p. 484). Hoboken, NJ: John Wiley & Sons. [Paper reference 1]
- 45. Mariposa County Public Works Department (2018). Consumer Confidence Report. https://www.mariposacounty.org/DocumentCenter/View/78984/Public-Works-2018-Consumer-Confidence-Report?bidId [Paper reference 1]
- 46. Massachusetts Water Resources Authority (2018). MWRA’s Drinking Water Test Results for 2018. http://www.mwra.state.ma.us/annual/waterreport/2018results/2018results.htm [Paper reference 1]
- 47. Metro Water Services (2018). Consumer Confidence Report. https://www.nashville.gov/Portals/0/SiteContent/WaterServices/docs/reports/CCR2018.pdf [Paper reference 1]
- 48. Miami-Dade County (2018). Water Quality Report. http://www.miamidade.gov/water/library/reports/water-quality-2018.pdf [Paper reference 1]
- 49. Milwaukee Water Works (2018). Distribution System Water Quality. https://city.milwaukee.gov/ImageLibrary/Groups/WaterWorks/files/Annual-Reports/2018-CCR-docs/2018DistributionSystemWaterQuality.pdf [Paper reference 1]
- 50. Minneapolis Public Works (2018). Water Quality Report.https://www.premierwatermn.com/water-quality/city-water/minneapolis/ [Paper reference 1]
- 51. Minnehaha Community Water Corp (2018). Drinking Water Report. https://www.minnehahacommunitywater.com/documents/958/2018_CCR_Report.pdf [Paper reference 1]
- 52. Mississippi State Department of Health (2018). Consumer Confidence Reports 2018. https://msdh.ms.gov/ccr/2018/ccrList.html [Paper reference 1]
- 53. Mohai, P., & Saha, R. (2015). Which Came First, People or Pollution? Assessing the Disparate Siting and Post-Siting Demographic Change Hypotheses of Environmental Injustice. Environmental Research Letters, 10, Article ID: 115008. https://doi.org/10.1088/1748-9326/10/11/115008 [Paper reference 2]
- 54. New York City (2018). Drinking Water Supply and Quality Report. https://www1.nyc.gov/assets/dep/downloads/pdf/water/drinking-water/drinking-water-supply-quality-report/2018-drinking-water-supply-quality-report.pdf [Paper reference 1]
- 55. Oklahoma City Utilities Department (2018). Drinking Water Quality Report. https://www.okc.gov/home/showdocument?id=14292 [Paper reference 1]
- 56. Philadelphia Water Department (2018). Drinking Water Quality Report. https://www.phila.gov/water/wu/Water%20Quality%20Reports/2018-Water-Quality-Report.pdf [Paper reference 1]
- 57. Polk City Government (2018). Water Quality Report for Polk City Water Supply. https://polkcityia.gov/file.axd?file=%2f2019%2f05%2f2018+CCR+(002).pdf [Paper reference 1]
- 58. Portland Water Bureau (2019). Drinking Water Quality Report. https://www.portlandoregon.gov/water/article/244813 [Paper reference 1]
- 59. Providence Water (2018). Water Quality Report. https://www.provwater.com/water_quality/annual-reports/2018 [Paper reference 1]
- 60. Public Works, Lake County, Illinois (2018). Annual Water Quality Reports. https://www.lakecountyil.gov/359/Water-Quality-Reports [Paper reference 1]
- 61. Regional Water Authority (2018). Consumers’ Annual Report on Water Quality. https://www.rwater.com/media/3497/2018-consumers-annual-report-on-water-quality_web.pdf [Paper reference 1]
- 62. Rook, J. J. (1974). Formation of Haloforms during Chlorination of Natural Water. Water Treatment and Examination, 23, 234-243. [Paper reference 1]
- 63. Salt Lake City Department of Public Utilities (2019). Water Quality Report 2019. http://www.slcdocs.com/utilities/CCR.pdf [Paper reference 1]
- 64. Saunders, J. F., Hohner, A. K., Summers, R. S., & Rosario-Ortiz, F. L. (2015). Regulating Chlorophyll a to Control DBP Precursors in Water Supply Reservoirs. Journal of the American Water Works Association, 107, E603-E612. https://doi.org/10.5942/jawwa.2015.107.0153 [Paper reference 1]
- 65. Singer, P. C., & Chang, S. D. (1989). Correlations between Trihalomethanes and Total Organic Halides Formed during Water Treatment. Journal of the American Water Works Association, 81, 61-65. https://doi.org/10.1002/j.1551-8833.1989.tb03260.x [Paper reference 1]
- 66. SUEZ Idaho Operations (2018). Your Water Quality Information: Annual Water Quality Report. https://www.mysuezwater.com/sites/default/files/IDCCR2017.pdf [Paper reference 1]
- 67. Symons, J. M. (1975). Preliminary Assessment of Suspected Carcinogens in Drinking Water (pp. 13-99). Washington DC: Environmental Protection Agency. [Paper reference 2]
- 68. The City of Fargo (2018). 2018 Water Quality Report. http://download.fargond.gov/0/2018fargowaterquality.pdf [Paper reference 1]
- 69. The Physical Environment (2003). Drainage Basin. https://web.archive.org/web/20040321033433/http://www.uwsp.edu/geo/faculty/ritter/glossary/a_d/drainage_basin.html [Paper reference 1]
- 70. Thompson, D. J., Warner, S. D., & Robinson, V. B. (1974). Teratology Studies on Orally Administered Chloroform in the Rat and Rabbit. Toxicology and Applied Pharmacology, 29, 348-357. https://doi.org/10.1016/0041-008X(74)90107-0 [Paper reference 1]
- 71. Town of Bernalillo (2018). 2018 Annual Drinking Water Quality Report. https://www.townofbernalillo.org/Departments/Public%20Works/Water%20Reports/DWB-2018_CCR_English.pdf [Paper reference 1]
- 72. United States Census Bureau (2020). https://www.census.gov/data.html [Paper reference 1]
- 73. Vanderwarker, A. (2013). Water and Environmental Justice. In A Twenty-First Century U.S. Water Policy (Chapter 3). Oakland, CA: Pacific Institute. https://doi.org/10.1093/acprof:osobl/9780199859443.003.0003 [Paper reference 1]
- 74. Villanueva, C. M., Gracia-Lavedan, E., Bosetti, C., Righi, E., Molina, A. J., Martin, V., Boldo, E., Aragones, N., Perez-Gomez, B., Pollan, M., Acebo, I. G., Altzibar, J. M., Zabala, A. J., Ardanaz, E., Peiro, R., Tardon, A., Chirlaque, M. A., Tavani, A., Polesel, J., Serraino, D., Pisa, F., Castano-Vinyals, G., Espinosa, A., Espejo-Herrera, N., Palau, M., Moreno, V., La Vecchia, C., Aggazzotti, G., Nieuwenhuijsen, M. J., & Kogevinas, M. (2017). Colorectal Cancer and Long-Term Exposure to Trihalomethanes in Drinking Water: A Multicenter Case-Control Study in Spain and Italy. Environmental Health Perspectives, 125, 56-65. https://doi.org/10.1289/EHP155 [Paper reference 1]
- 75. Waller, K., Swan, S. H., DeLorenze, G., & Hopkins, B. (1998). Trihalomethanes in Drinking Water and Spontaneous Abortion. Epidemiology, 9, 134-140. https://doi.org/10.1097/00001648-199803000-00006 [Paper reference 1]
- 76. Washington Suburban Sanitary Commission (WSCC) (2018). Water Quality Report FY 2018. https://www.wsscwater.com/files/live/sites/wssc/files/water%20quality/wqr_2018en.pdf [Paper reference 1]
- 77. West Virginia American Water (2019). Annual Water Quality Report. http://www.amwater.com/ccr/kanawhavalley.pdf [Paper reference 1]
- 78. World Health Organization (2004). Trihalomethanes in Drinking-Water. https://www.who.int/water_sanitation_health/water-quality/guidelines/chemicals/trihalomethanes.pdf [Paper reference 1]
- 79. Yarmouth Water District (2018). 2018 Consumer Confidence Report. http://yarmouthwaterdistrict.org/wp-content/uploads/2019/04/2018-Consumer-Confidence-Report.pdf [Paper reference 1]
- 80. Zwarteveen, M. Z., & Boelens, R. (2014). Defining, Researching and Struggling for Water Justice: Some Conceptual Building Blocks for Research and Action. Water International, 39, 143-158. https://doi.org/10.1080/02508060.2014.891168 [Paper reference 1]