 Journal of Applied Mathematics and Physics, 2014, 2, 1091-1098 Published Online November 2014 in SciRes. http://www.scirp.org/journal/jamp http://dx.doi.org/10.4236/jamp.2014.212126 How to cite this paper: Lu, S.Q. and Chen, J.R. (2014) Effects of Rigid Vegetation on the Turbulence Characteristics in Sedi- ment-Laden Flows. Journal of Applied Mathematics and Physics, 2, 1091-1098. http://dx.doi.org/10.4236/jamp.2014.212126 Effects of Rigid Vegetation on the Turbulence Characteristics in Sediment-Laden Flows Shengqi Lu, Jieren Chen State Key Laboratory of Hydrology-Water Resources and Hydraulic Engineering, Hohai University, Nanjing, China Email: cnjlvsq@hhu.edu.cn Received Oc tob er 2014 Abstract The effects of rigid vegetation on the turbulence characteristics were experimentally studied in the interior water flume. An ADV was used to determine the three dimensional turbulent veloci- ties in clear water flow without vegetation, sediment-laden flow without vegetation, sedi- ment-laden flow with submerged vegetation and sediment-laden flow with non-submerged vege- tation. By experimental and theoretical analysis, the effects of rigid vegetation on the distribution of averaged velocities, turbulence intensities and Reynolds stress were summarized. In sedi- ment-laden flow with submerged vegetation, the averaged stream wise velocities above the top of vegetation fit well with the log distribution low. The three-dimensional turbulence intensities in- crease from the bottom until they reach the maximum at the top of the vegetation. The method to calculate the shear velocity with the maximum of the Reynolds stress is recommended. In sedi- ment-laden flow with non-submerged vegetation, the turbulence problems cannot be explained by theory of bed shear flow. The average velocities, turbulence intensities and Reynolds stress ap- proximate uniformly distributed along vertical direction. Keywords Rigid Vegetation, Turbulence Characteristic s, Sedi m ent-Lad en Flow, Experimental Study 1. Introduction In the beaches and shallow water regions of many rivers or lakes, all kinds of vegetation such as canopy trees, s mall trees, shrubs, herbaceous wildflowers a nd grasses are universal and objective. They are also a basic ele- ment of river ecosystem. When water flows through vegetation, the microcosmic flow structures present intense three -dimensional motion characteristics and are greatly different from that in boundary-layer flow. In this fields, foreign researches and deve lop ments are earlier. Kouwen [1], Gourlay [2], Ei-Haki m [3], Corollo [4] and Järvelä [5] experimentally studied the effects of flexible and rigid vegetation on the distribution of the stream wise flow velocities. As a new research hotspot, the related studies in China started late. Huang [6] and Shi [7] studied the effects of vegetated floodplains on river flood carrying capacity and gave a formula to calculate the length of  S. Q. Lu, J. R. Chen flow coming into the main channel in a flood plain planted with trees. Shi [8], Yan [9], Ni [10], Tang [11] and Yan [12] conducted flume experiments and analyzed the resistance and the distribution of the stream wis e flow velocities in flows with different vegetation. In most of the previous studies, velocities above the top of the ve- getation were measured, but the velocities inside the vegetation regions were ignored. For the analyses on flow turbulence characteristics, most researchers focused on the stream wise direction and paid no attention to the span wise direction and the vertical direction. Lu [13] compared the turbulence parameters in vegetated flow and non-vegetated flow, but the research was not very thorough. In this paper, cylinders were positioned in flume to simulate rigid vegetation, an Acoustic Doppler velocimetry (ADV) was used to determine the three-dimensional velocities in clear water flow without vegetation, sediment-laden flow without vegetation, sediment-laden flow with submerged vegetation and sediment-laden flow with non-submerged vegetation. Then the effects of rigid vegetation on the turbulence characteristics were analyzed. 2. Theory of Uniform Flow 2.1. Averaged Velocity Kuelegan [14] gave the following formulas to calculate the averaged stream wise velocities in uniform wide- shallow open channel flow. (smooth bed surface) (1) (rough bed surface) (2) where is the averaged stream wise flow velocity in water depth of ; is the bed shear velocity ( , is the acceleration of gravity; is the hydraulic radium; is the energy slope); is the kinematic coefficient of viscosity; is the roughness height of the channel bed. Nezu [15] gave another recommended formula as follows: ( ) 2 2π lnsin 2 y U uyuA νκ κδ ∗∗ Π =++ (3) where is the von-karman constant; is the water depth of the maximum velocity; is an integral con- stant; is the Coles wake strength constant. When the bed surface is smooth and the turbulence approaches a two-dimensional flow, usually and . It can be seen that when , formula (1) and for- mula (2) are equivalent. In open channel flows, the near bed region is the place where the turbulence vortexes are generated. Meanwhile, the sediment concentration is relatively high in this region. The existence of the se- diment affects the generation and transportation of the turbulence vortexes, and then affects the flow velocities distribution. Through the experimental results, formula (3) is equally applicable in sediment-laden flow with low sediment concentration. The value of is related to the sediment concentration and it decreases with the se- diment concentration increasing. 2.2. Turbulence Intensity The turbulence intensities are important parameters in turbulence studies and can be calculated by the following formula s. ()( )( ) 2 22 111 111 , , mmm i ii iii uuU wwW vvV mmm = == ′′′ =−= −=− ∑∑∑ (4) where , , are the stream wise, span wise and vertical turbulence intensity; , , are the steamwise, spanwise and vertical instantaneous velocity; , , are the stream wise, span wise and ver- tical averaged velocity; is the number of the instantaneous velocities; Nezu [15] proposed the following semi-theoretical formul as: (5) (6)  S. Q. Lu, J. R. Chen (7) where , , , , , are all experimental constant. In the experiments conducted by Nezu [15], , , , . 2.3. Reynolds Stress Reynolds stress reflects the shear stress of the adjacent layer flows. Based on the Reynolds equation and the theory of two-dimensional uniform flow, the following derivation can be deduced. (8) where is the total shear stress (including Reynolds stress and viscous stress) and is the water density. In the fully developed turbulent flow, the Reynolds stress is much larger than the viscous stress, so the viscous stress is often ignored. As a result, the following formula can be got. (9) where has a linear relationship with . According to this rule, can be determined from the meas- ured velocity data. By using this method, can better reflect the bed shear stress at the position of the meas- ured verticals. 3. Experimental Procedures 3.1. Experimental Setup Expe r i me nts were conducted in a tilting rectangular-section water flume that is 0.42 m wide and 12 m long (see Figure 1). Rigid cylinders with the diameter of D = 6 mm were positioned in the flume to simulate vegetation. The vegetation zone was 8 m long, and the cylinders were arranged in a regular pattern (X × Y, X and Y are the distances between the centers of adjacent plants in the stream wise direction and in the span wise direction, re- spectively, as depicted in Figure 1.) . The slope of the flume can be adjusted to vary uniform flows. Flow dis- charges were taken as the average of readings from an acoustic flow meter. The flow meter readings had a stan- dard deviation of approximately 0.1% - 0.5%. In this study, plastic sand with the median size of 0.217 mm and the density of 1.082 g/cm3 was placed into a water storage tank. The water flows continuously; hence, the entire water body in the storage tank is in a con- stant state of violent turbulence. This turbulence level is sufficient to maintain the suspension of much of the plastic sand. In this way, the circulating flow with plastic sediment can be implemented. Moreover, the sediment concentration can be adjusted by controlling the quantity of plastic sand in the storage tank. 3.2. Measurement In the experiments, Velocities were determined through a three-dimensional acoustic Doppler velocimetry (ADV). In order to increase the mea s ur i ng accuracy, the related parameters of ADV are selected at the sampling frequency of 200 Hz and sampling height of 3 mm. By using a soft ware of win ADV, the statistic analysis of different turbulence parameters were conducted. Due to the measuring limitation of the down looking ADV, ve- locities of the water depth of 13 cm - 18 cm were not measured. 3.3. Hydraulic Conditions To compare the effects of rigid vegetation on the turbulence characteristics, four group of experiments were de- signed. The three-dimensional velocities in four different hydraulic conditions which are clear water flow with- out vegetation, sediment-laden flow without vegetation, sediment-laden flow with submerged vegetation and se- dimen t-laden flow with non-submerged vegetation will be determined. The hydraulic conditions are presented in the following table. In Table 1, is the total water depth; is the flow discharge; is the energy slope; is the verti- cally averaged velocity; is the vertically averaged sediment concentration (concentration expressed in per- 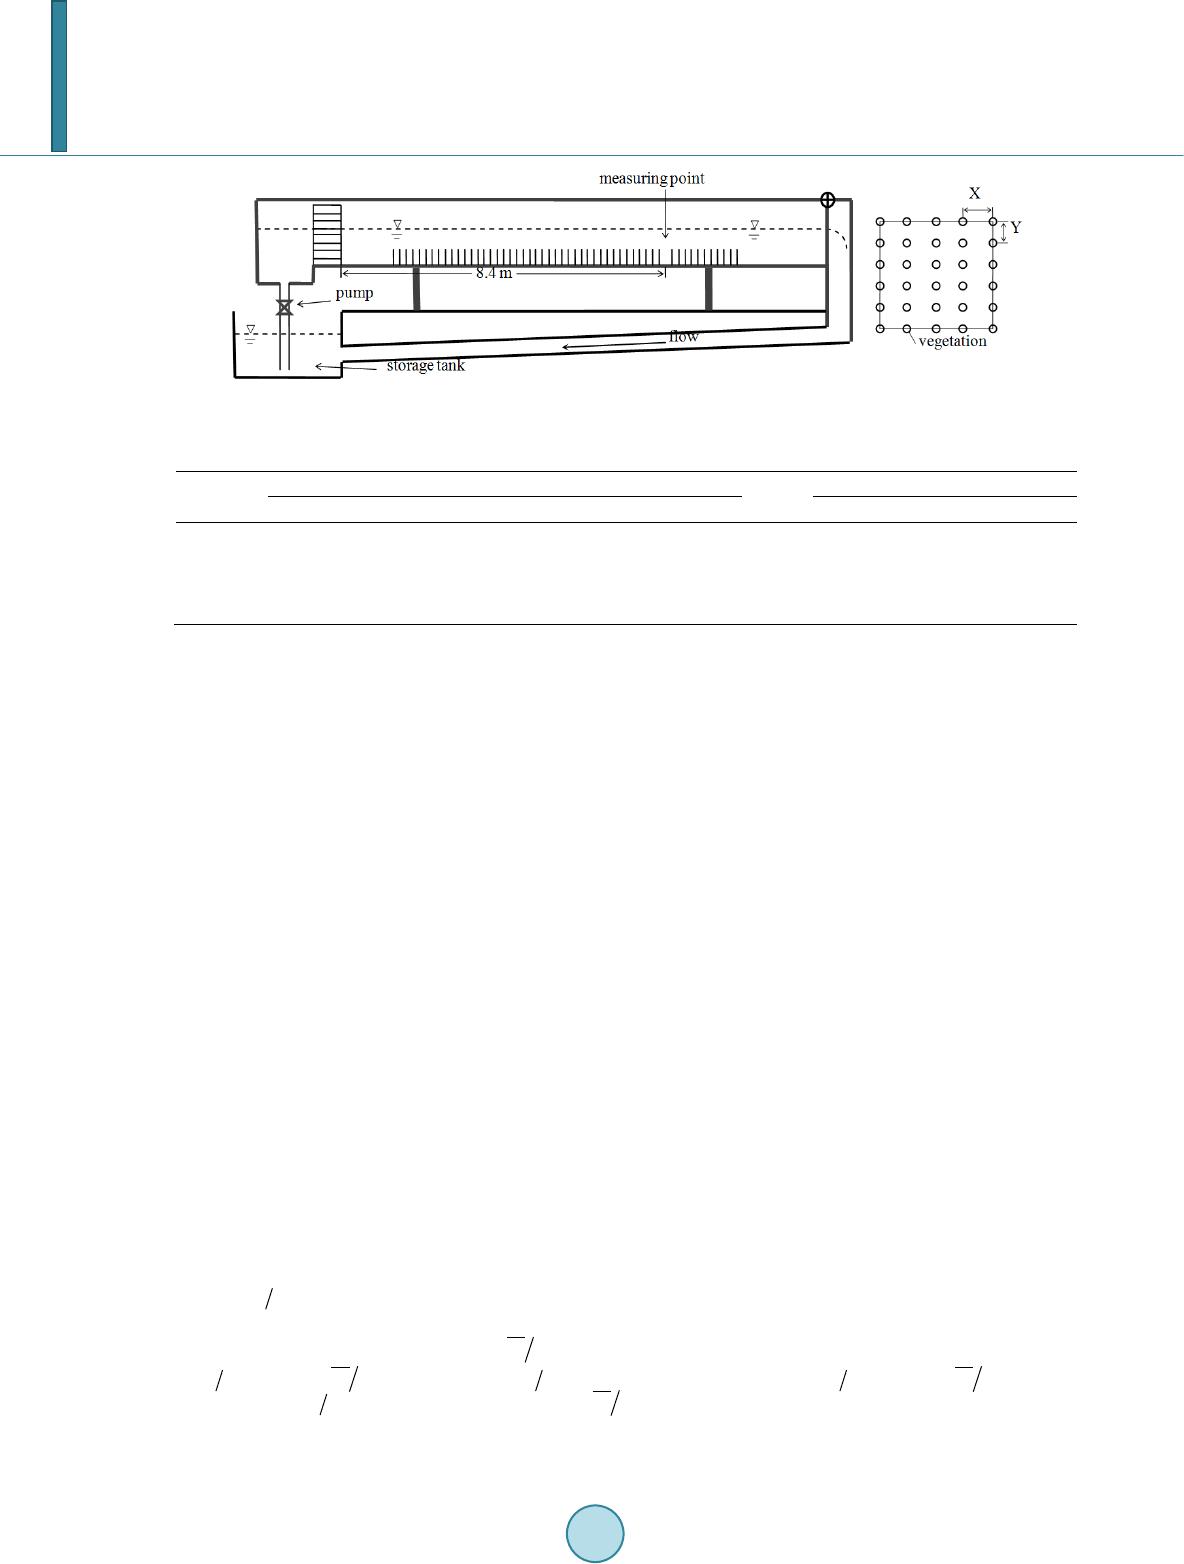 S. Q. Lu, J. R. Chen Figure 1. Exp erimental flume and rigid vegetation. Table 1. Summary of experimental conditions. Code H Q J UL u* Re Fr SvL hv X × Y cm L/s ‰ cm/s cm/s ×10 ‰ cm cm × cm B18 18 20.25 0.11 30.86 1.12 3.1 0.20 0.86 - - C18 18 23.83 4.59 28.13 6.25 3.6 0.24 4.92 6 5×2 D18 18 13.20 13.6 16. 92 15.49 2 .0 0.13 1.08 20 5×2 centage by volume); is the Reynolds number; is the Froude number and is the vegetation height (6 cm for submerged vegetation and 20 cm for non-submerged vegetation). 4. Experimental Results and Analysis 4.1. No Vegetation 1) Averaged velocities In the clear water flow (case A18), the measured averaged velocities approximate the log distribution law (in Figure 2(a)) and fit well with the formula (3) ( and ). In the sediment-laden flow (case B18), sediment gather in the near bottom region. Sediment concentration of the main flow region is relatively low. Therefore, velocities in the near bottom region must be affected and the effects on the velocities in the main flow region are much smaller. Figure 2(b) shows the velocities distribution in the case of B18. It can be seen that the velocities in the near bottom region deviate from the log distribution law, but the velocities in the main flow region fit well with the formula (3) ( and ). 2) Turbulence intensities In open channel flow, the highest turbulence intensity appears at the near bottom region and here is also the source of turbulence vortexes. With the turbulence vortexes diffusing upward, the turbulence intensity gradually decrease. It can be seen from the experimental results, the turbulence intensities fit well with the empirical for- mula of Nezu though the experimental constants have slightly difference (in Figure 3(a)). In the clear water flow, , , , , . The turbulence intensities approximate 1:0.77: 0.41 in stream wise, span wise and vertical directions. In the sediment-laden flow, , , , , , . The turbulence intensities approximate 1:0.76:0.43 in stream wise, span wise and vertical directions, which is very close to that of the clear water flow (in Figure 3(b)). From comparison, the turbulence intensities in various water layer are weakened in certain degree. The turbulence in- tensities of the deep water layer are weakened much greater than that of the upper water layer. Besides, the dif- ference of the turbulence intensities between the two flow conditions seems being obvious below the water depth of . 3) Reynolds stress Fro m Figure 4, it is easy to see that distributions have the similar characteristics. In the water depth of , increases with rising. In the water depth of , linearly decreases with rising. Depending on the distributions, the bed shear stress can be obtained, which is 1.42 cm/s in clear water flow and 1.12 cm/s in sediment-laden flow. 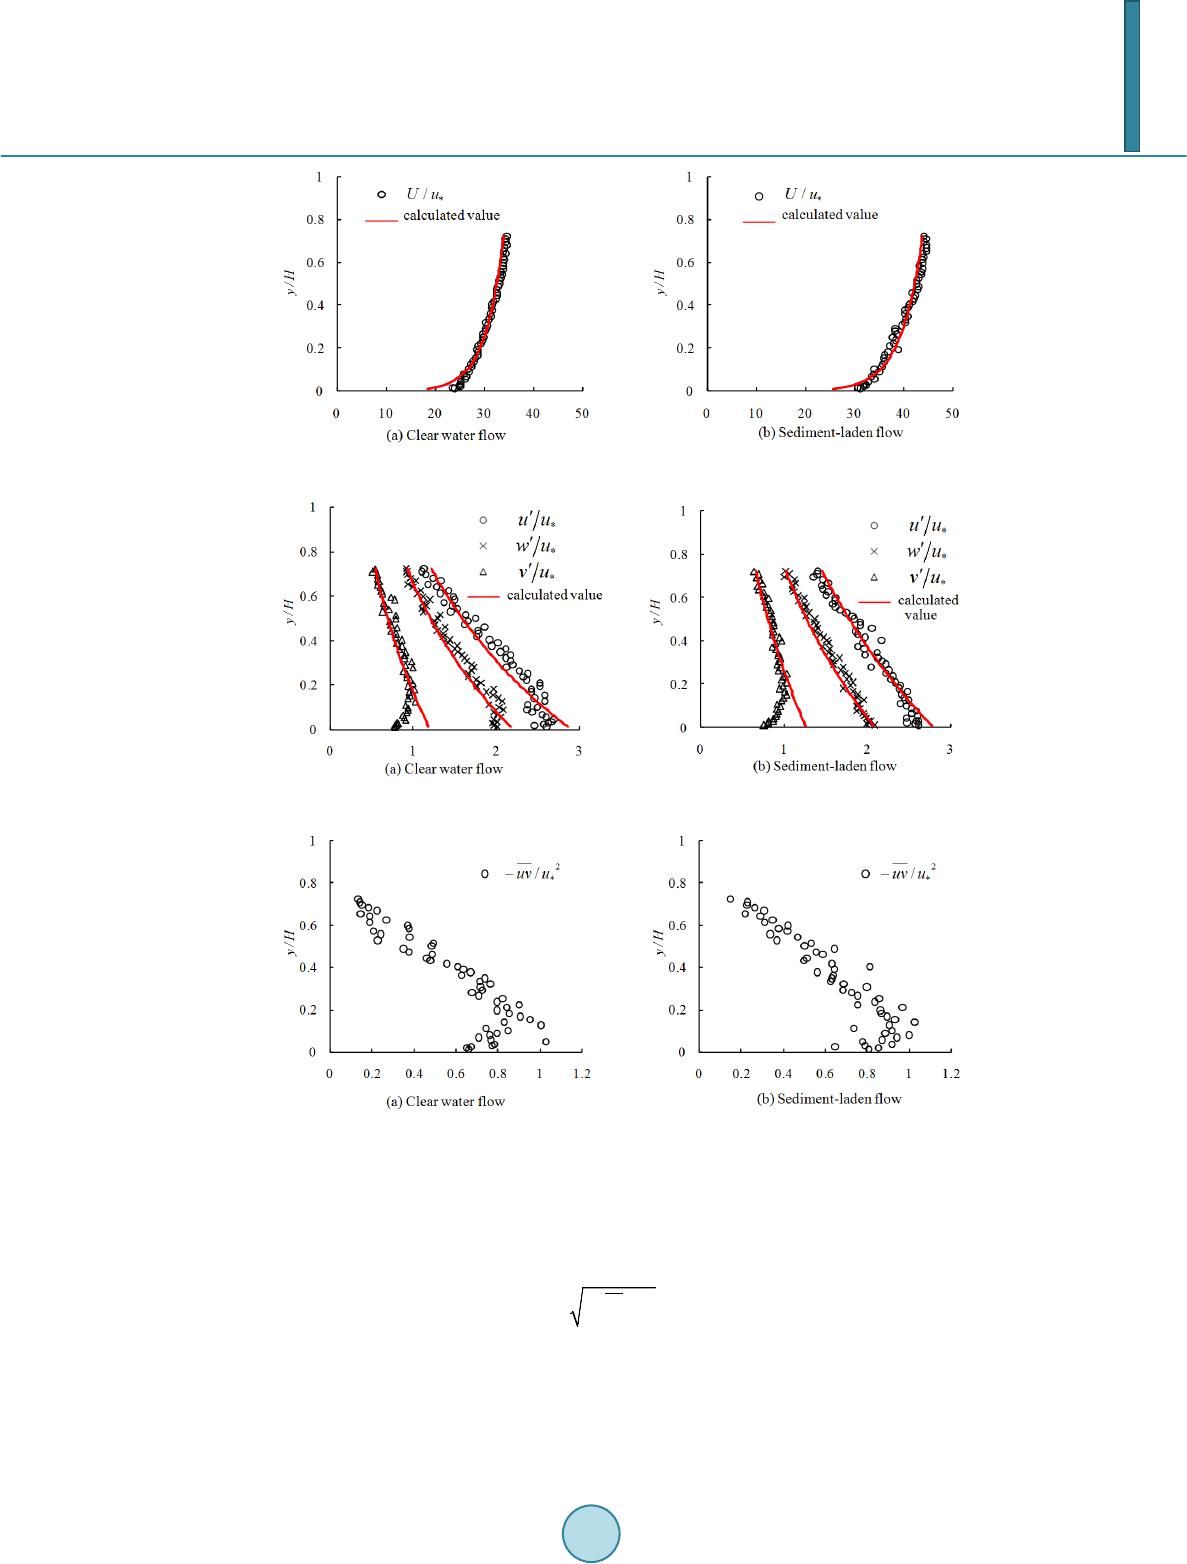 S. Q. Lu, J. R. Chen Figure 2. Average velocity distribution without vegetation. Figure 3. Turbulence intensities distribution without vegetation. Figure 4. Reynolds stress distribution without vegetation. 4.2. Submerged Vegetation and Non-Submerged Vegetation 1) Averaged velocities In the flow with submerged vegetation, the proper method to calculate the shear velocity is through Reynolds stress. Järvelä proposed to calculate the shear velocity with the maximum of the Reynolds stress as follows: (10) In the flow with submerged vegetation, related studies on averaged velocities were focused on the stream wise velocities distribution. Most of the previous researchers conclude that the velocities above the vegetation are log distribution law. Kouwen [1] conducted clear water flow with flexible submerged vegetation in flume and pro- posed the following empirical formula. 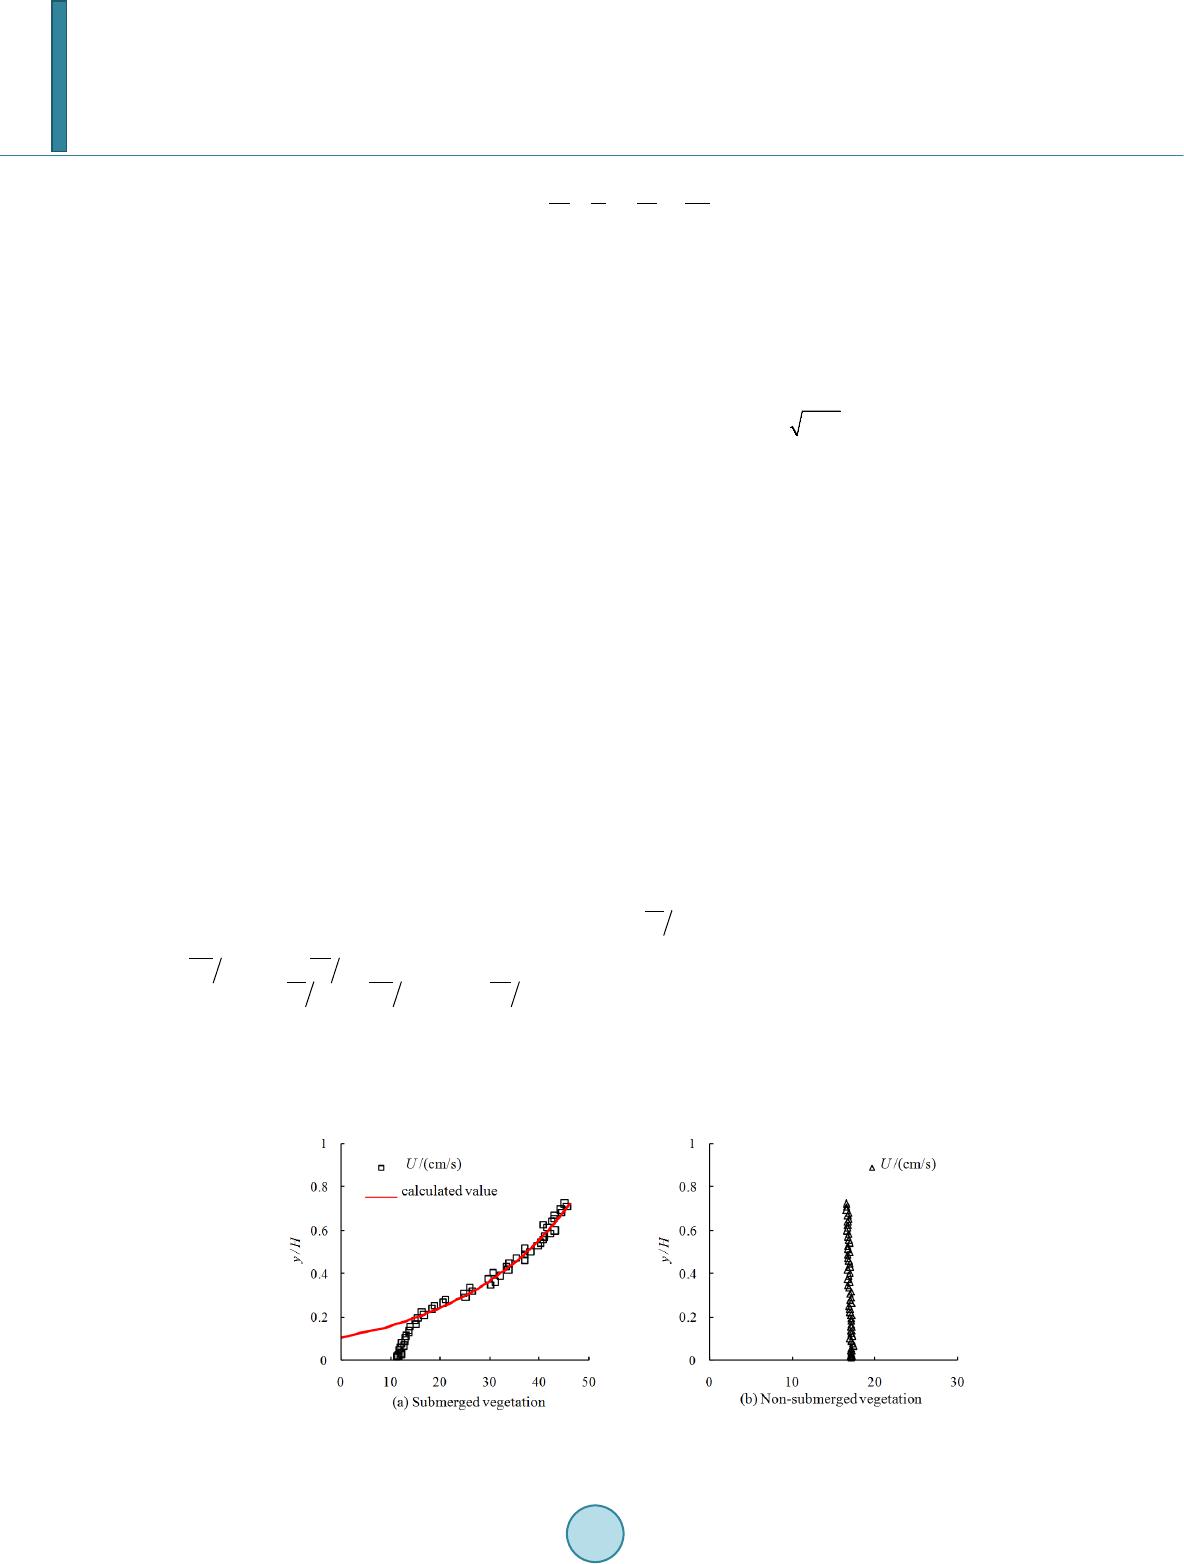 S. Q. Lu, J. R. Chen (11) where is the velocity on the top of the vegetation; is determined by the experimental data; In this expe- riment and (Figure 5(a)). This method has clear physical meanings and provides feasible parameters, which serves as a convenient formula for application. In the sediment-laden flow with non-submerged vegetation, the effects of vegetation on turbulence are equiv- alent to the group cylinders. Bed shear flow has been displaced by superposition flow pasting group circular cy- linders. Therefore, the turbulence problems cannot be explained by theory of bed shear flow and the shear ve- locity cannot be obtained by the Reynolds stress. Since the resistance is mostly composed by the vegetation re- sistance and the bed shear stress, the shear velocity can be calculated by . The stream wise velocities approximate uniformly distributed along vertical direction and the gradients are almost zero (as indicated in Figure 5(b)). 2) Turbulence intensities Figure 6( a) shows the three-dimensional turbulence intensities in sediment-laden flow with submerged vege- tation. The turbulence intensities gradually increase from the bottom until they reach the maximum at the top of the vegetation, then they begin to decrease above the vegetation. Compare the three-dimensional turbulence in- tensities at the regions of inside with outside the vegetation, the correlations are greatly changed. At the regions above the vegetation, the stream wise turbulence intensities are the strongest, followed by the span wise turbu- lence intensities, and then the vertical turbulence intensities. This is the same with that in flow without vegeta- tion. Nevertheless, at the regions below the top of the vegetation, the effect degree of vegetation on the three-dimensional turbulence intensities is different. The effect degree of the stream wise direction is evidently more than that of the other two directions. As a result, the vertical turbulence intensities are still the weakest, the strea m wise turbulence intensities rapidly decrease, so that it become gradually weaker than the span wise tur- bulence intensities. As a whole, the ratio of the averaged stream wise, span wise and vertical turbulence intensi- ties is about 1:0.85:0.5. In sediment-laden flow with non-submerged vegetation, the turbulence intensities ap- proximate uniformly distributed along vertical direction which is shown in Figure 6(b). The correlations of the three dimensional turbulence intensities are greatly changed. The span wise turbulence intensities are the strongest, followed by the stream wise turbulence intensities, and then the vertical turbulence intensities. The ra- tio of the averaged stream wise, span wise and vertical turbulence intensities is about 0.86:1:0.3. 3) Reynolds stress In sediment-laden flow with submerged vegetation, increases from the bottom until it reaches the maximum at the top of the vegetation, then it begins to decrease above the vegetation. The absolute values of and are all close to zero (see Figure 7(a)). In sediment-laden flow with non-submerged vegetation, , and are also uniformly distributed along vertical direction and the absolute values are very small (see Figure 7(b)). 5. Conclusions In this paper, the theory of uniform flow were analyzed, an ADV was used to determine the three-dimensional Figure 5. Av erage velocity distribution with submerged and non-submerged vegetation. 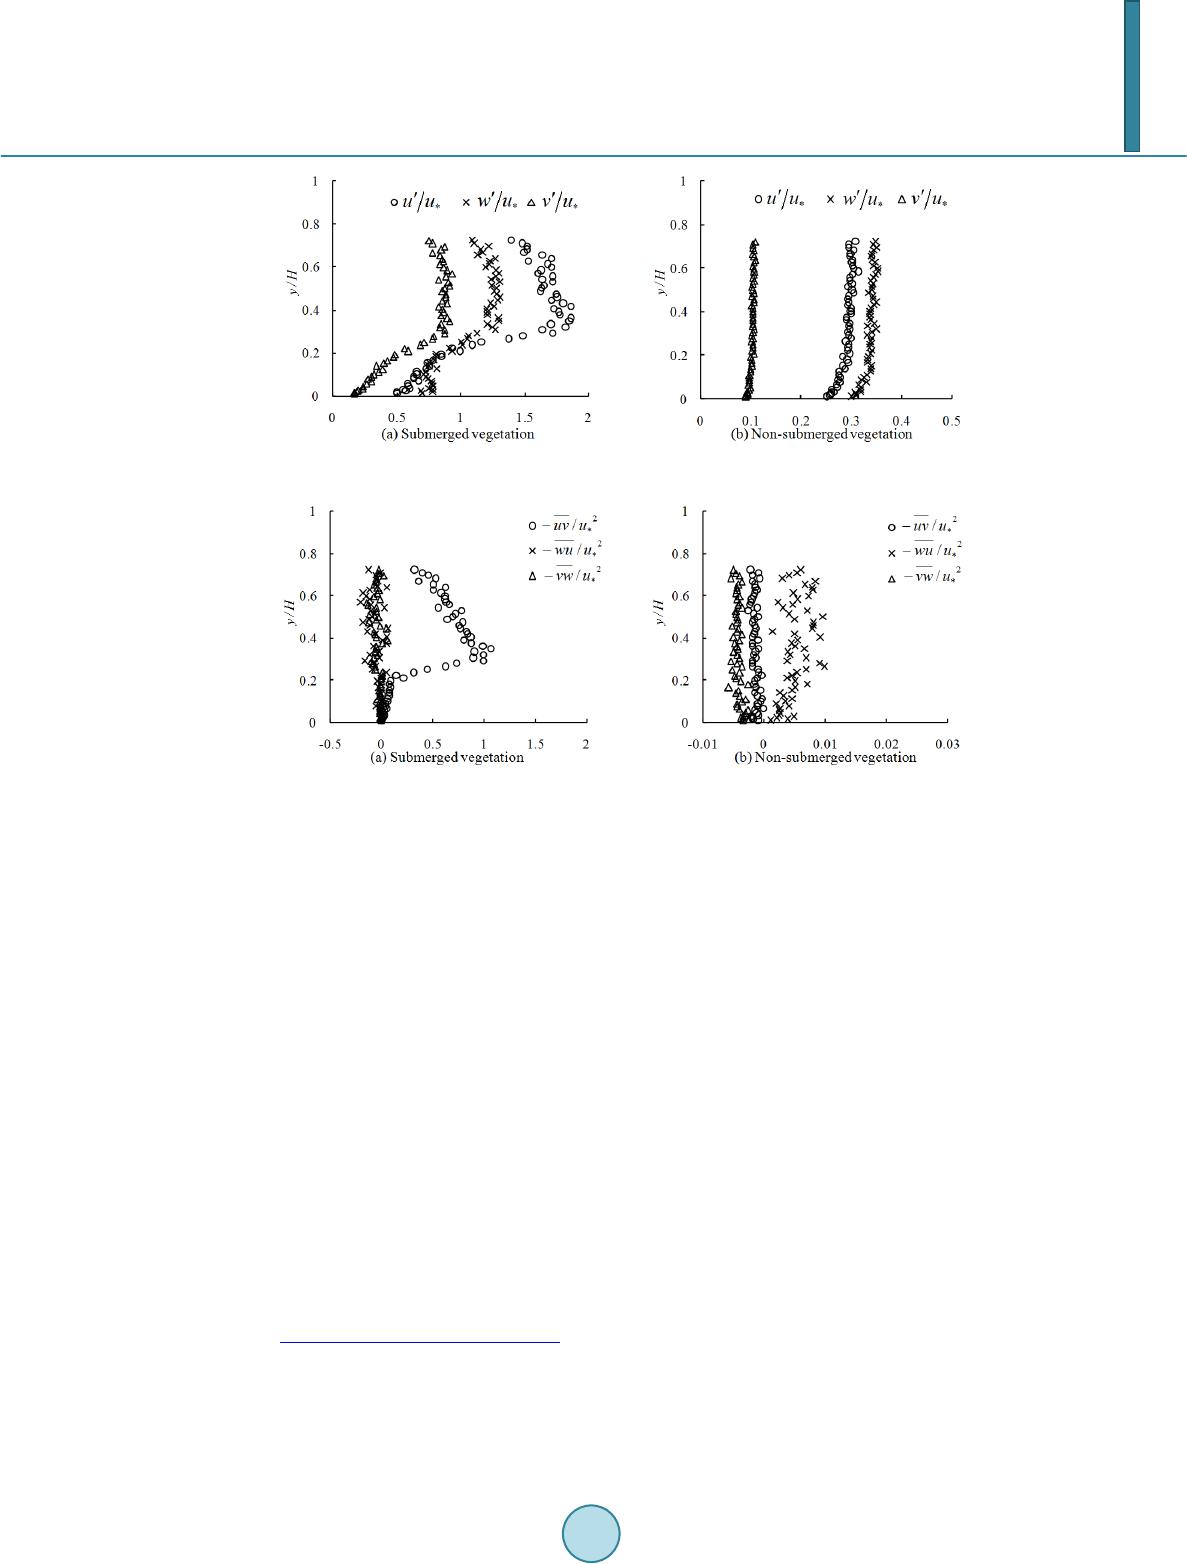 S. Q. Lu, J. R. Chen Figure 6. Turbulence intensities distribution with submerged and non-submerged vegetation. Figure 7. Reynolds stress distribution with submerged and non-submerged vegetation. velocities in clear water flow without vegetation, sediment-laden flow without vegetation, sediment-laden flow with submerged vegetation and sediment-laden flow with non-submerged vegetation. Then the effects of rigid vegetation on the distribution of averaged velocities, turbulence intensities and Reynolds stress were analyzed and summarized as follows. 1) In the sediment-laden flow with submerged vegetation, the averaged stream wise velocities above the top of vegetation fit well with the log distribution low. The three-dimensional turbulence intensities gradually in- crease from the bottom until they reach the maximum at the top of the vegetation, then they begin to decrease above the vegetation. The method to calculate the shear velocity by the maximum of the Reynolds stress is recommended. 2) In the sediment-laden flow with non-submerged vegetation, bed shear flow has been displaced by the su- perposition flow pasting group circular cylinders. The turbulence problems cannot be explained by theory of bed shear flow. The average velocities, turbulence intensities and Reynolds stress approximate uniformly distributed along vertical direction. Acknowledgem e nts This work was financially supported by the National Natural Science Foundation of China Youth Science Fund Project (51109065) and the Fundament al Research Funds for the Central Universities (2009B08614). References [1] Kouwen, N., Li, R.M. and Simo n s , D.B. (19 81) Flow Resistance in Vegetated Waterways. Transactions of ASCE , 24, 684-698. http://dx.doi.org/10.13031/2013.34321 [2] Gourlay, M.R. (19 70) Discussion of “Flow Resistance in Vegetated Channels” by Kouwen, N. et al. Journal of the Ir- rigation and Drainage Division, 96, 351-357. [3] Ei-Haki m, O. and Salama, M.M. (1992) Velocity Distribution inside and above Branched Flexible Roughness. Journal of the Irrigation and Drainage Engineering, 118, 914-927.  S. Q. Lu, J. R. Chen http://dx.doi.org/10.1061/(ASCE)0733-9437(1992)118:6(914) [4] Carollo, F.G., Ferro, V. and Termini , D. (2002) Flow Velocity Measurements in Vegetated Channels. Journal of Hy- draulic Engineering, 128, 664 -673. http://dx.doi.org/10.1061/(ASCE)0733-9429(2002)128:7(664) [5] Järvelä, J. (2005) Effect of Submerged Flexible Vegetation on Flow Structure and Resistance. Journal of Hydrology, 307, 233-241. http://dx.doi.org/10.1016/j.jhydrol.2004.10.013 [6] Huang, B.-S. , Lai, G.-W., Qiu, J. and Wan, P. (1999 ) Experimental Research on Influence of Vegetated Floodplains upon Flood Carrying Capacity of River. Journal of Hydrodynamics, Series A, 14, 468-474. [7] Shi, Y.-Z., Huang, B.-S. and Zhou , Z. (2003 ) Calculation of Length of Flow Coming into Main Channel in Flood Plain Planted with Trees. Hydro-Science and Engineering, 4, 53-56. [8] Shi, Z. (1997) Velocity Profile of Unidirectional Steady Current in a Salt Marsh Canopy. Journal of Sediment Research, 3, 82-88. [9] Yan , J., Zhou , Z. and Qiu, X.-Y. (2004) Tr an sp ortation Characteristics of Bed Load Sediment of Upper Reaches End before Vegetation Dam. Journal of Xinjiang Agricultural University, 27, 67-72. [10] Ni, H.-G. and Gu, F.-F. (2005) Roughness Coefficient of No n-Submerged Reed. Journal of Hydrodynamics, Series A, 20, 167-173. [11] Tan g, H.-W., Y an, J., X i ao, Y. and Lu, S.-Q. (2007) Manning’s Roughness Coefficient of Vegetated Channels. Shuili Xuebao, 38, 1347 -1353. [12] Yan, J., Tang, H.-W., Xiao, Y., Li, K.-J. and Tian , Z.-J. (2011 ) Experimental Study on Influence of Boundary on Lo c a- tion of Maximum Velocity in Open Channel Flows. Water Science and Engineering, 4, 185-191. [13] Lu, S.-Q., Ta n g, H.-W. and Yan, J. (2007 ) Comparison of the Turbulence Parameters in Vegetated Flow and Non-Ve- getated Flow. Advances in Science and Technology of Water Resources, 27, 64-68. [14] Wan g, X.K. , Shao, X.J. and Wang, G.Q. (2004) River Mechanics. Science Press, Beijing, 65-73. [15] Nezu, I. and Nakaga wa, H. (1993) Turbulence in Open-Channel Flows. Balkema, Rotterdam, 12-2 8.
|