Open Journal of Physical Chemistry
Vol.4 No.1(2014), Article ID:43156,6 pages DOI:10.4236/ojpc.2014.41005
A Kinetic Study of the Fermentation of Cane Sugar Using Saccharomyces cerevisiae
Department of Chemistry, Ambrose Ali University, Ekpoma, Nigeria
Email: fegharevba2013@yahoo.com, clara-ogbebor@yahoo.com, *akpovin2@gmail.com
Copyright © 2014 Egharevba Felix et al. This is an open access article distributed under the Creative Commons Attribution License, which permits unrestricted use, distribution, and reproduction in any medium, provided the original work is properly cited. In accordance of the Creative Commons Attribution License all Copyrights © 2014 are reserved for SCIRP and the owner of the intellectual property Egharevba Felix et al. All Copyright © 2014 are guarded by law and by SCIRP as a guardian.
Received December 9, 2013; revised January 8, 2014; accepted January 16, 2014
KEYWORDS
Fermentation; Substrate Concentration; Kinetics; Cane Sugar; Enzyme
ABSTRACT
The fermentation of cane sugar as substrate by Saccharomyces cerevisiae (enzyme) was critically investigated to obtain certain useful kinetic parameters and to determine the effect of temperature, pH, substrate and yeast (enzyme) concentration on the rate of fermentation. The results indicate that the rate of fermentation (measured as rate of production of CO2) increased in proportion with temperature (optimum 32˚C - 36˚C), pH (optimum 5.5) substrate (optimum 50 v/v%) and yeast concentration (optimum 3.5 - 4.5 w/v%) up to a limit and subsisted either as a plateau and/or, decreases as the case may be. This suggests that the reaction takes place in two steps. The kinetic parameters examined are maximum rate of reaction Vmax (2.0 × 10² M∙min−1), catalytic constant, k2 (1.81 × 10⁻¹ min−1), overall rate constant, k (1.53 × 101 min−1), order of initial reaction (approx. first order), dissociation constant of enzyme-substrate complex, ks (2.74 × 10³), Michaelis constant, km (2.74 × 10³ M), and the specific activity of enzyme on substrate concentration (1 × 10⁻¹ w/v%). The result of this study showed that the equilibrium step involving k−1/k1 is the limiting step deciding the direction of reaction as well as the specific activity of the enzyme.
1. Introduction
The fermentation of biomass using suitable enzymes to obtain alcohol had in recent years attracted the attention of stake holders in the industrial sector. Alcohols from vegetable sources are useful as renewable components of bio-diesel as well as for the production of a range of useful chemicals such as surfactants, solvents for paints, vanishes, inks and adhesives [1,2]. In addition, alcohols are used for medicinal, pharmaceutical, flavoring and beverage purposes. Ogunye and Susu [3] had conducted fermentation studies on pineapple juice, while Holberg [4] investigated on grape juice. The kinetic study of the fermentation of cane sugar molasses had also been done by Digwo et al. [5]. In all of these, the required kinetic information for industrial production is lacking. However, the published nutritive value of cane sugar juice per 28.35 g of sugar cane juice includes: energy (111.13 kJ), carbohydrates (27.5 g), protein (0.27 g), calcium (11.23 mg), iron (0.37 mg), potassium (41.96 mg), and sodium (17.01 mg) [6]. A major feature of enzymes is that they are extremely effective as catalysts-providing alternative and simple routes much more than chemical catalysts [7]. The catalytic action arises from the substantial reduction of the activation energy. Moreover, the catalytic activity is localized in certain amino acids residues in the protein enzyme which provide suitable sites for reaction in a lock and key system with substrate. Enzyme catalyzed reaction is usually characterized by a very high rate value of the order of 104 to 109 and high specificity. The determination of the specific activity of Saccharomyces cerevisiae with respect to cane sugar is the main objective of this study.
Theory of Fermentation Kinetics
The theory of fermentation kinetics is well established and documented in literature. It is adapted in this report to suite this investigation. In an enzyme [E] catalyzed reaction involving a single substrate [S], the rate varies linearly with the substrate concentration at low concentration (first order kinetics) and at high concentration; the rate becomes independent of substrate concentration (zeroth order kinetics). On this basis, the reaction scheme can be stated in terms of the mechanism.
 (1)
(1)
where [E] = enzyme (yeast), [S] = substrate, [ES] = enzyme-substrate complex, and [P], the product. Further K1 is the rate constant for the formation of [ES] complex, K−1 the decomposition of ES complex to E and S, and K2, the catalytic constant or the turnover number of an enzyme. The first step is a rapid equilibrium and the second step a slow, rate determining step. Since in most enzyme reaction, the substrate is much greater than that of the enzyme and the concentration of [ES] is much less than that of the substrate [8], applying the steady state approximation for the [ES] complex is given by:
 (2)
(2)
While the rate of formation of product (Rp) is:
 (3)
(3)
where Km, the Michaelis constant is given by
 (4)
(4)
The maximum or limiting rate ,Vmax of the reaction is considered to be the rate at which all the enzyme molecules are in the complex form [ES] i.e. [E]o = [ES]. It follows that Vmax is proportional to [E]o.
 (5)
(5)
Substituting equation (5) in equation (3) gives
 (6)
(6)
From Lineweaver and Burk [9], the reciprocal of equation (6) is:
 (7)
(7)
where Vmax and km can be evaluated from a plot of 1/vo versus 1/[S] while k2 is in principle obtained from the plot of Vmax versus [E]o (equation (5)). Moreover, Michaelis and Menten [10] also considered that the initial rate of product formation vo is given by;
 (8)
(8)
On the basis of the rate determining step and equilibrium values of [E] = [E]o – [ES]; [S]o – [ES] at time t. From a consideration of equation 4, if k−1 >> k2, therefore km = ks = k−1/k1 can be treated as a dissociation constant (ks) i.e.: ks = k−1/k1 = [E][S]/[ES]
 (9)
(9)
Expanding and dividing through by [ES] gives:
 (10)
(10)
Substitution of equation (10) into equation (8) gives:
 (11)
(11)
The reciprocal of vo gives: 
 (12)
(12)
A plot of 1/vo versus 1/[S] yields k2 and ks from a consideration of the slope and intercept. A consideration of equation (7) and (12) proves that: Vmax = k2[E]o.
It must be noted that, km can be equated with ks only when k−1 >> k2. In this condition, km is considered as a measure of the strength of the [ES] complex:

and km = k−1/k1 from equation (4).
When k1 is very small, km is large indicating a weak binding between enzyme and substrate [10].
2. Materials and Methods
2.1. Experimental Materials
Sugarcane was purchased from Iruekpen market, Ekpoma, Edo State, South-South, Nigeria. pH meter standardized with appropriate buffer solutions (buffer 4) and yeast (Saccharomyces cerevisiae) manufactured by Vahine professional, Mc cormick, France SAS was used as received. Fermentation vessels, vials and thermostated water baths were also used for the experimentation.
2.2. Preparation of Sugar Cane Juice
The sugarcane was washed, peeled, chopped into bits or pieces, and pounded in a mortar. The fibers were then manually removed by squeezing out the juice from it by hand. The juice obtained was sterilized by heating in an aluminum can at temperature of 90˚C for 40minutes and then cooled. After cooling, 3000 cm3 was obtained from 5.632 kg of cane. The juice was filtered and treated with a 3% Sodium metabisulphite, (Na2S2O5) to inhibit the growth of any undesirable type of microorganism such as acetic acid bacteria, wild yeast and mould [11]. Thereafter the required quantity of juice was transferred into the fermentation vessels.
2.3. Experimental Procedure
The fermentation vessels were washed and later sterilized with a 3% solution of sodium metabisulphite for 5 minutes. 1000 cm3 of the juice was properly conditioned by sterilizing at 90˚C and brought to the required pH with either 0.1 M HCl or 0.1 M NaOH. Seven vials containing substrate were prepared for each of seven sampling times at 0, 30, 60, 90, 120, 150, 180, and 210 (min). The samples were fermented in the sealed polymeric vial with connected tubes for the estimation of gas production. Ig of yeast was added to each of the fermenter. The substrate and yeast were properly mixed by shaking and the yeast allowed activating for 20minutes. The escape of CO2 was prevented by sealing the air inlet with a cresol-perfumed jelly. The CO2 produced in each sealed vial was collected in water and measured by titration, with 0.IM solution of NaOH using phenolphthalein indicator.
2.3.1. Determination of Effect of Temperature
The effect of temperature on fermentation kinetics was determined by keeping other factors such as substrate concentration, pH of the juice, yeast concentration, and fermentation time constant.
The temperature was varied between 30˚C - 42˚C, using a thermostated water bath.
2.3.2. Determinaton of Effect of Substrate Concentration
In determining the effect of substrate concentration on fermentation kinetics, all other factors such as temperature, pH, yeast concentration, and fermentation time were kept constant. The substrate concentration was varied between 20 - 80 (v/v%).
2.3.3. Determination of Effect of PH
Substrate concentration, temperature, fermentation time and yeast concentration were kept constant in determining the effect of pH on fermentation kinetics. The pH meter was standardized with a buffer 4 solution. The pH was varied by the introduction of 0.1 M H2SO4 or 0.1 M NaOH solution to the required pH value and measured by a pH meter. The pH of the juice was varied between 3.0 - 6.0 (pH).
2.3.4. Determination of Effect of Yeast Concentration
The effect of yeast concentration on fermentation was determined by varying yeast concentration between 1 - 7 (w/v%).
2.3.5. Determination of Rate of Fermentation
The rate of fermentation was measured as the volume of CO2 produced at 30 minutes’ interval of time.
3. Results and Discussion
The data on the effect of temperature, substrate concentration, pH, and yeast concentration on the fermentation of cane sugar with Saccharomyces cerevisiae are presented in tables 1-4.

Table 1. Effect of temperature on fermentation rate using 50 (v/v%) subtrate, yeast 1.0 (w/v%), and pH 5.0.

Table 2. Effect of substrate concentration on fermentation rate using 1.0 (w/v%) yeast, at 30˚C and pH 5.0.

Table 3. Effect of pH on fermentation rate using 50 (v/v%) subtrate, 1.0 (w/v %) yeast, at 30oC.
Effect of temperature: The data on the effect of temperature on the rate of fermentation is shown in table 1 and plotted on figure 1 as rate of fermentation versus temperature (˚C). It is observed that the rate of production of CO2 increased up to 36˚C and then later decreased. The results further showed that though there is a wide range of temperature over which the enzyme is active, there is a narrow range of temperature (35˚C - 36˚C) over which the enzyme activity is a maximum. The shape of

Table 4. Effect of yeast concentration on rate of fermentation using 50 (v/v%) substrate, at 30˚c, and pH 5.0.

Figure 1. Variation of rate of fermentation with temperature of substrate using 50 (v/v%) substrate, yeast 1.0 (w/v%), and pH 5.0.
the plot is generally hyperbolic. The plot signaled a two step reaction which is corroborated by the rapid release of CO2 at the initial stage of the fermentation, followed by a decrease or slow release of the gas. The initial increase in rate with temperature is expectedly a function of the increase in the average kinetic energy of the molecules. However, a further increase in temperature beyond 36˚C would trigger the breakdown of the enzymatic structure due to increased thermal vibration of the enzyme.
Effect of substrate concentration: The data on the effect of substrate concentration on rate of fermentation is shown in table 2 and plotted on figure 2. The figure showed that the rate of fermentation varied in proportion with substrate concentration up to 50 (v/v%). However, further increase in the substrate concentration showed no effect on the rate of reaction. This suggests that at the initial stage of the reaction, all active sites of the enzyme were saturated and therefore further increase in substrate concentration could not lead to further increase in the rate of fermentation. The plot indicates that there is a wide range of concentrations over which the enzyme is active.
Effect of pH: The rate of fermentation increased in relation with pH (i.e., from 3.0 - 5.5). The data is shown in table 3 and plotted as rate of fermentation versus pH

Figure 2. Variation of rate of fermentation with substrate concentration using 1.0 (w/v%). Yeast, at 30˚C and pH 5.0.
(figure 3). This result is in conformity with the optimal pH range of Saccharoymces cerevisiae 4.5 - 5.5 [12]. Outside the optimum pH range, the enzyme cells are less tolerant to the pH environment and expectedly less active and less efficient in substrate conversion. The figure indicates that there is a narrow range of pH over which the enzyme activity is a maximum.
Effect of yeast concentration: The data on the effect of yeast concentration on the rate of fermentation is shown in table 4 and plotted in figure 4 as rate of fermentation versus yeast concentration (w/v%). It is seen that though there is a wide range of concentration over which the yeast (enzyme) is active, there is a narrow range over which the activity is a maximum. It is considered that at high yeast concentration, the substrate becomes unavailable for the large population of yeast for a particular enzyme-substrate system. This suggests that there is a fixed or particular amount of substrate that can complex with the yeast. That complexation is controlled by the system thermodynamics. Further increase in yeast concentration therefore had no effect on the rate.
In tables 5 and 6 are shown the kinetic parameters: overall rate constant k, order of initial reaction n, maximum rate of fermentation Vmax, catalytic constant, k2 also known as the turnover number, dissociation constant for the enzyme-substrate complex ks the Michaelis constant km, and the specific activity of the enzyme. It is seen (table 5) that the overall rate constants k with respect to temperature is (1.35 min−1); substrate concentration (1.53 min−1); yeast concentration (1.13 min−1) and pH (1.87 min−1); while the order of initial reaction is approximately first order. Table 5 further indicates that the rate of the reaction is highly dependent on the substrate concentration and that all other conditions such as temperature, yeast concentration and pH have seemingly low dependence of the rate, but rather a limiting one at optimum range.
Most importantly, the kinetic parameters highly valued in fermentation process are shown in table 6. The maximum rate of fermentation Vmax being 2.0 × 10² M∙min−1. The value represents the maximum velocity attainable. The catalytic constant k2 is 1.81 × 10⁻¹ min−1,
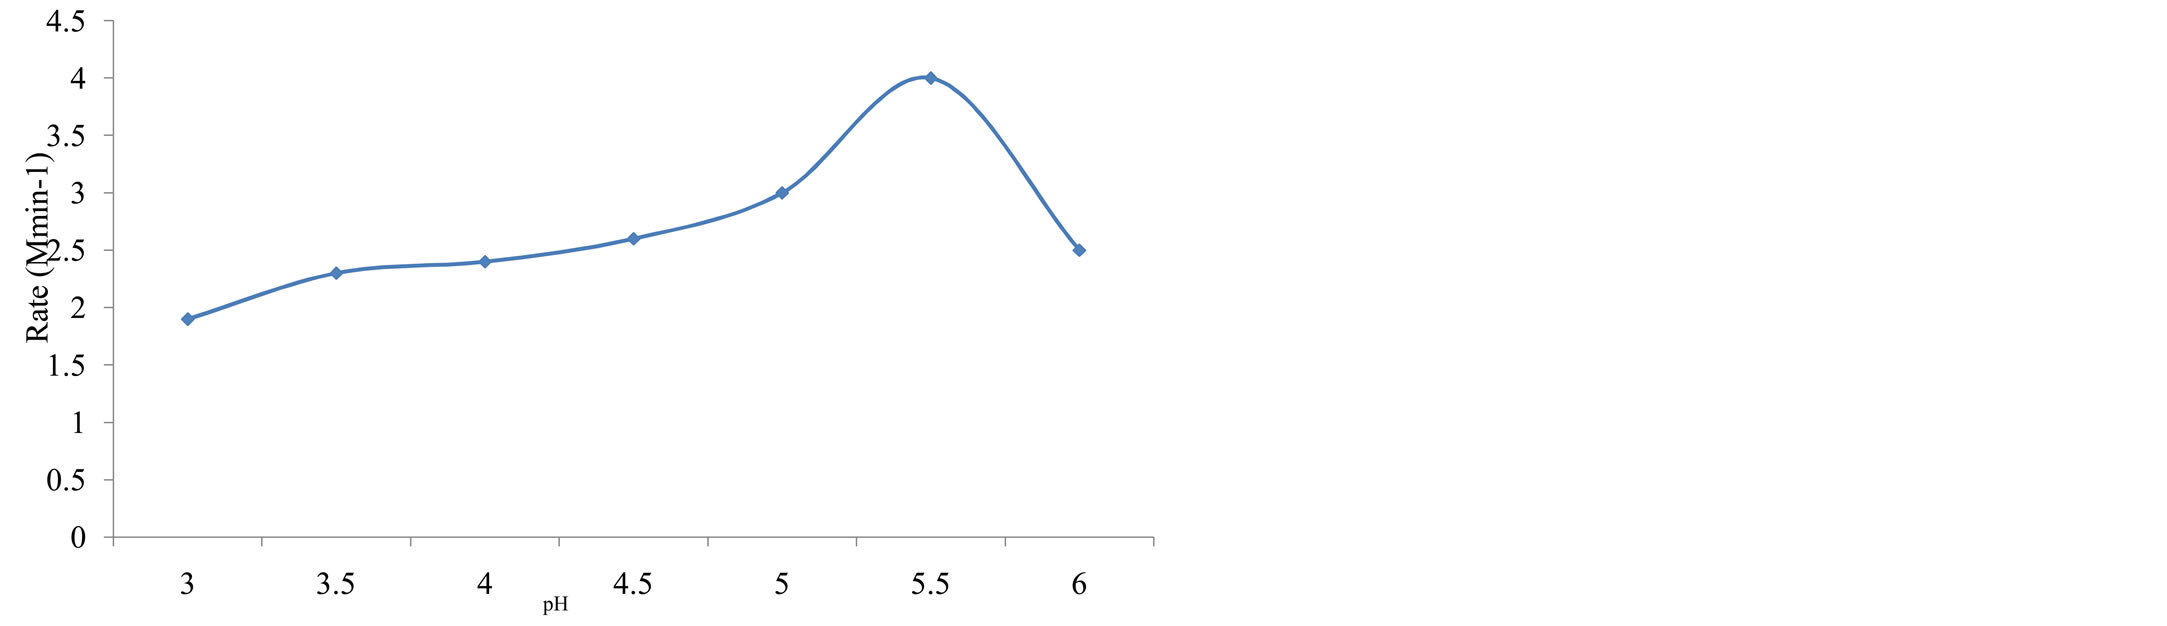
Figure 3. Variation of rate of fermentation with ph of substrate using 50 (v/v%) substrate, 1.0 (w/v%), at 30˚C.

Figure 4. Variation of rate of fermentation with yeast concentration (w/v%) using 50 (v/v%) substrate, at 30˚C and pH 5.0.

Table 5. Values of k and n for the fermentation of cane sugar using Saccharoymces cerevisiae.

Table 6. Kinetic parameters for the fementation of cane sugar using Saccharomyces cerevisiae.
which is the number of substrate molecules converted into products per unit time. The dissociation constant ks is 2.74 × 10³ of the enzyme-substrate complex. The Michaelis constant km is 2.74 × 10³ M, which is usually deployed to characterize a particular enzyme-substrate system. km is equal to the concentration of substrate required to give half the maximum velocity. The value of km in this investigation is quite large (table 6) with reference to known km values that lie between 10−1 and 10−6 M13. The large value indicates that the binding between enzyme and substrate is very weak with respect to cane sugar and Saccharoymces cerevisiae [E]. The large value of km obtained can only be possible if the decomposition constant k−1 of ES to E + S is much greater than k2, the catalytic constant as seen from the data in table 6; and as well if the formation rate constant k1 of ES complex from E and S is very small. That k−1 >> k2, therefore km = ks = k−1/k1 confirms the values of km (2.74 × 10³) and ks = 2.74 × 10³ shown in table 6. Given the value of k2 (1.81 × 10⁻¹ min−1) in table 6, k2 often lies between 0.5 and 104S−1 [13]. It indicates that the equilibrium step involving k−1 is more thermodynamically favored than step 2 that involves k2 (the catalytic constant). The specific activity is the units of enzyme activity per gram of protein (yeast). It is found to be 1 × 10⁻¹. A unit of enzyme is taken to be the amount which will catalyze the reaction of a unit of substrate per minute. Thus specific activity in relation to enzyme is the ratio of enzyme activity to the total weight of enzyme present in the mixture. This was obtained by cross plotting the rates of fermentation with respect to enzyme and yeast concentrations.
4. Conclusion
The cross plots had shown that at maximum rate, 13 w/v% yeast is required to ferment 44 v/v% substrate; while at half maximum rate, 5 w/v% yeast ferments 27 v/v% of substrate. This information is practically important for fermentation process engineers.
REFERENCES
- G. Kildiran, S. O. Yucel and S. Turkay, “In Situ Alcohol of Soybean Oil,” Journal of American Oil Chemical Society, Vol. 73, No. 2, 1996, pp. 225-228. http://dx.doi.org/10.1007/BF02523899
- C. E. Goering and B. G. Fry, “Engine Durability Screening Test of a Diesel Oil/Soy Alcohol Microemulsion Fuel,” Journal of American Oil Chemical Society, Vol. 61, No. 10, 1984, pp. 1627-1632. http://dx.doi.org/10.1007/BF02541647
- A. F. Ogunye and A. A. Susu, “Fermentation Kinetics of Carica Papaya Using Saccharoymces cerevisiae,” Journal of Environmental and Appied Sciences, Vol. 1, No. 1, 1979, pp. 51-60.
- E. A. Holsberg, “Fermentation Kinetics of Carica Papaya Using Saccharoymces cerevisiae,” Journal of Environmental and Appied Sciences, Vol. 1, No. 1, 1969, pp. 51-60.
- N. Digwo, A. A. Susu and F. A. Ogunye, “Fermentation Kinetics of Carica Papaya Using Saccharoymces cerevisiae,” Journal of Environmental and Appied Sciences, Vol. 1, No. 1, 1978, pp. 51-60.
- F. Peter, “Saccharum Officinarum,” Food and Agriculture Oganisation of the United Nations, 2000, pp. 34-36
- A. Ault, “An Introduction to Enzyme Kinetics,” Journal of Chemical Education, Vol. 51, No. 6, 1974, pp. 381. http://dx.doi.org/10.1021/ed051p381
- G. E. Briggs and B. S. Haldane, “A Note on the Kinetics of Enzyme Action,” In: T. Palmer, Ed., Enzymology, Harwood, London, 1925, pp. 109-110.
- H. Lineweaver and D. Burk, “The Determination of Enzyme Dissociation Constants,” In: T. Palmer, Ed., Enzymology, Harwood, London, 1934, pp. 113-114.
- M. I. Michaelis and L. Menten, “Kinetic Theory of Enzyme Action,” In: T. Palmer, Ed., Enzymology, Harwood, London, 1913, pp. 107-108.
- A. Davidson, “The Penyvin Companion to Food,” Wiley, New York, 2008, p. 65.
- G. I. De Beeze, “Alcoholic Fermentation,” Junior World Encyclopedia of Chemical Technology, Vol. 6, 2008, pp. 354-357.
- R. Chang, “Physical Chemistry,” Macmillan, London, 1977, pp. 398-401.
NOTES
*Corresponding author.