 Journal of Behavioral and Brain Science, 2011, 1, 57-68 doi:10.4236/jbbs.2011.12008 Published Online May 2011 (http://www.scirp.org/journal/jbbs) Copyright © 2011 SciRes. JBBS Dyscirculatory Angiopathy of Alzheimer’s Type Ivan V. Maksimovich Clinic of Cardiovascular Diseases named after Most Holy John Tobolsky, Moscow, Russia E-mail: carvasc@yandex.ru Received March 15, 201 1; revised March 30, 2011; accepted April 2, 2011 Abstract Purpose: We assess the significance of dyscirculatory angiopathy of Alzheimer’s type (DAAT) in identify- ing the predisposition to the development and diagnosis of Alzheimer’s disease (AD) different stages. Meth- ods: 108 patients took part in the research:1) 49 aged 34-79 suffering from AD or running an increased risk of its development (those not diagnosed with AD but having growing memory disorders without any mani- festations of dementia or specific cognitive impairments, and having 2 or more immediate relatives with AD) - Test Group; 2) 59 aged 28-78 suffering from different types of brain lesions accompanied by dementia but not suffering from AD or corresponding to their age norm - Control Group. All the patients underwent MRI, CT with subsequent calculation of the temporal lobes atrophy degree, brain scintigraphy (SG), rheoencepha- lography (REG), and MUGA. Results: Characteristic features of patients with an increased risk of AD as well as at its various stages are: 1) Temporal lobes and hippocampus atrophy ranging from 4% among those with an increased risk of AD to 62% among those at its advanced stages; 2) DAAT manifestations: reduction of the capillary bed in the temporal and frontoparietal regions with the development of multiple arterioven- ous shunts of the same localization and correspondent early venous discharge accompanied by venous stasis on the border of the frontal and parietal region; 3) DAAT phenomena equally develop both among those with an increased risk of developing AD and those at various AD stages. Similar changes are not observed among Control Group patients with other brain lesions, regardless of the severity of dementia, as well as among practically healthy people of the corresponding age group. Conclusion: Timely identification of the above- mentioned changes can reveal a predisposition to AD development long before its initial manifestations, and it allows differentiating AD from other diseases attended by dementia. In both cases, timely diagnosis allows beginning timely treatment and thus achieving more stable results. Keywords: Alzheimer’s Disease, Dementia, Hippocampus, Temporal Lobes Atrophy, Dyscirculatory Angiopathy of Alzheimer’s Type 1. Introduction Alzheimer’s disease (AD) is becoming more widespread each year. According to the Alzheimer’s Association, in 2007, 5.1 million cases were registered only in the United States [1]. In 2009, the number of cases increased to 5.3 million [2], and in 2050 it will approximately increase to 13.5 million [3]. In 2010, there were 35.6 million pa- tients around the world, and it is estimated that by 2050 this figure will approach 115.4 million [4]. It all suggests that AD is becoming a global problem of mankind. One of the important issues in solving this problem is early diagnosis of the disease and timely visualization of changes and processes in the brain during disease devel- opment [5]. Another issue of no less importance is the differentiation of AD from other diseases that are char- acterized by the development of dementia [6-8]. A great step in the diagnosis of AD was the introduce- tion of CT and MRI which made it possible to visualize the brain and to detect changes developing in the tissues of the temporal lobes and the hippocampus [9-12]. However, using standard CT or MRI techniques does not always allow differentiating AD from other diseases as- sociated with dementia [13]. The introduction of PET has made it possible to carry out not only structural but also functional studies of the hippocampus [14-17] which consequently led to the development of fairly complex integrated visualization techniques [18]. The next achie- vement in AD diagnosis was the emerging of biomarkers and the development of various methods of their use, but  58 I. V. MAKSIMOVICH this extremely promising research is still under study [19]. There are certain problems in the diagnosis of early stage disease accompanied by mild dementia and Mild Cognitive Impairment (MCI) [16,17]. It is even more difficult to diagnose pre-clinical stages when the disease has not yet developed, there are no manifestations of dementia, and its development is only probable [13,19, 20]. Despite the fact that it was in the 1930s when F. Morel found out that AD was accompanied by dysoric or dru- soidal angiopathy, the state of the brain vascular system in Alzheimer’s disease has received insufficient attention. Until recently, medical literature had only some isolated reports on this subject [21-24]. The research was mostly carried out by means of ultrasound and MRI techniques which did not always give a clear picture. Accordingly, hemodynamic changes of the brain [25] and the devel- opment of perfusion abnormalities [26,27] have been looked at from the function al side to a greater ex tent, and vascular disorders were seen in terms of location of amy- loid deposits and amyloid angiopathy [28-30], but not in terms of vascular pathology. Visualization of arte- rial, capillary and venous blood flow of the brain, as well as their correlation in AD, has yet received insufficient at- tention. 2. Materials and Methods The whole research was made with the approval of the Ethics Committee and with the consent of the examined patients and their relatives. Our objective was to identify specific structural defects and their correlation with an- gioarchitectonic changes appearing in the brain during AD development, as well as the identification of these changes among patients with a predisposition to AD de- velopment, and their comparison with cerebral and cere- brovascular changes that occur in the control group of patients of the same age who suffer from other lesions of the brain accompanied by the development of dementia or not accompanied by the development of dementia. To carry out complete differential diagnosis of all the pa- tients was not the objective of this research . 108 patients aged from 28 to 79 (average age 67) were examined during the research. The Test Group included 49 patients aged from 34 to 79 (average age 65), 18 men (36.7%) and 31 women (63.3%). 43 patients suffering from AD were subdivided ac- cording to one of the most common classifications pro- posed by J. C. Morris in 1993 (The Clinical Dementia Rating /CDR/) [31]: CDR-1 - Group with mild dementia, mild cognitive impairment, had previously been diagnosed AD, medical history did not exceed 2 years - 15 (30.6%) patients; CDR-2 - Group with moderate dementia, quite per- sistent cognitive impairment, had previously been diagnosed with AD, history of the disease ranged from 2 to 6 years - 20 (40.8%) patients; CDR-3 - Group with fairly severe dementia, gross cognitive impairment, had previously been diag- nosed with AD, history of the disease ranged from 7 to 15 years - 8 (16.3%) patients; A separate group of 6 (12.2%) included the patients’ relatives with a high risk of developing the disease who wished to have an examination. They were all fairly young, aged from 34 to 42, had growing memory disorders without any manifestations of dementia or any specific cognitiv e impairment. The Control Group included 59 patients aged from 28 to 78 (average age 68), 36 (61.0%) men and 23 (39.0%) women. Control Group patients either had different types of brain lesions with varying degrees of severity accompa- nied by signs of dementia and cognitive impairment, but did not suffer from Alzheimer’s disease or considered themselves healthy; they did not have any specific com- plaints and their brain changes were seen as age-corre- sponding and normal. Those patients were divided into the following groups: A group at the initial stage of chronic cerebrovas- cular insufficiency of atherosclerotic genesis with- out any signs of dementia or cognitive impairment; usually those patients, regardless of age, had some complaints which were considered normal taking into account age-related changes of the brain - 17 (28.8%) pat ie n t s; A group with sufficiently severe chronic cere- brovascular insufficiency of atherosclerotic genesis without gross occlusive vascular lesions; they had incipient mild dementia and initial cognitive im- pairment - 12 (20.3%) patients; A group with multiple atherosclerotic lesions of the brain, severe vascular dementia and cognitive im- pairment, with a history of recurrent small focal strokes - 6 (10. 2%) pati e nt s; A group with atherosclerotic (vascular) Parkinson- ism and signs of dementia - 14 (23.7%) patients; A group with Binswanger's disease and manifesta- tions of dementia - 6 (10.2%) patients; A group with Parkinson’s disease and manifesta- tions of dementia 4 (6.8%) patients. The research plan included: computed tomography of the brain (CT), magnetic resonance imaging (MRI), scin- tigraphy of the brain (SG), rheoencephalography (REG), Copyright © 2011 SciRes. JBBS  I. V. MAKSIMOVICH 59 multi-gated angiography (MUGA). CT was preferred over MRI in the research, as it was necessary to better visualize calcium deposits in the vas- cular wall in atherosclerotic lesions and to identify the nature of vascular pathology. The main goal of the re- search was study of the changes in the temporal lobes and the hippocampus, as they are the first to suffer from the development of AD [9-12,16,17], as well as the fact that they are easily enough visualized on the scans by bone forma ti o ns. CT of the brain was performed on apparatus “Soma- tom” (Siemens), “HiSpeed” (GE), “Tomoscan” (Philips) by the following procedure: the patient was placed ac- cording to the classical pattern, the boundary of the first scan took place on the orbital-miotal line, producing scans 2.5 mm thick with an interval of 2.5 mm. The boundaries of cerebral fosses on both sides were ascer- tained by bone marks. A consistent two-side measure- ment of cerebral fosses region and measurement of the size of the substance of the right and left temporal lobes of the brain for each scan were made with computer pro- gram “Advanced Tomo Area Analysis” (ATAA). Next, the area of the lower horn of lateral ventricle and the area of the sulci were subtracted and then compared with the area of the corresponding cranial fossa at the same level. The ratio of these quantities makes it p ossible to compare the state of brain tissue both in its normal condition and during the development of atrophic process. Reduction of the size of the brain tissue area at each scan corre- sponds to the severity of atrophic changes at this brain level. Then the above mentioned quantities were auto- matically recalculated by the thickness of each scan and each interval between the scans, and the volume of the right and left temporal lobes of the brain was determined, and thus the mass of brain tissue in the surveyed areas was calculated. Next, the masses of tissue of left and right temporal lobes were summed up. The results of the research automatically showed both the normal amount of tissue for the corresponding age group and the per- centage decrease of the volume of the temporal lobes of the brain. The percentage ratio of those values deter- mined the severity of atrophic changes in the temporal regions of the brain and, consequently, in the hippocam- pus tissue [12,32]. The data showed a tendency to de- velop Alzheimer’s disease or the stage of its develop- ment in the experimental group and also pointed at the pres- ence or absence of atrophic changes in the temporal lobes of the brain in the control group of patients. Due to the fact that examined patients belonged to different age groups, the study took into account age-related changes in brain tissue [32,34]. For example, the fact that patients aged 60 and older had common atrophic changes of the brain, along with a decrease of the size of the temporal lobes of up to 5%, was regarded as natural age-related changes and equal to normal [33]. SG of the brain was carried out on a gamma camera (Ohio Nuclear, U.S.) following the classical method in dynamic and static mode using the TC 99M pertechnetat 555. REG was conducted by means of “Reospektr-8” (Neurosoft, Russia) in accordance with the standard automated method with the determination of pulse vol- ume abnormalities. MUGA of the brain was performed on apparatus “Advantx” (GE) following the classical method of trans- femoral access. 10 - 12 ml of Omnipack 350 was intro- duced intra-carotidally and 7 - 8 ml intra-vertebrally. Registration was carried out in direct and side projec- tions in constant subtraction mode at a speed of 25 frames per second. 3. Results Since all classifications of stages and types of AD are functional in nature [6,8,18] and are not based on mor- phological changes, we have slightly modified the pre- viously used classification proposed by J. C. Morris (The Clinical Dementia Rating) [31] and added a morpho- logical component to it. Thus, the patients were divided into groups in accordance with the degree of severity of atrophic changes in the temporal lobes of the brain, as well as the degree of severity of dementia, cognitive im- pairment and the severity and duration of the disease. Analyzing the results obtained, we introduced Group CDR-0 (as opposed to the method proposed by J. C. Morris where the earliest stage was represented by Group CDR-0,5). In our research, this group included relatives of patients with AD, i.e. people aged from 34 to 42 who had not been diagnosed with AD but who had growing memory disorders without any manifestations of dementia or any specific cognitive impairment and who had 2 or more immediate relatives suffering from AD. These patients were identified as a group running a high risk of acquiring the disease or a group with a possibility of its inheritance. In the Test Group of patients, CT revealed the follow- ing main types of changes in brain tissue (Table 1): In Group CDR-0: 4 (66.6%) patients had atrophy of the temporal lobes of the brain with a decrease of tissue mass of 4% - 8% (Figures 1(a), 1(b)). 2 (33.4%) patients did not have any atrophic changes at the time of the examination, so they were with- drawn from those wit h a possible i nheritance of AD; In Group CDR-1: 15 (100%) patients with mild de- mentia, mild cognitive impairment, early clinical stage of the disease and a history of up to 2 years had atrophy of the temporal lobes with a decrease of Copyright © 2011 SciRes. JBBS  60 I. V. MAKSIMOVICH tissue mass of 9% - 18% (Figures 2(a), 2(b)); In Group CDR-2: 20 (100%) patients with moderate dementia, persistent cognitive impairment, middle clinical stage of the disease and a hi story of 2 to 6 y ears, had atrophy of the temporal lobes with a decrease of tissue mass of 19% - 32% (Figures 3(a), 3(b)). In Group CDR-3: 8 (100%) patients with severe dementia, gross cognitive impairment, late-stage clinical AD and a history of 6 to 15 years had gross atrophy of the temporal lobes accompanied by a de- Figure 1. Tomograms of patient P. (36 years old, fe- male) with an increased risk of AD development. (a) 7% atrophy of the right temporal lobe (zones 1 - 4); (b) 8% atrophy of the left temporal lobe (zones 1 - 3). Ar- rows indicate dilation of Sylvius fissure and subar- obchnoidal space. Figure 2 Tomograms of patient S. (42 years old, male); 2-year anamnesis of the disease. (a) 18% at- rophy of the right temporal lobe (zones 1 - 4); (b) 17% atrophy of the left temporal lobe (zones 1 - 4). crease of tissue mass of 33-62%; in some cases those changes were accompanied by formation of rather extensive cavities in th e tissue (Figures 4(a), 4( b)). Simultaneously, patients of the Test Group had the following: Absence or insignificant amount of calcium salts deposits in the walls of cerebral vessels - 47 (100%) patients; Dilation of Sylvian fissure (Figures 1-4) associated with atrophic changes, mainly of the temporal and partially frontal lobes of the brain - 47 (100%) pa- tients; Copyright © 2011 SciRes. JBBS 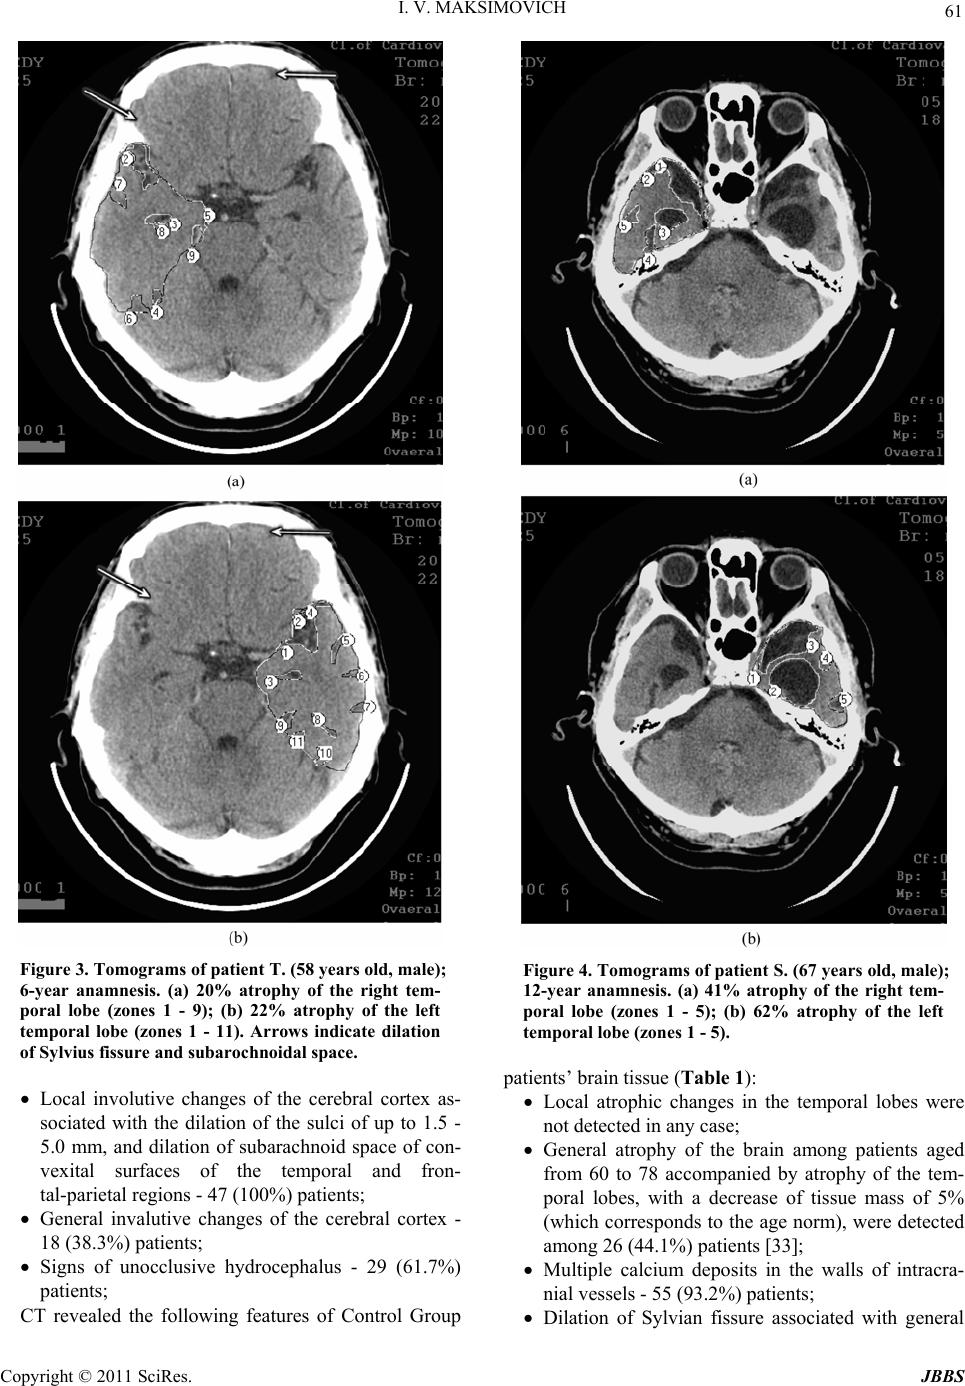 I. V. MAKSIMOVICH 61 Figure 3. Tomograms of patient T. (58 years old, male); 6-year anamnesis. (a) 20% atrophy of the right tem- poral lobe (zones 1 - 9); (b) 22% atrophy of the left temporal lobe (zones 1 - 11). Arrows indicate dilation of Sylvius fissure and subarochnoidal spac e . Local involutive changes of the cerebral cortex as- sociated with the dilation of the sulci of up to 1.5 - 5.0 mm, and dilation of subarachnoid space of con- vexital surfaces of the temporal and fron- tal-parietal regions - 47 (100%) patients; General invalutive changes of the cerebral cortex - 18 (38.3%) patients; Signs of unocclusive hydrocephalus - 29 (61.7%) patients; CT revealed the following features of Control Group Figure 4. Tomograms of patient S. (67 years old, male); 12-year anamnesis. (a) 41% atrophy of the right tem- poral lobe (zones 1 - 5); (b) 62% atrophy of the left temporal lobe (zones 1 - 5). patients’ b ra i n tissue (Table 1): Local atrophic changes in the temporal lobes were not detected in any case; General atrophy of the brain among patients aged from 60 to 78 accompanied by atrophy of the tem- poral lobes, with a decrease of tissue mass of 5% (which corresponds to the age norm), were detected among 26 (44.1%) patients [33]; Multiple calcium deposits in the walls of intracra- nial vessels - 55 (9 3. 2%) patients; Dilation of Sylvian fissure associated with general Copyright © 2011 SciRes. JBBS 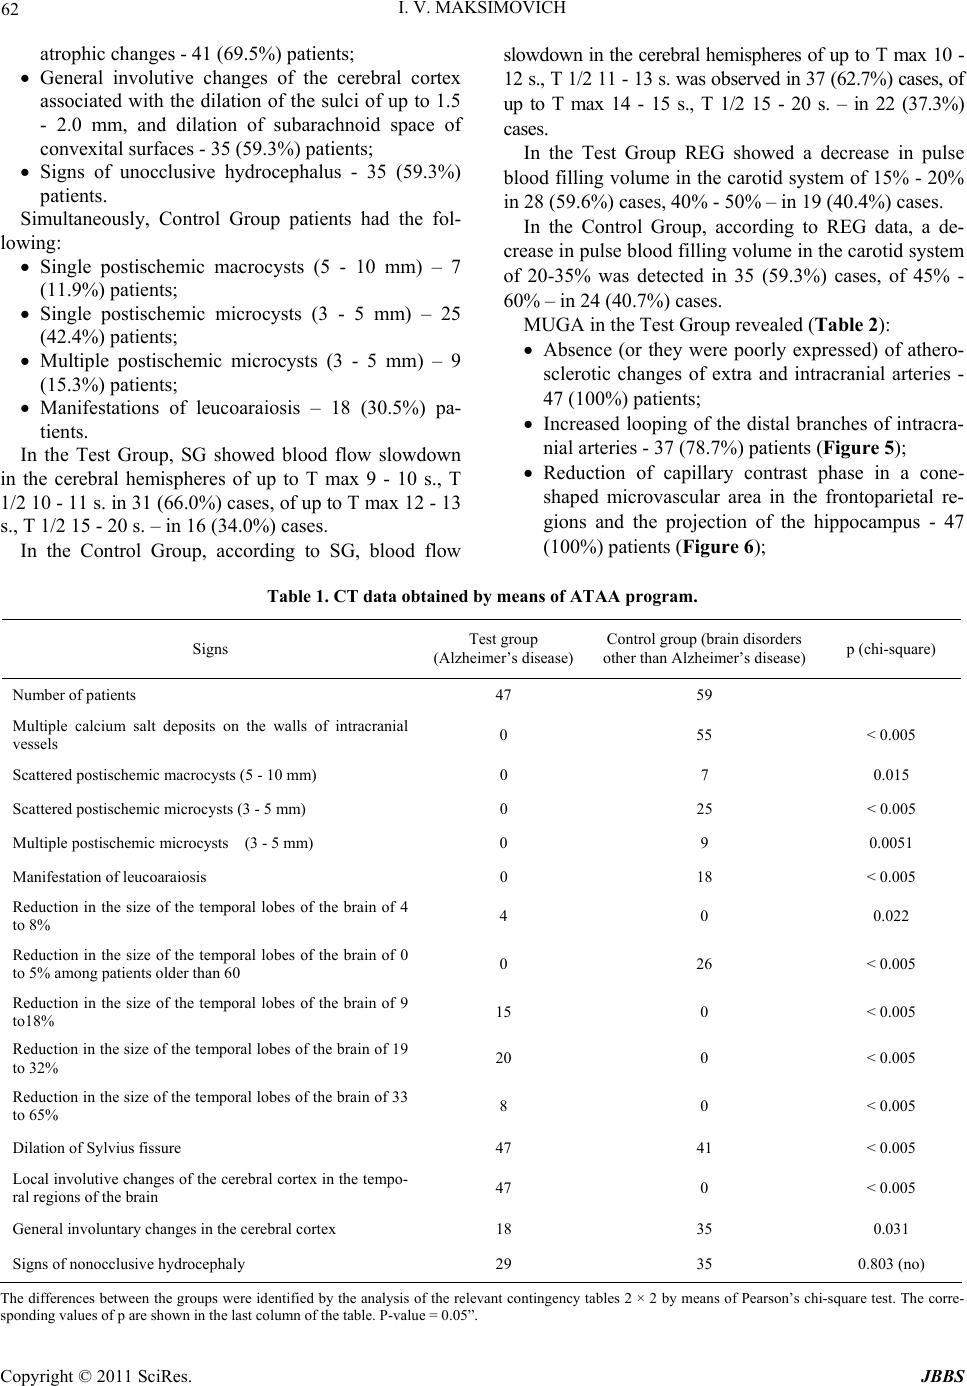 I. V. MAKSIMOVICH Copyright © 2011 SciRes. JBBS 62 atrophic chang es - 41 (6 9. 5%) patients; General involutive changes of the cerebral cortex associated with the dilation of the sulci of up to 1.5 - 2.0 mm, and dilation of subarachnoid space of convexital surfaces - 35 (59.3%) patients; Signs of unocclusive hydrocephalus - 35 (59.3%) patients. Simultaneously, Control Group patients had the fol- lowing: Single postischemic macrocysts (5 - 10 mm) – 7 (11.9%) pat ie n t s; Single postischemic microcysts (3 - 5 mm) – 25 (42.4%) pat ie n t s; Multiple postischemic microcysts (3 - 5 mm) – 9 (15.3%) pat ie n t s; Manifestations of leucoaraiosis – 18 (30.5%) pa- tients. In the Test Group, SG showed blood flow slowdown in the cerebral hemispheres of up to T max 9 - 10 s., T 1/2 10 - 11 s. in 31 (66.0%) cases, of up to T max 12 - 13 s., T 1/2 15 - 20 s. – in 16 (34.0%) cases. In the Control Group, according to SG, blood flow slowdown in the cerebral hemispheres of up to T max 10 - 12 s., T 1/2 11 - 13 s. was ob served in 37 (62.7%) cases, of up to T max 14 - 15 s., T 1/2 15 - 20 s. – in 22 (37.3%) cases. In the Test Group REG showed a decrease in pulse blood filling volume in the caro tid system of 15% - 20% in 28 (59.6%) cases, 40% - 50% – in 19 (40.4%) cases. In the Control Group, according to REG data, a de- crease in pulse blood filling volume in the carotid system of 20-35% was detected in 35 (59.3%) cases, of 45% - 60% – in 24 (40.7%) cases. MUGA in the Test Group revealed (Table 2): Absence (or they were poorly expressed) of athero- sclerotic changes of extra and intracranial arteries - 47 (100%) patients; Increased looping of the distal branches of intracra- nial arteries - 37 (7 8.7%) patients (Figure 5); Reduction of capillary contrast phase in a cone- shaped microvascular area in the frontoparietal re- gions and the projection of the hippocampus - 47 (100%) patients (Figure 6); Table 1. CT data obtained by means of ATAA program. Signs Test group (Alzheimer’s disease)Control group (brain disor ders other than Alzheimer’s disease) p (chi-square) Number of patients 47 59 Multiple calcium salt deposits on the walls of intracranial vessels 0 55 < 0.005 Scattered postischemic macr ocysts (5 - 10 mm) 0 7 0.015 Scattered postischemic microcysts (3 - 5 mm) 0 25 < 0.005 Multiple postischemic microcysts (3 - 5 mm) 0 9 0.0051 Manifestation of leucoaraiosis 0 18 < 0.005 Reduction in the size of the temporal lobes of the brain of 4 to 8% 4 0 0.022 Reduction in the size of the temporal lobes of the brain of 0 to 5% among patients older tha n 60 0 26 < 0.005 Reduction in the size of the temporal lobes of the brain of 9 to18% 15 0 < 0.005 Reduction in the size of the temporal lobes of the brain of 19 to 32% 20 0 < 0.005 Reduction in the size of the temporal lobes of the brain of 33 to 65% 8 0 < 0.005 Dilation of Sylvius fissure 47 41 < 0.005 Local involutive changes of the cerebral cortex in the tempo- ral regions of the brain 47 0 < 0.005 General involuntary changes in the cer e bral cortex 18 35 0.031 Signs of nonocclusive hydrocephaly 29 35 0.803 (no) The differences between the groups were identified by the analysis of the relevant contingency tables 2 × 2 by means of Pearson’s chi-square tes t. The corre- sponding val ues of p are shown in the last column of the table. P-value = 0.05”. 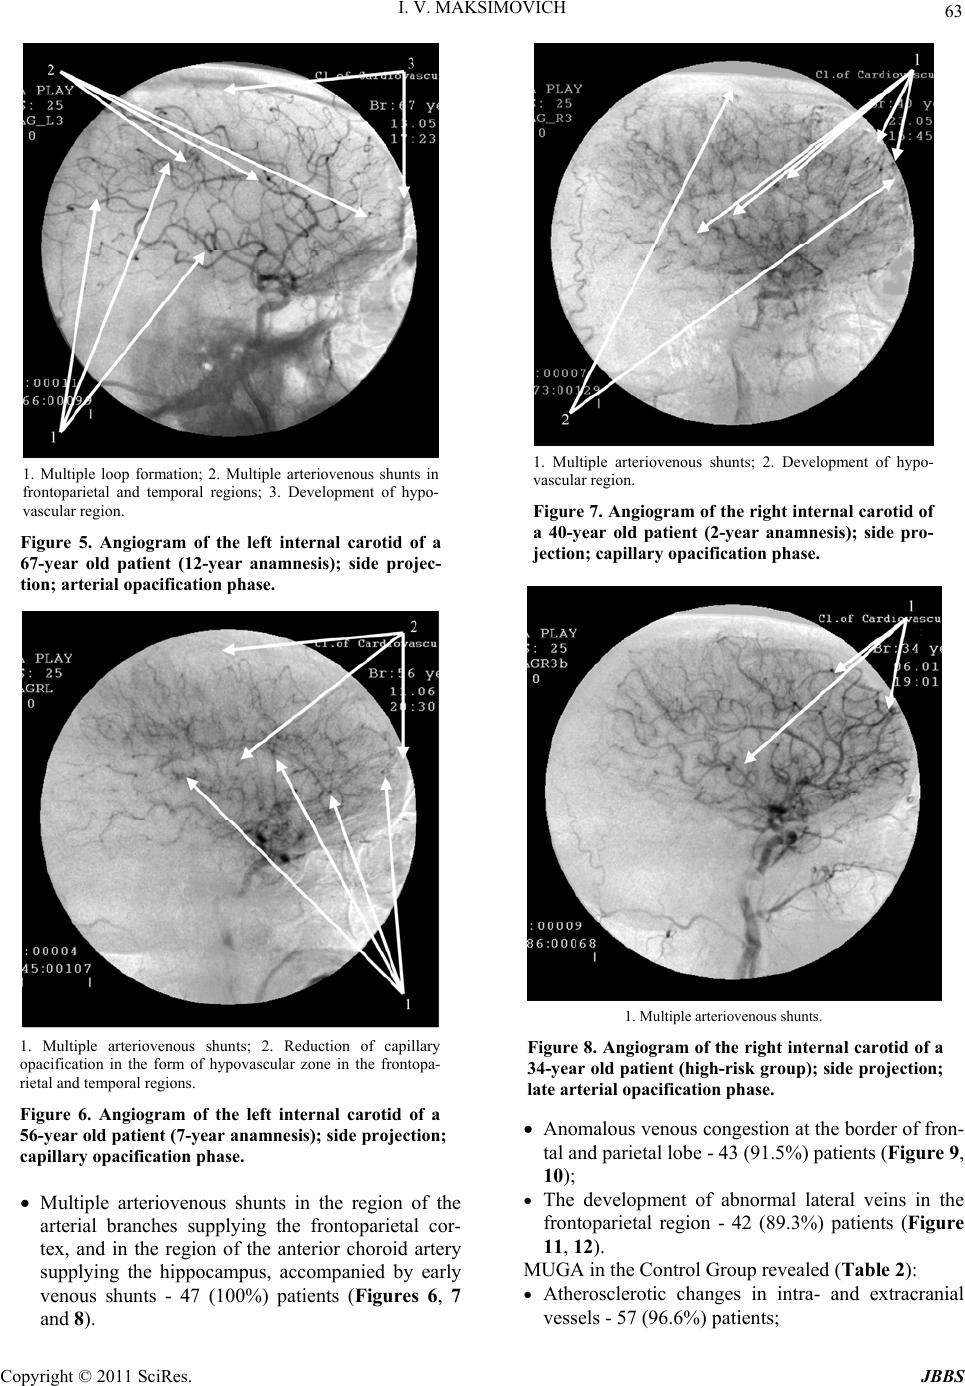 I. V. MAKSIMOVICH Copyright © 2011 SciRes. JBBS 63 1. Multiple loop formation; 2. Multiple arteriovenous shunts in frontoparietal and temporal regions; 3. Development of hypo- vascular region. Figure 5. Angiogram of the left internal carotid of a 67-year old patient (12-year anamnesis); side projec- tion; arterial opacification phase. 1. Multiple arteriovenous shunts; 2. Reduction of capillary opacification in the form of hypovascular zone in the frontopa- rietal and temporal regions. Figure 6. Angiogram of the left internal carotid of a 56-year old patient (7-year anamnesis); side projection; capillary opacification phase. Multiple arteriovenous shunts in the region of the arterial branches supplying the frontoparietal cor- tex, and in the region of the anterior choroid artery supplying the hippocampus, accompanied by early venous shunts - 47 (100%) patients (Figures 6, 7 and 8). 1. Multiple arteriovenous shunts; 2. Development of hypo- vascular region. Figure 7. Angiogram of the right internal carotid of a 40-year old patient (2-year anamnesis); side pro- jection; capillary opacification p h ase. 1. Multiple a rteriovenous shunts. Figure 8. Angiogram of the right internal carotid of a 34-year old patient (high-ri sk group); side projection; late arterial opacification phase. Anomalous venous congestion at the border of fron- tal and parietal lobe - 43 (91.5%) patients (Figure 9, 10); The development of abnormal lateral veins in the frontoparietal region - 42 (89.3%) patients (Figure 11, 12). MUGA in the Control Group revealed (Tab le 2): Atherosclerotic changes in intra- and extracranial vessels - 57 (96. 6 %) pati e nt s; 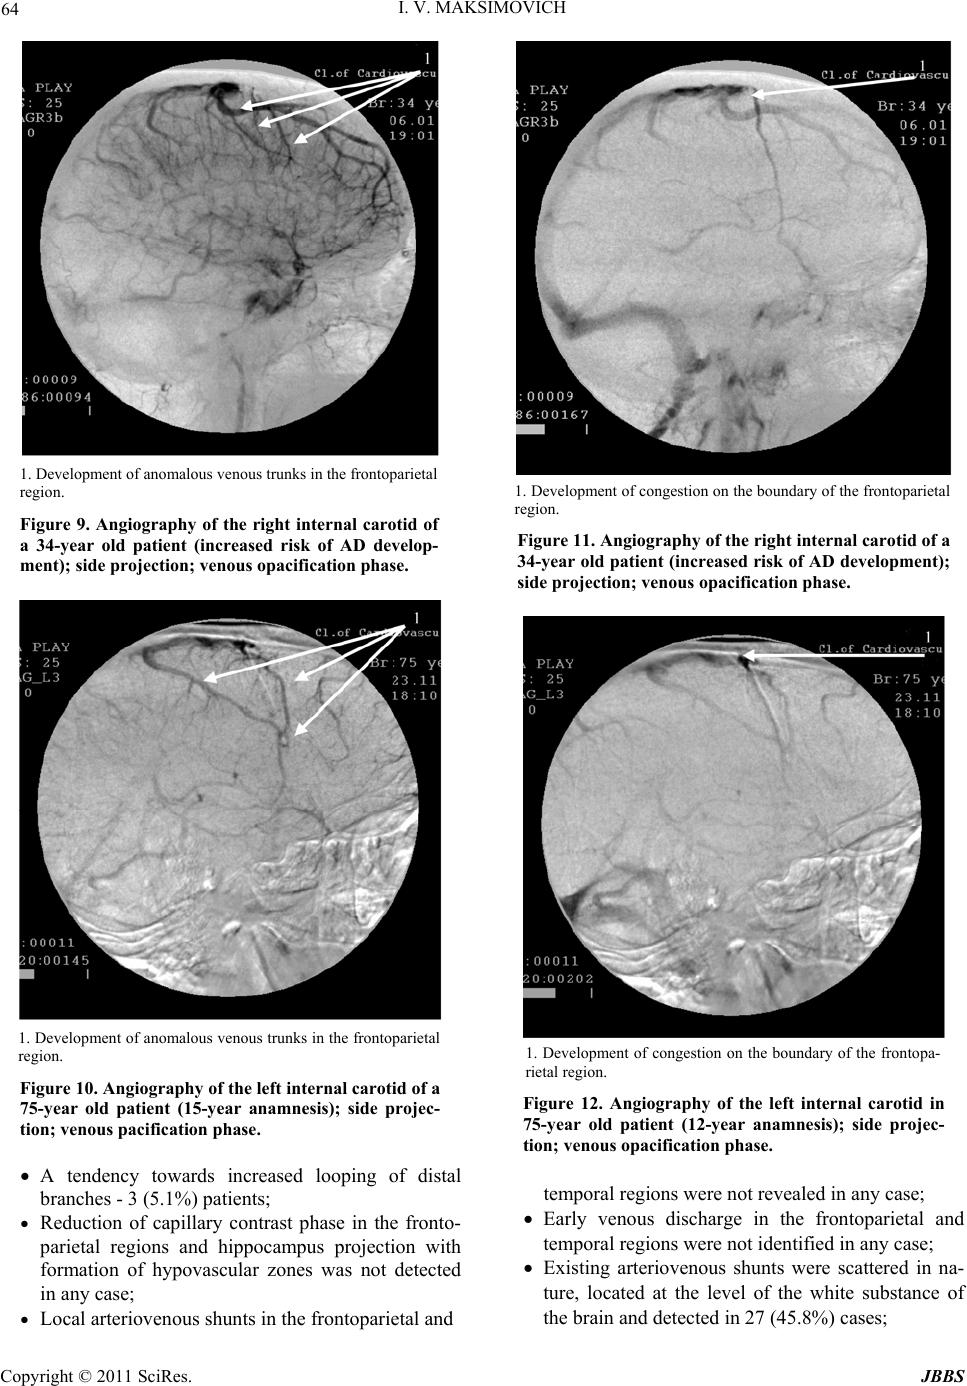 64 I. V. MAKSIMOVICH 1. Development of anomalous venous trunks in the frontoparietal region. Figure 9. Angiography of the right internal carotid of a 34-year old patient (increased risk of AD develop- ment); side projection; venous opacification phase. 1. Development of anomalous venous trunks in the frontoparietal region. Figure 10. Angiography of the left internal carotid of a 75-year old patient (15-year anamnesis); side projec- tion; venous pacification phase. A tendency towards increased looping of distal branches - 3 (5.1%) patients; Reduction of capillary contrast phase in the fronto- parietal regions and hippocampus projection with formation of hypovascular zones was not detected in any case; Local arteriovenous shunts in the frontoparietal and 1. Development of congestion on the boundary of the frontoparietal region. Figure 11. Angiography of the right internal carotid of a 34-year old patient (increased risk of AD development); side projection; venous opacification phase. 1. Development of congestion on the boundary of the frontopa- rietal region. Figure 12. Angiography of the left internal carotid in 75-year old patient (12-year anamnesis); side projec- tion; venous opacification phase. temporal regions were not revealed in any case; Early venous discharge in the frontoparietal and temporal regions were not iden tified in any case; Existing arteriovenous shunts were scattered in na- ture, located at the level of the white substance of the brain and detected in 27 (45.8%) cases; Copyright © 2011 SciRes. JBBS 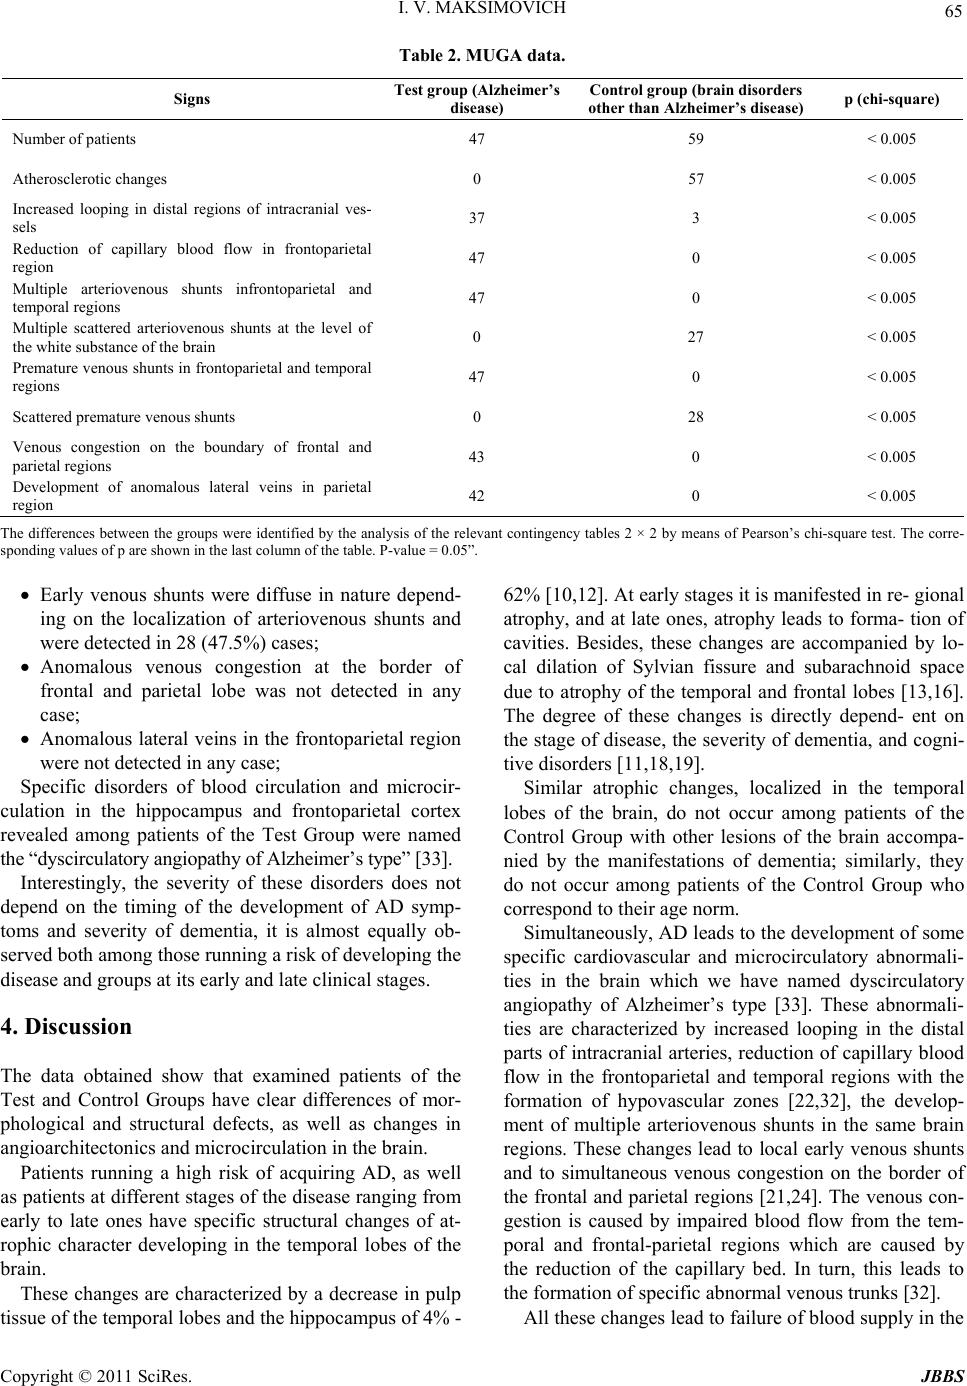 I. V. MAKSIMOVICH Copyright © 2011 SciRes. JBBS 65 Table 2. MUGA data. Signs Test group (Alzheimer’s disease) Control group (brain disorders other than Alzheimer’s disease) p (chi-square) Number of patients 47 59 < 0.005 Atherosclerotic changes 0 57 < 0.005 Increased looping in distal regions of intracranial ves- sels 37 3 < 0.005 Reduction of capillary blood flow in frontoparietal region 47 0 < 0.005 Multiple arteriovenous shunts infrontoparietal and temporal regions 47 0 < 0.005 Multiple scattered arteriovenous shunts at the level of the white substance of the bra in 0 27 < 0.005 Premature venous shunts in frontoparietal and temporal regions 47 0 < 0.005 Scattered premature venous shunts 0 28 < 0.005 Venous congestion on the boundary of frontal and parietal regions 43 0 < 0.005 Development of anomalous lateral veins in parietal region 42 0 < 0.005 The differences between the groups were identified by the analysis of the relevant contingency tables 2 × 2 by means of Pearson’s chi-square tes t. The corre- sponding val ues of p are shown in the last column of the table. P-value = 0.05”. Early venous shunts were diffuse in nature depend- ing on the localization of arteriovenous shunts and were detected in 28 (47.5%) cases; Anomalous venous congestion at the border of frontal and parietal lobe was not detected in any case; Anomalous lateral veins in the frontoparietal region were not detected in any case; Specific disorders of blood circulation and microcir- culation in the hippocampus and frontoparietal cortex revealed among patients of the Test Group were named the “dyscirculatory angiopathy of Alzheimer’s type” [33]. Interestingly, the severity of these disorders does not depend on the timing of the development of AD symp- toms and severity of dementia, it is almost equally ob- served both among those running a risk of developing the disease and groups at its early and late clinical stages. 4. Discussion The data obtained show that examined patients of the Test and Control Groups have clear differences of mor- phological and structural defects, as well as changes in angioarchitectonics and microcirculation in the brain. Patients running a high risk of acquiring AD, as well as patients at different stages of the disease ranging from early to late ones have specific structural changes of at- rophic character developing in the temporal lobes of the brain. These changes are characterized by a decrease in pulp tissue of the temporal lobes and the hippocampus of 4% - 62% [10,12]. At early stages it is manifested in re- gional atrophy, and at late ones, atrophy leads to forma- tion of cavities. Besides, these changes are accompanied by lo- cal dilation of Sylvian fissure and subarachnoid space due to atrophy of the temporal and frontal lobes [13,16]. The degree of these changes is directly depend- ent on the stage of disease, the severity of dementia, and cogni- tive disorders [11,18,19]. Similar atrophic changes, localized in the temporal lobes of the brain, do not occur among patients of the Control Group with other lesions of the brain accompa- nied by the manifestations of dementia; similarly, they do not occur among patients of the Control Group who correspond to their age norm. Simultaneously, AD leads to the development of some specific cardiovascular and microcirculatory abnormali- ties in the brain which we have named dyscirculatory angiopathy of Alzheimer’s type [33]. These abnormali- ties are characterized by increased looping in the distal parts of intracranial arteries, reduction of capillary blood flow in the frontoparietal and temporal regions with the formation of hypovascular zones [22,32], the develop- ment of multiple arteriovenous shunts in the same brain regions. These changes lead to local early venous shunts and to simultaneous venous congestion on the border of the frontal and parietal regions [21,24]. The venous con- gestion is caused by impaired blood flow from the tem- poral and frontal-parietal regions which are caused by the reduction of the capillary bed. In turn, this leads to the formation of specific abnormal venous trunks [32]. All these changes lead to failure of bloo d supply in the 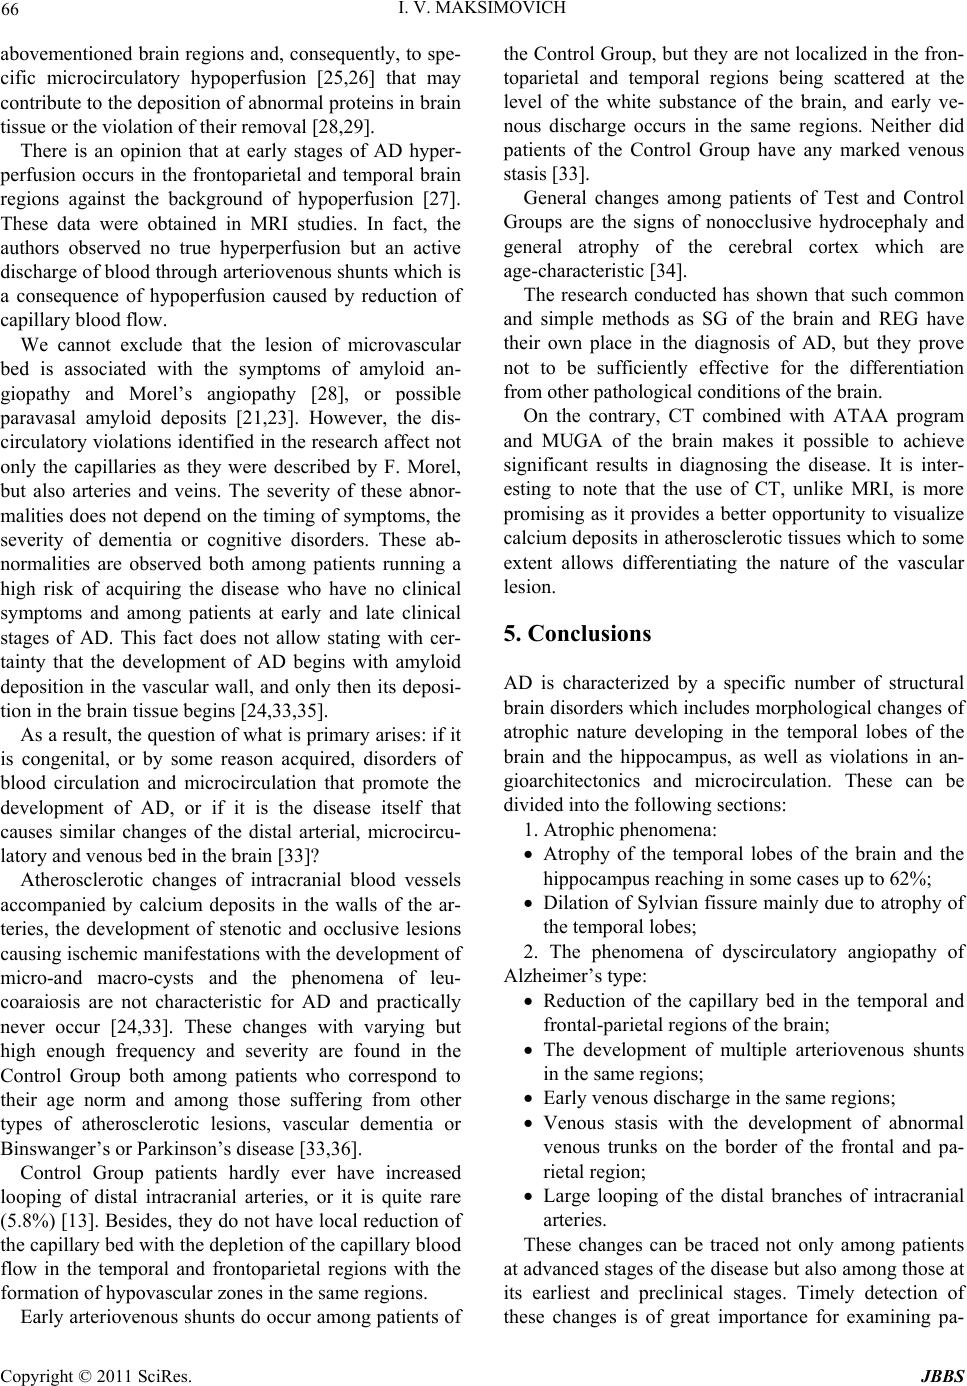 66 I. V. MAKSIMOVICH abovementioned brain regions and, consequently, to spe- cific microcirculatory hypoperfusion [25,26] that may contribute to the deposition of abn ormal proteins in brain tissue or the violation of their removal [28,29]. There is an opinion that at early stages of AD hyper- perfusion occurs in the frontoparietal and temporal brain regions against the background of hypoperfusion [27]. These data were obtained in MRI studies. In fact, the authors observed no true hyperperfusion but an active discharge of blood through arteriovenous shunts which is a consequence of hypoperfusion caused by reduction of capillary blood flow. We cannot exclude that the lesion of microvascular bed is associated with the symptoms of amyloid an- giopathy and Morel’s angiopathy [28], or possible paravasal amyloid deposits [21,23]. However, the dis- circulatory violations identified in the research affect not only the capillaries as they were described by F. Morel, but also arteries and veins. The severity of these abnor- malities does not dep end on the timing of sympto ms, the severity of dementia or cognitive disorders. These ab- normalities are observed both among patients running a high risk of acquiring the disease who have no clinical symptoms and among patients at early and late clinical stages of AD. This fact does not allow stating with cer- tainty that the development of AD begins with amyloid deposition in the vascular wall, and only then its deposi- tion in the brain tissue begins [24,33,35]. As a result, the question of what is primary arises: if it is congenital, or by some reason acquired, disorders of blood circulation and microcirculation that promote the development of AD, or if it is the disease itself that causes similar changes of the distal arterial, microcircu- latory and venous bed in the brain [33]? Atherosclerotic changes of intracranial blood vessels accompanied by calcium deposits in the walls of the ar- teries, the development of stenotic and occlusive lesions causing ischemic manifestations with the development of micro-and macro-cysts and the phenomena of leu- coaraiosis are not characteristic for AD and practically never occur [24,33]. These changes with varying but high enough frequency and severity are found in the Control Group both among patients who correspond to their age norm and among those suffering from other types of atherosclerotic lesions, vascular dementia or Binswanger’s or Parkinso n’s disease [33,36]. Control Group patients hardly ever have increased looping of distal intracranial arteries, or it is quite rare (5.8%) [13]. Besides, they do not have local reduction of the capillary bed with the depletion of the capillary b loo d flow in the temporal and frontoparietal regions with the formation of hypovascular zones in the same regions. Early arterioven ous shunts do occur among patien ts of the Control Group, but they are not localized in the fron- toparietal and temporal regions being scattered at the level of the white substance of the brain, and early ve- nous discharge occurs in the same regions. Neither did patients of the Control Group have any marked venous stasis [33]. General changes among patients of Test and Control Groups are the signs of nonocclusive hydrocephaly and general atrophy of the cerebral cortex which are age-characteristic [34]. The research conducted has shown that such common and simple methods as SG of the brain and REG have their own place in the diagnosis of AD, but they prove not to be sufficiently effective for the differentiation from other pathological conditions of the brain. On the contrary, CT combined with ATAA program and MUGA of the brain makes it possible to achieve significant results in diagnosing the disease. It is inter- esting to note that the use of CT, unlike MRI, is more promising as it provides a better opportunity to visualize calcium deposits in atherosclero tic tissues which to some extent allows differentiating the nature of the vascular lesion. 5. Conclusions AD is characterized by a specific number of structural brain disorders which includes morphological changes of atrophic nature developing in the temporal lobes of the brain and the hippocampus, as well as violations in an- gioarchitectonics and microcirculation. These can be divided into the following sections: 1. Atrophic p h e nomena: Atrophy of the temporal lobes of the brain and the hippocampus reaching in some cases up to 62%; Dilation of Sylvian fissu re mainly due to atrophy of the temporal lobes; 2. The phenomena of dyscirculatory angiopathy of Alzheimer’s type: Reduction of the capillary bed in the temporal and frontal-parietal regions of the brain; The development of multiple arteriovenous shunts in the same regions; Early venous discharge in the same regions; Venous stasis with the development of abnormal venous trunks on the border of the frontal and pa- rietal region; Large looping of the distal branches of intracranial arteries. These changes can be traced not only among patients at advanced stages of the disease but also among those at its earliest and preclinical stages. Timely detection of these changes is of great importance for examining pa- Copyright © 2011 SciRes. JBBS 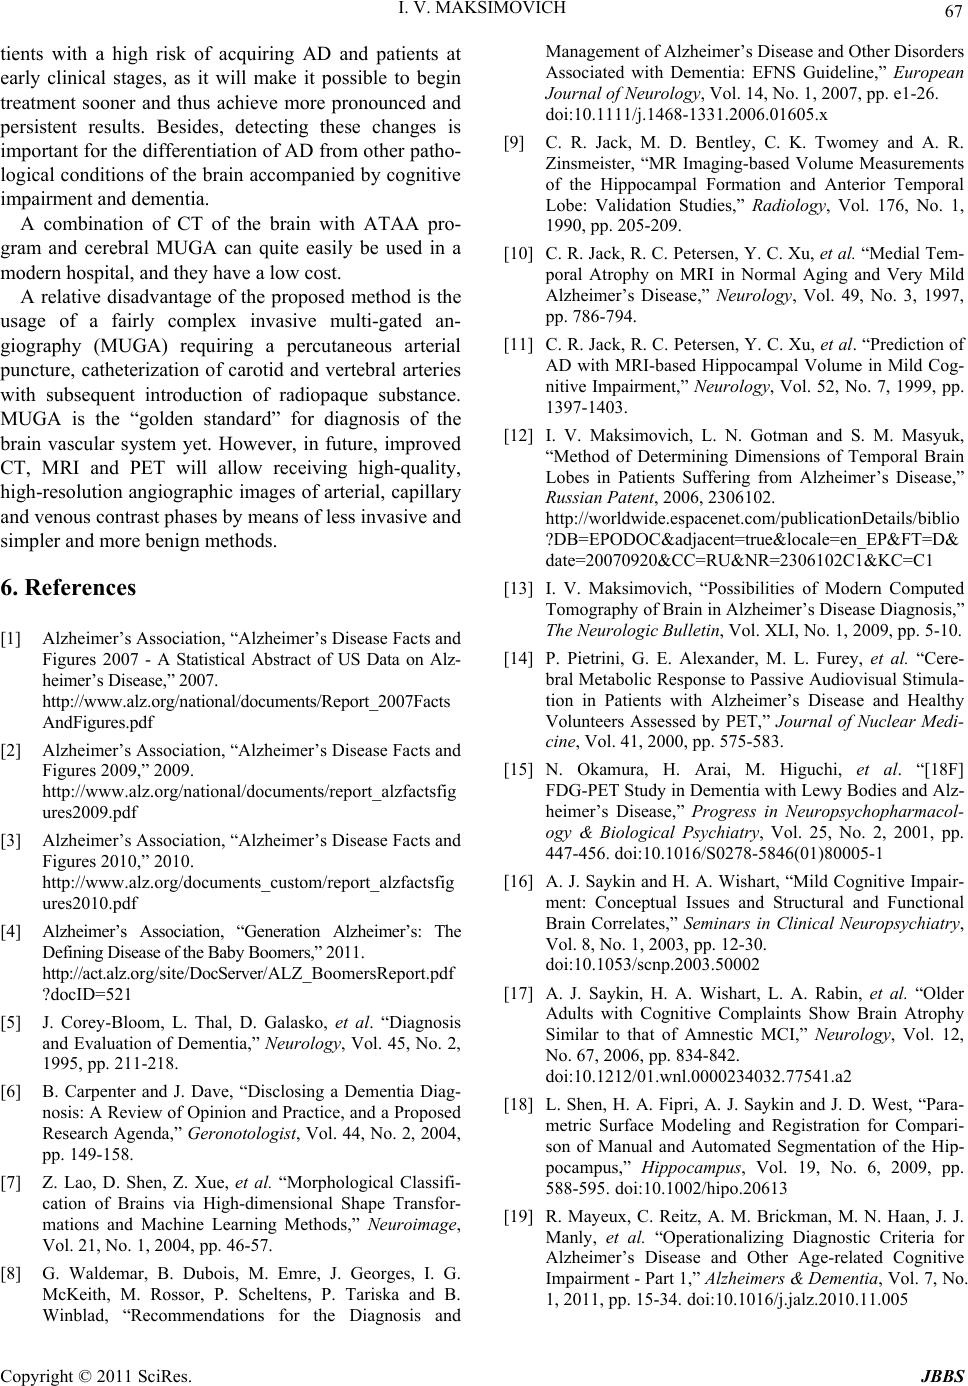 I. V. MAKSIMOVICH 67 tients with a high risk of acquiring AD and patients at early clinical stages, as it will make it possible to begin treatment sooner and thus achieve more pronounced and persistent results. Besides, detecting these changes is important for the differentiation of AD from other patho- logical cond itions of the brain accompanied by co gnitive impairment and dementia. A combination of CT of the brain with ATAA pro- gram and cerebral MUGA can quite easily be used in a modern hospital, and they have a low cost. A relative disadvantage of the proposed method is the usage of a fairly complex invasive multi-gated an- giography (MUGA) requiring a percutaneous arterial puncture, catheterization of carotid and vertebral arteries with subsequent introduction of radiopaque substance. MUGA is the “golden standard” for diagnosis of the brain vascular system yet. However, in future, improved CT, MRI and PET will allow receiving high-quality, high-resolution angiog raphic images of arterial, capillary and venous contrast phases by means of less invasive and simpler and more benign methods. 6. References [1] Alzheimer’s Association, “Alzheimer’s Disease Facts and Figures 2007 - A Statistical Abstract of US Data on Alz- heimer’s Disease,” 2007. http://www.alz.org/national/documents/Report_20 07Facts AndFigures.pdf [2] Alzheimer’s Association, “Alzheimer’s Disease Facts and Figures 2009,” 2009. http://www.alz.org/national/documents/report_alzfactsfig ures2009.pdf [3] Alzheimer’s Association, “Alzheimer’s Disease Facts and Figures 2010,” 2010. http://www.alz.org/documents_custom/report_alzfactsfig ures2010.pdf [4] Alzheimer’s Association, “Generation Alzheimer’s: The Defining Diseas e of the Bab y Boom ers,” 201 1. http://act.alz.org/site/DocServer/ALZ_BoomersReport.pdf ?docID=521 [5] J. Corey-Bloom, L. Thal, D. Galasko, et al. “Diagnosis and Evaluation of Dementia,” Neurology, Vol. 45, No. 2, 1995, pp. 211-218. [6] B. Carpenter and J. Dave, “Disclosing a Dementia Diag- nosis: A Review of Opinion and Practice, and a Proposed Research Agenda,” Geronotologist, Vol. 44, No. 2, 2004, pp. 149-158. [7] Z. Lao, D. Shen, Z. Xue, et al. “Morphological Classifi- cation of Brains via High-dimensional Shape Transfor- mations and Machine Learning Methods,” Neuroimage, Vol. 21, No. 1, 2004, pp. 46-57. [8] G. Waldemar, B. Dubois, M. Emre, J. Georges, I. G. McKeith, M. Rossor, P. Scheltens, P. Tariska and B. Winblad, “Recommendations for the Diagnosis and Management of Alzheimer’s Disease and Other Disorders Associated with Dementia: EFNS Guideline,” European Journal of Neurology, Vol. 14, No. 1, 2007, pp. e1-26. doi:10.1111/j.1468-1331.2006.01605.x [9] C. R. Jack, M. D. Bentley, C. K. Twomey and A. R. Zinsmeister, “MR Imaging-based Volume Measurements of the Hippocampal Formation and Anterior Temporal Lobe: Validation Studies,” Radiology, Vol. 176, No. 1, 1990, pp. 205-209. [10] C. R. Jack, R. C. Petersen, Y. C. Xu, et al. “Medial Tem- poral Atrophy on MRI in Normal Aging and Very Mild Alzheimer’s Disease,” Neurology, Vol. 49, No. 3, 1997, pp. 786-794. [11] C. R. Jac k, R. C. Pet ersen, Y. C. Xu , et al. “Predic tion of AD with MRI-based Hippocampal Volume in Mild Cog- nitive Impairment,” Neurology, Vol. 52, No. 7, 1999, pp. 1397-1403. [12] I. V. Maksimovich, L. N. Gotman and S. M. Masyuk, “Method of Determining Dimensions of Temporal Brain Lobes in Patients Suffering from Alzheimer’s Disease,” Russian Patent, 2006, 2306102. http://worldwide.espacenet.com/publicationDetails/biblio ?DB=EPODOC&adjacent=true&locale=en_EP&FT=D& date=20070920&CC=RU&NR=2306102C1&KC=C1 [13] I. V. Maksimovich, “Possibilities of Modern Computed Tomography of Brain in Alzheimer’s Disease Diagnosis,” The Neurologic Bulletin, Vol. XLI, No. 1, 2009, pp. 5-10. [14] P. Pietrini, G. E. Alexander, M. L. Furey, et al. “Cere- bral Metabolic Response to Passive Audiovisual Stimula- tion in Patients with Alzheimer’s Disease and Healthy Volunteers Assessed by PET,” Journal of Nuclear Medi- cine, Vol. 41, 2000, pp. 575-583. [15] N. Okamura, H. Arai, M. Higuchi, et al. “[18F] FDG-PET Study in Dementia with Lewy Bodies and Alz- heimer’s Disease,” Progress in Neuropsychopharmacol- ogy & Biological Psychiatry, Vol. 25, No. 2, 2001, pp. 447-456. doi:10.1016/S0278-5846(01)80005-1 [16] A. J. Saykin and H. A. Wishart, “Mild Cognitive Impair- ment: Conceptual Issues and Structural and Functional Brain Correlates,” Seminars in Clinical Neuropsychiatry, Vol. 8, No. 1, 2003, pp. 12-30. doi:10.1053/scnp.2003.50002 [17] A. J. Saykin, H. A. Wishart, L. A. Rabin, et al. “Older Adults with Cognitive Complaints Show Brain Atrophy Similar to that of Amnestic MCI,” Neurology, Vol. 12, No. 67, 2006, pp. 834-842. doi:10.1212/01.wnl.0000234032.77541.a2 [18] L. Shen, H. A. Fipri, A. J. Saykin and J. D. West, “Para- metric Surface Modeling and Registration for Compari- son of Manual and Automated Segmentation of the Hip- pocampus,” Hippocampus, Vol. 19, No. 6, 2009, pp. 588-595. doi:10.1002/hipo.20613 [19] R. Mayeux, C. Reitz, A. M. Brickman, M. N. Haan, J. J. Manly, et al. “Operationalizing Diagnostic Criteria for Alzheimer’s Disease and Other Age-related Cognitive Impairment - Part 1,” Alzheimers & Dementia, Vol. 7, No. 1, 2011, pp. 15-34. doi:10.1016/j.jalz.2010.11.005 Copyright © 2011 SciRes. JBBS 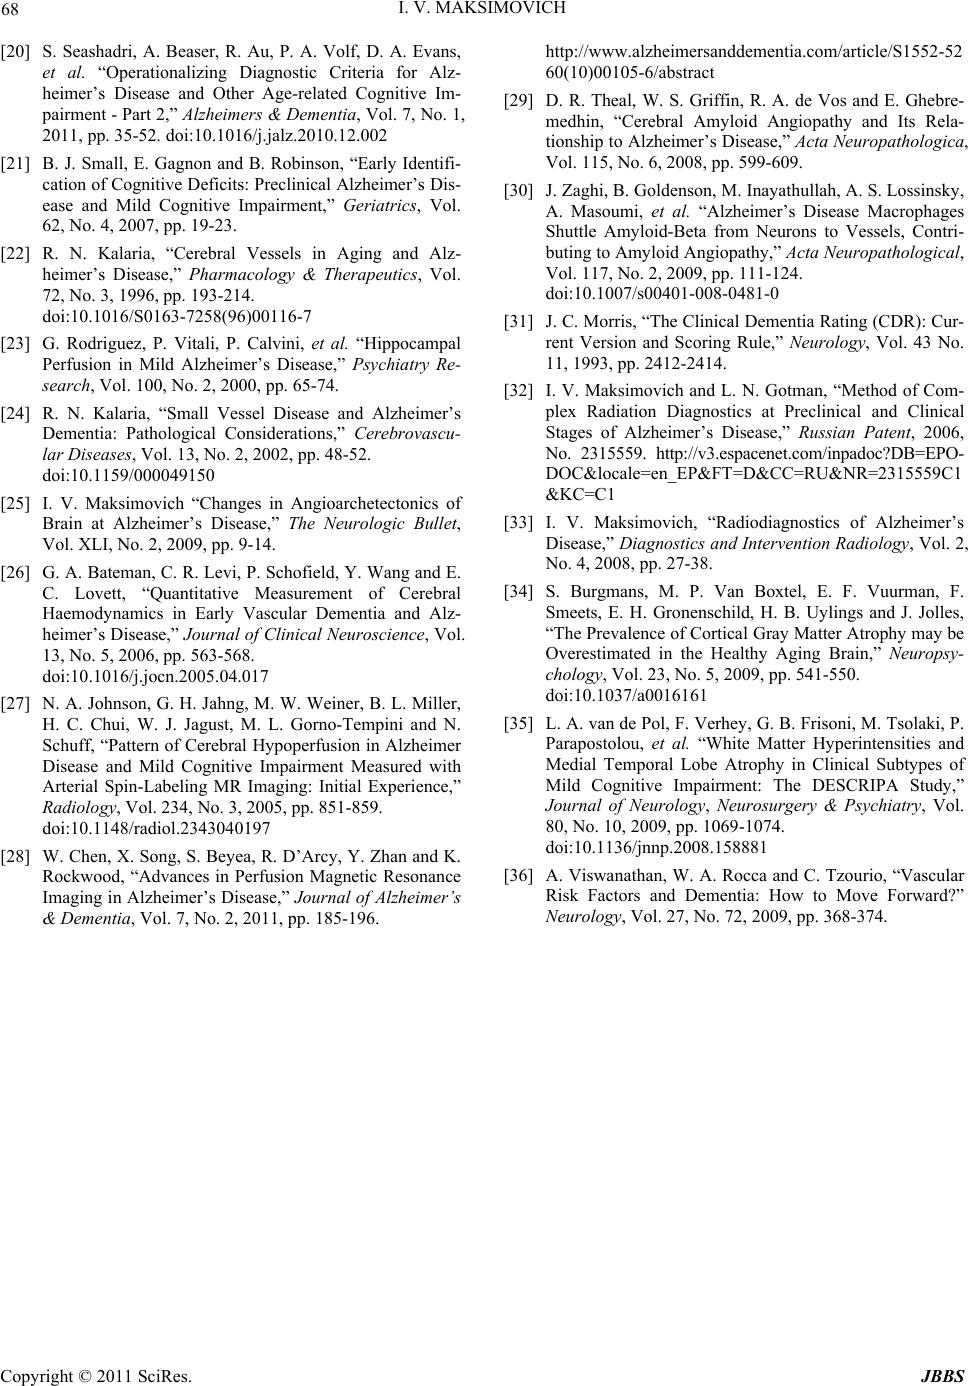 I. V. MAKSIMOVICH Copyright © 2011 SciRes. JBBS 68 [20] S. Seashadri, A. Beaser, R. Au, P. A. Volf, D. A. Evans, et al. “Operationalizing Diagnostic Criteria for Alz- heimer’s Disease and Other Age-related Cognitive Im- pairment - Part 2,” Alzheimers & Dementia, Vol. 7, No. 1, 2011, pp. 35-52. doi:10.1016/j.jalz.2010.12.002 [21] B. J. Small, E. Gagnon and B. Robinson, “Early Identifi- cation of Cognitive Deficits: Preclinical Alzheimer’s Dis- ease and Mild Cognitive Impairment,” Geriatrics, Vol. 62, No. 4, 2007, pp. 19-23. [22] R. N. Kalaria, “Cerebral Vessels in Aging and Alz- heimer’s Disease,” Pharmacology & Therapeutics, Vol. 72, No. 3, 1996, pp. 193-214. doi:10.1016/S0163-7258(96)00116-7 [23] G. Rodriguez, P. Vitali, P. Calvini, et al. “Hippocampal Perfusion in Mild Alzheimer’s Disease,” Psychiatry Re- search, Vol. 100, No. 2, 2000, pp. 65-74. [24] R. N. Kalaria, “Small Vessel Disease and Alzheimer’s Dementia: Pathological Considerations,” Cerebrovascu- lar Diseases, Vol. 13, No. 2, 2002, pp. 48-52. doi:10.1159/000049150 [25] I. V. Maksimovich “Changes in Angioarchetectonics of Brain at Alzheimer’s Disease,” The Neurologic Bullet, Vol. XLI, No. 2, 2009, pp. 9-14. [26] G. A. Bateman, C. R. Levi, P. Schofield, Y. Wang and E. C. Lovett, “Quantitative Measurement of Cerebral Haemodynamics in Early Vascular Dementia and Alz- heimer’s Disease,” Journal of Clinical Neuroscience, Vol. 13, No. 5, 2006, pp. 563-568. doi:10.1016/j.jocn.2005.04.017 [27] N. A. Johnson, G. H. Jahng, M. W. Weiner, B. L. Miller, H. C. Chui, W. J. Jagust, M. L. Gorno-Tempini and N. Schuff, “Pattern of Cerebral Hypoperfusion in Alzheimer Disease and Mild Cognitive Impairment Measured with Arterial Spin-Labeling MR Imaging: Initial Experience,” Radiology, Vol. 234, No. 3, 2005, pp. 851-859. doi:10.1148/radiol.2343040197 [28] W. Chen, X. Song, S. Beyea, R. D’Arcy, Y. Zhan and K. Rockwood, “Advances in Perfusion Magnetic Resonance Imaging in Alzheimer’s Disease,” Journal of Alzheimer’s & Dementia, Vol. 7, No. 2, 2011, pp. 185-196. http://www.alzheimersanddementia.com/article/S1552-52 60(10)00105-6/abstract [29] D. R. Theal, W. S. Griffin, R. A. de Vos and E. Ghebre- medhin, “Cerebral Amyloid Angiopathy and Its Rela- tionship to Alzheimer’s Disease,” Acta Neuropathologica, Vol. 115, No. 6, 2008, pp. 599-609. [30] J. Zaghi, B. Goldenson, M. Inayathullah, A. S. Lossinsky, A. Masoumi, et al. “Alzheimer’s Disease Macrophages Shuttle Amyloid-Beta from Neurons to Vessels, Contri- buting to Amyloid Angiopathy,” Acta Neuropathological, Vol. 117, No. 2, 2009, pp. 111-124. doi:10.1007/s00401-008-0481-0 [31] J. C. Morris, “The Clinical Dementia Rati ng (CDR): Cur- rent Version and Scoring Rule,” Neurology, Vol. 43 No. 11, 1993, pp. 2412-2414. [32] I. V. Maksimovich and L. N. Gotman, “Method of Com- plex Radiation Diagnostics at Preclinical and Clinical Stages of Alzheimer’s Disease,” Russian Patent, 2006, No. 2315559. http://v3.espacenet.com/inpadoc?DB=EPO- DOC&locale=en_EP&FT=D&CC=RU&NR=2315559C1 &KC=C1 [33] I. V. Maksimovich, “Radiodiagnostics of Alzheimer’s Disease,” Diagnostics and Intervention Radiology, Vol. 2, No. 4, 2008, pp. 27-38. [34] S. Burgmans, M. P. Van Boxtel, E. F. Vuurman, F. Smeets, E. H. Gronenschild, H. B. Uylings and J. Jolles, “The Prevalence of Corti cal Gray Matter Atrophy may be Overestimated in the Healthy Aging Brain,” Neuropsy- chology, Vol. 23, No. 5, 2009, pp. 541-550. doi:10.1037/a0016161 [35] L. A. van de Pol, F. Verhey, G. B. Frisoni, M. Tsolaki, P. Parapostolou, et al. “White Matter Hyperintensities and Medial Temporal Lobe Atrophy in Clinical Subtypes of Mild Cognitive Impairment: The DESCRIPA Study,” Journal of Neurology, Neurosurgery & Psychiatry, Vol. 80, No. 10, 2009, pp. 1069-1074. doi:10.1136/jnnp.2008.158881 [36] A. Viswanathan, W. A. Rocca and C. Tzourio, “Vascular Risk Factors and Dementia: How to Move Forward?” Neurology, Vol. 27, No. 72, 2009, pp. 368-374.
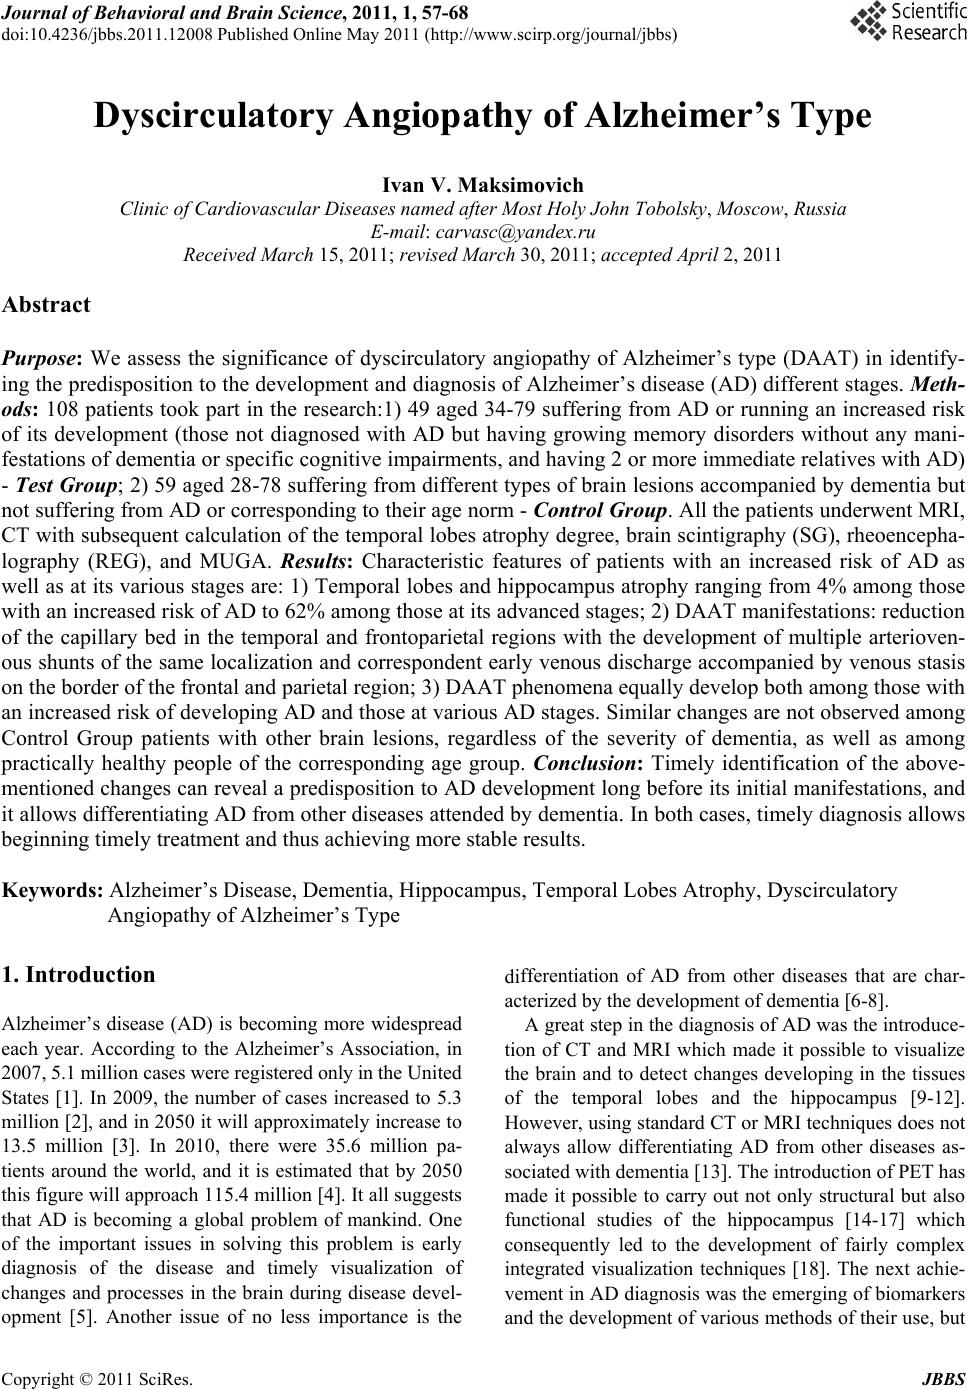
|