R. Y. Nie et al. / Journal of Agr i cu l tural Chemi stry and Environment 3 (2014) 11-15
Copyright © 2014 SciRes. OPEN A CCESS
24 h and then decalcified with 0.4 M HCl. The scale was
washed by deionized water (the conductivity was about 1
- 1.5 µS∙cm−1), then dried and smashed to powder (sieved
by 80 mesh sieve). The mixture of fish scale powder and
deionized water (powder:water, W:W = 1:20) was hy-
drolyzed by pepsin (1.5%, W/W) at pH 1.8, 40˚C for 5 h.
Then 0.75% trypsin (w/w) was added for 5 h hydrolysis
after pepsin was inactiviated and the pH was neutralised
to 8.0. The sample was boiled for 10 min and adjusted to
pH 7.0, and then flavourzyme (0.75%, w/w) was con-
ducted further hydrolysis at 50˚C for 5 h before it was
inactivated. At various time of hydrolysis, an aliquot hy-
drolysate was collected for calcium-binding capacity de-
termination. The mixture and collected aliquot were cen -
trifuged at 3000 × g for 20 min at 4˚C, filtered through
0.45 μm Millipore filters to collect soluble pep tides. The
peptides was freeze-dried and analyzed. The experiment
was triplicated.
2.3. Isolation of Calcium-Binding Peptide by
Sephadex G-15
Demineralized fish scale protein hydrolysate was
loaded into Sephadex G-15 (Pharmacia, NJ, USA) on an
open column (2.6 × 70 cm) at the flow rate of 0.6
mL∙min−1. Fractions corresponding to major peaks were
collected and lyophili zed immediately. All the process of
chromatography was monitored at 280 nm according to
the method of Jung et al. [13].
2.4. Preparation of Peptide-Calcium
Complex
The binding reaction was performed by mixing fish
scale protein hydrolysates at the concentration of 10%
(w/w) with Ca2+ at the concentration of 60 mmo l∙L−1
under continuous stirring for 30 min at 50˚C. Thereafter,
the free calcium was removed with a 100 Da molecular-
weight cut -off semi-permeable membrane (Thermo
Fisher Scientific Inc., Waltham, UK). The retentate was
collected and lyophilized for further analysis.
2.5. Calcium-Binding Activ ity Analysis
Calcium-binding capacity was measured following the
method reported in a previous study [14]. Demineralized
samples with maximum concentration of 1000 mg∙L−1
were mixed with 20 mM sodium phosphate buffer (pH
7.8) and 5 mM CaCl2. Then the mixture was incubated at
22˚C for 30 min with continuous stirring under pH 7.8.
Calcium phosphate precipitate was removed by filtrated
through a 0.45 μm membrane, the calcium content of the
filtrate was assayed by flame atomic absorption spec-
troscopy. The experiment was triplicated and means were
obtained.
2.6. Fourier Transform Infrared (FTIR) and
UV-Visible Spectroscopy
FTIR spectra were obtained using discs containing 0.2
mg of calcium-binding peptide or peptide-calcium com-
plex mixed with 20 mg dried KBr powder. The spectra
were recorded using an infrared spectrophotometer (Ni-
colet 200SXV, Thermo-Nicolet Co., Madison, WI, USA)
from 4000 to 400 cm−1 at a data acquisition rate of 4
cm−1 per point. The peak signals in the spectra were ana-
lysed using Omnic 6.0 software (Thermo-Nicolet Co.,
Madison, WI, USA). The absorption spectra were also
recorded in the 200 - 400 nm region with a Shimadzu
spectrophotometer (Model UV-2550 PC) using distilled
water as a reference.
2.7. X-Ray Diffraction (XRD) Analysis
XRD patterns of calcium-binding peptide and the
complex were obtained using an X-ray diffractometer
(Model D/MAX 2500, Rigaku International Corporation,
Japan) with Cu radiation (λ = 1.54 Å) at 40 kV and 40
mA. Samples were scanned from 2θ = 4˚ - 90˚ at a scan -
ning rate of 4˚/min. The gallery height (d-spacing dis-
tance) was determined by the peak in the XRD pattern
and expressed by Bragg’s equation (λ = 2d·sinθ).
2.8. Microstructure of Calcium-Binding
Peptide and the Complex
The microstructure of calcium-binding peptide and the
complex were performed by a scanning electron micro-
scope (JSM-840, JEOL Tokyo, Japan). The powder sam-
ples were sprayed and sputter-coated with gold (Sputter
coater SPI-Module, PA, USA). The specimens were ob-
served at an acceleration voltage of 25 kV.
2.9. Statistical Analy sis
Experiments were condu cted in triplicate. Comparison
of means was performed by Duncan’s test with confi-
dence level as P ≤ 0.05.
3. RESULTS AND DISCUSSION
3.1. Isolation of Calcium-Binding Peptide
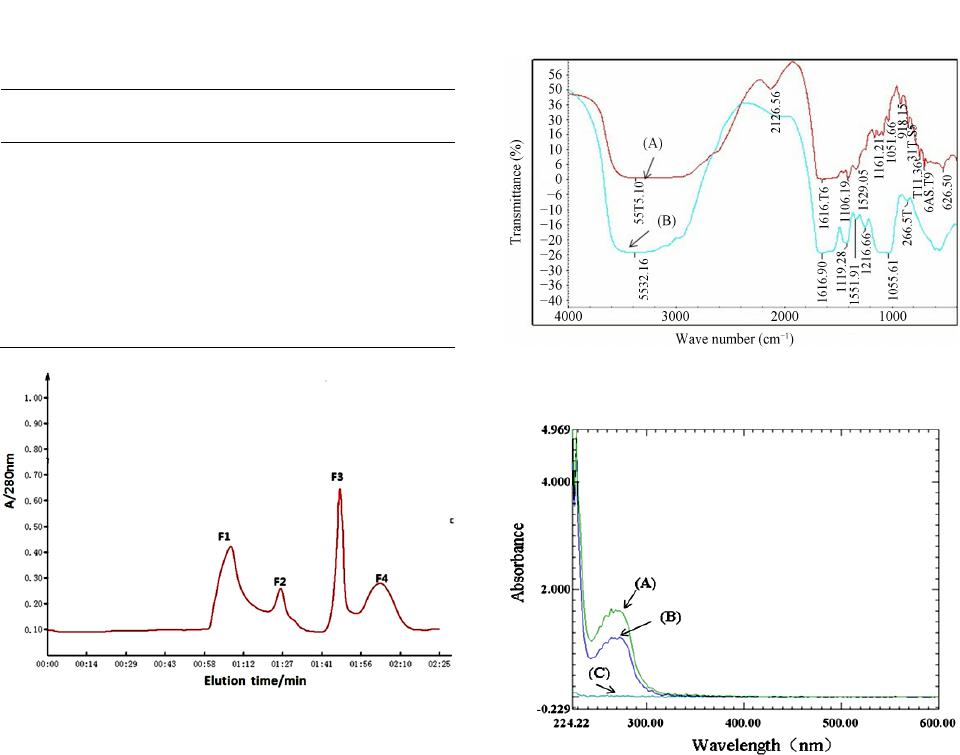
Tilapia scale protein hydrolyzates were separated into
a Sephadex G-15 column and four major fractions (F1,
F2, F3, F4) were eluted at different retention time based
on their molecular weights (Figure 1). Of which, F3
fraction with higher calcium-binding activity of 196.3
mg/g protein was collected for further analysis (Table 1).
3.2. F TIR Analysis
The FTIR spectra of the calcium-binding peptide and