Open Journal of Earthquake Research
Vol.1 No.2(2012), Article ID:24989,9 pages DOI:10.4236/ojer.2012.12002
An Improved Method for Seismic Site Characterization with Emphasis on Liquefaction Phenomena
1Department of Geophysics, Hamedan Branch, Islamic Azad University, Hamedan, Iran
2Young Researcher Club, Department of Geophysics, Hamedan Branch, Islamic Azad University, Hamedan, Iran
3Department of Engineering, Science and Research Branch, Islamic Azad University, Tehran, Iran
Email: a_abbaszadeh@iauh.ac.ir, Rajablou@iauh.ac.ir, Aminghaderi1356@yahoo.com
Received September 5, 2012; revised October 15, 2012; accepted November 6, 2012
Keywords: Nemat Abad Earth Dam; “NLGSS_Shahri”; GUI Computer Code; Earthquake Record
ABSTRACT
Iran is an active seismic region and frequent earthquakes and because of the active faults, often leads to severe casualties caused by structural destruction. Earthquake damage is commonly controlled by three interacting factors, source and path characteristics, local geological and geotechnical conditions and type of the structures. Obviously, all of this would require analysis and presentation of a large amount of geological, seismological and geotechnical data. In this paper, nonlinear geotechnical seismic hazard analysis considering the local site effects was executed and the soil liquefaction potential analysis has been evaluated for the Nemat Abad earth dam in Hamedan province of Iran because of its important socioeconomic interest and its location. Liquefaction susceptibility mapping is carried out using a decisional flow chart for evaluation of earthquake-induced effects, based on available data such as geological, groundwater depth, seismotectonic, sedimentary features, in situ, field and laboratory geotechnical parameters. A series model tests were conducted and then on base of the achieved data the idealized soil profile constructed. A C# GUI computer code “NLGSS_Shahri” was Generate, developed and then employed to evaluate the variation of shear modulus and damping ratio with shear strain amplitude to assess their effects on site response. To verify and validate the methodology, the obtained results of the generated code were compared to several known applicable procedures. It showed that computed output of this code has good and suitable agreement with other known applicable procedures.
1. Introduction
G The interfacing software “NLGSS_Shahri” has developed on base of the geological information, seismic data, earthquake records and geotechnical database. The provided code is capable of reading geotechnical data from database, performing calculations of dynamic parameters for dynamic site response analyses. This version can also prepare input files corresponding to used several software packages in this study. Execute and performing the liquefaction analysis computation of the post liquefaction settlement is the main factor of generated code and in the other word it is the improved version of “Abbas Converter 3.01” that has proposed by Abbaszadeh shahri et al., 2011 [1,2] with added properties to provide efficient logic relation with other applicable software packages for dynamic site response analyses. Such as “Abbas Converter” versions, this code also provides a graphical user interface (GUI) in order to link the constructed databases and lets to user to select type of input data. By click on library and samples, it is possible to access the prepared data. Borehole locations on digital map are the other advantages of this computer GUI code and by this point of view “NLGSS_Shahri” is stronger than can be regarded as moderate scale seismic geotechnical software. This code is able to perform liquefaction and post liquefaction settlement analyses and includes subroutine forms of C#. Connection between geotechnical properties and strong ground motion databases and dynamic analysis is provided in this program. Figures 1 and 2 are showing the start screen of the code and its modular structure.

Figure 1. Start screen of the generated computer code.

Figure 2. Modular Structure of generated code.
2. Liquefaction Phenomena
Serviceability of Earths dams is sometimes compromised during an earthquake because of development of large deformations as a result of inertial load and/or reduction of material shear strength because of popre water rise or collapse of structure. Earthquake induced liquefaction is a major concern for earth dam safety in seismically active regions of the world. Many liquefaction induced embankment failures or near-failures have been reported around the world during various earthquakes. Such embankment damages were particularly destructive when the underlying saturated granular soils liquefied.
A liquefaction susceptibility analysis determines whether a given soil deposit is in a contractive state, i.e., susceptible to undrained strain-softening behavior and flow failure. Numerous investigators have proposed susceptibility boundary lines between penetration resistance and effective confining stress to separate contractive from dilative soil states [3-6]. Similarly, procedures are available to evaluate the liquefied shear strength for use in a post-triggering/flow failure stability analysis. Olson and Stark (2002) proposed a procedure to estimate the liquefied strength ratio using the corrected CPT or the SPT resistance [7]. The liquefied strength ratio can be used in a post-triggering stability analysis. In contrast, few procedures are available to evaluate the triggering of liquefaction in ground subjected to a static shear stress.
The procedure for assessing liquefaction potential typically uses the Cyclic Resistance Ratio (CRR) as a measure of the liquefaction resistance of soils and the Critical Stress Ratio (CSR) as a measure of earthquake load. For cohesionless soils, CRR has been related to normalized SPT blow count, (N), through correlations that depend on the fines content of the soil from field performance observations from past earthquakes [8]. The normalized SPT blow count is given by:
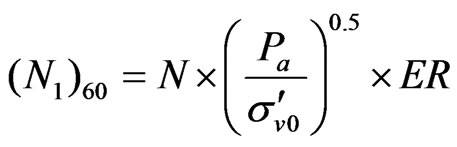
N: raw SPT blow count, : Atmospheric pressure (≈100 Kpa),
 : Effective vertical stress, ER: Energy Ratio.
For a preliminary evaluation or small project, the mean stress could be calculated from the effective overburden stress and coefficient of lateral pressure at rest. The effective mean stress can be calculated by the following equation:
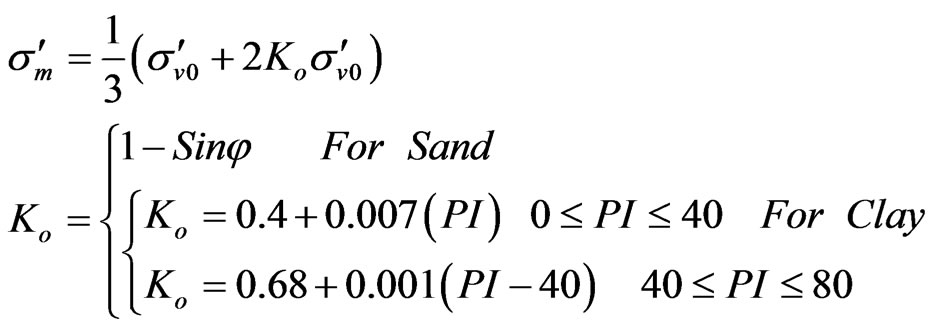
 : Effective mean stress,
 : Coefficient of lateral pressure.
CSR is used to define seismic loading, in terms of the Design Peak Ground Acceleration (DPGA) and Design Earthquake Magnitude (DEM). CSR is defined as:
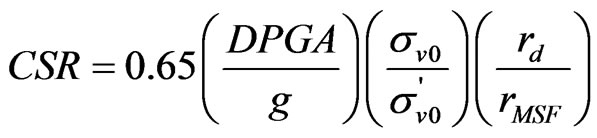
g: gravitational constant, : Total vertical stress,
 : Stress, reduction factor,
 : The magnitude scaling factor.
The procedure for assessing liquefaction potential uses the CSR as the measure for earthquake load, thus:
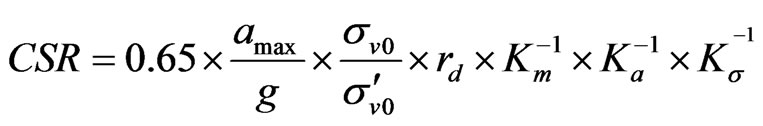
 : PHGA,
 : Correction factors for the earthquake magnitude, the presence of initial static shear and depth of the layer.
The cyclic shear stress on the horizontal plane is used to calculate CSR. The relationship is as followed:

Liquefaction potential can be evaluated by CSR and CRR (normalized resistance stress of the soil material is called Cyclic Resistance Ratio). This comparison can be considered in form of factor of safety against liquefaction as follow:

The liquefaction resistance of the soil (CRR) can be estimated by various laboratory and field methods. The cyclic triaxial shear test and the cyclic simple shear test are common test used to characterize the CRR. The SPT, CPT and shear wave velocity test are the tests that are most frequently used for determining the liquefaction resistance (CRR) of the soil.
Liquefaction of fill in the dam may occur. Liquefaction is the large drop in stiffness and strength of soil due to seismic movements [9]. As a result, part of a dam may slump and slides off the structure. Liquefaction is the most important cause of instability of earth embankments during earthquakes and may cause large deformation, loss of capacities and even complete failures. Liquefaction is initiated when cyclic ground motions causes loose soil particles to attempt to rearrange into a denser configuration. The rapid nature of the loading of the saturated soil results in an undrained condition, and the soil particles cause an increase in excess pore pressures as they try to densify.
3. Testing Program and Methodology
The June 22, 2002 Avaj-Changureh earthquake with mb6.5 occurred in a region of northwestern Iran which is crossed by several major fault lines. The focal depth of the event, according to the USGS report, was approximately 10 km. The epicenter coordinates of the earthquake was estimated at 48.93 longitude and 35.67 latitude. The maximum horizontal and vertical accelerations were recorded at approximately 0.5 g and 0.26 g, respecttively at Avaj station. The fault plane solution indicates that the seismic event was occurred on a reverse fault having trend about N115˚ [10]. Figure 3 shows the recording stations, earthquake epicenter and the studied area.
Nemat Abad dam is a homogenous earth fill dam with a maximum height of 50 m and crest length of 633 m on Shahab River with the aim of providing the required water for agricultural lands of Asadabad plains. This dam is situated at a distance of 45 km from west of Hamedan city and 12 km northwest of Asadabad in 34˚43'45" north latitude and 48˚02'41" east longitude.
A total of 16 boreholes were drilled but the data of 9 of them were available for analysis that presented in Tables 1 and 2. A high accuracy correlation between the drilled boreholes by taking into account of geological conditions, laboratory testing and in situ tests to propose the idealized soil profile of the target area was done by “NLGSS-Shahri” as shown in Figures 4 and 5 and the contour map of the obtained characteristics is presented in Figure 6.
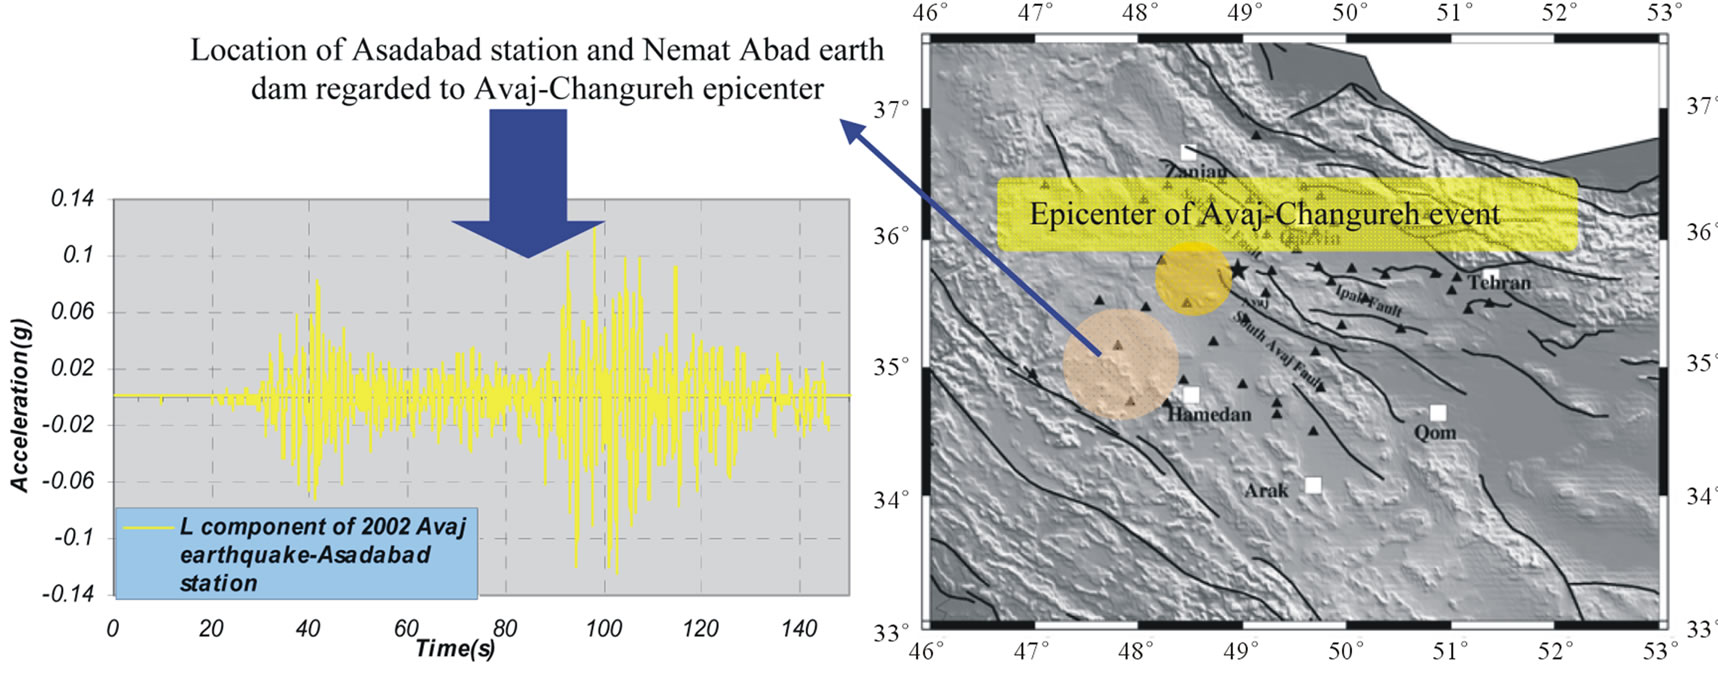
Figure 3. Location of strong ground motion stations and epicenter of 2002 Avaj-Changureh event and studied area.

Table 1. Available average obtained parameters of drilled boreholes in site of Nemat Abad earth dam.
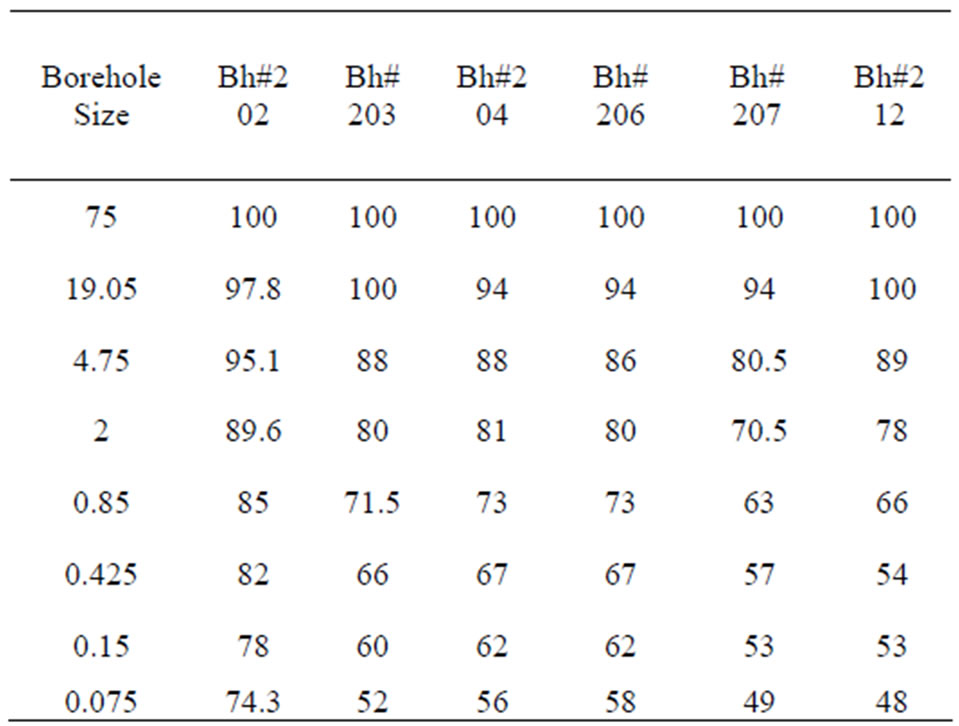
Table 2. Grain size distribution of available picked up data from the boreholes.
In the selected area no attempts were made for developing the regression correlation based on the entire data and N for this study 40 pairs of N value and Vs were applied and a formula which explained Vs as a function of N values from locations where tests were conducted; thus value was determined for the selected area as shown in Table 3. The results of these trials were compared to existing field and laboratory relationships, and appropriate adjustments were made to the model parameters.
The methodology for dynamic site response analysis is based on the nonlinear standard hyperbolic model. The parameters Gmax (maximum shear modulus) and ξ (damping ratio) are used to describe the dynamic behavior of soils in site response analysis. These parameters are calculated with “NLGSS_Shahri” utilizing geotechnical data collected at geotechnical properties database. Gmax can be calculated from empirical relationships for clays [11] and for sands [12,13]. Gmax can be also determined from corrected SPT-N values [14,15]. The variation of the modulus ratio (G/Gmax) and ξ with shear strain (g) is computed from various formulations such as [16]. Modulus ratio and damping ratio values for each layer of the soil profile are calculated for shear strains varying between 0.0001 and 10 percent using the generated computer program. The modulus reduction and damping curves can determined for each characterized material during this process.
By referred to Figure 7, which indicate the flowchart

Figure 4. Boreholes location and layer classification of the area.

Figure 5. Layer correlation of the drilled boreholes in target area to propose the idealized soil profile.

Table 3. Correlation results of Vs - N for the selected region.

Figure 6. Contour map of Vs on base of SPT and depth of sampling in selected area.

Figure 7. Summarized proposed flowchart for this study.
of the study, the experimental estimation of ground motion can be carried out using earthquake data, in areashaving a sufficient seismicity and an adequate cover age of recording stations. In order to evaluate the effect of particular geological conditions on the change of thelocal seismic response of ground motion, geophysical surveys were performed for the lithotypes with a significant extent in the territory. The obtained results of this study by taking into account the fine correction factor (FC) were compared with the previous proposed procedures [17-23]. To analyze the liquefaction potential of the region subjected to Avaj-Changureh earthquake, a comparison between computed motion, stress, strain and response spectra were executed and shown in Figures 8-10. To prove and verification of the applied method in this study, a comprehensive comparison between the liquefaction resistance factors, safety factor, shear modulus reduction curve and damping ratio curves were performed for the idealized soil profile, and the resulting liquefaction potential, for this area was determined and


Figure 8. Overlay of the computed motion and surface response spectra for studied area for various bedrock conditions.

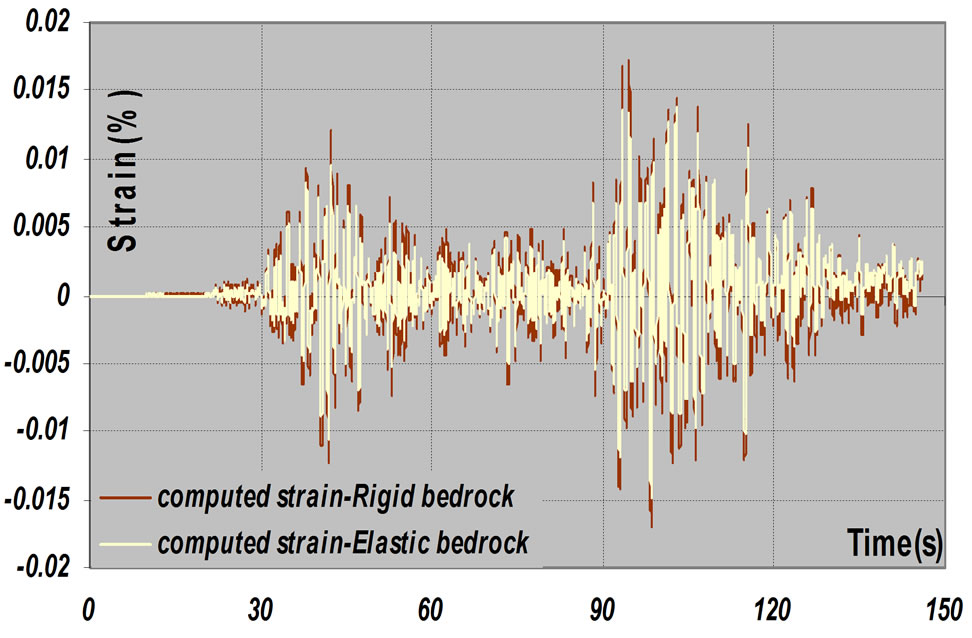
Figure 9. Comparison of the computed stress and strain of the selected area for various bedrock conditions.

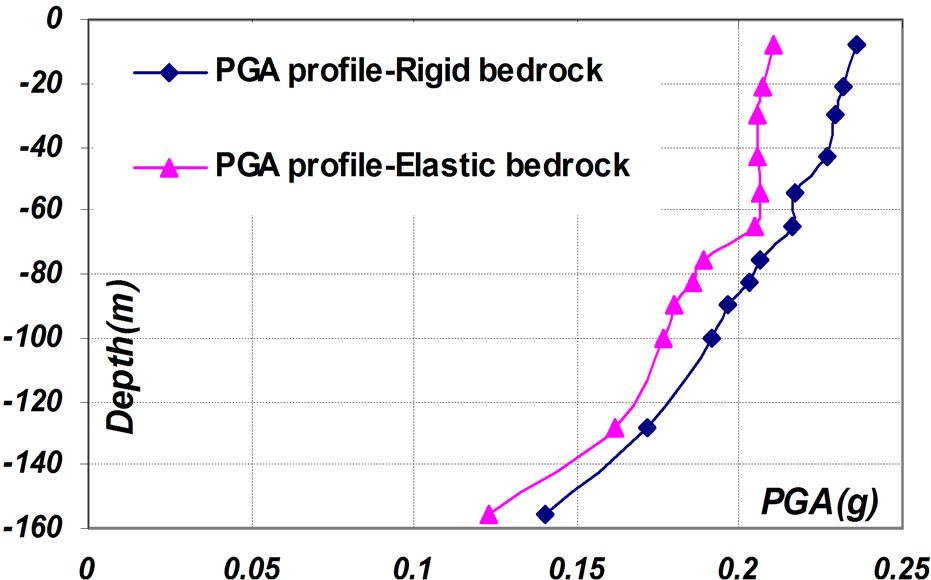
Figure 10. Variation of PGA and strain profile Vs depth in rigid and elastic half space bedrock.
compared with known procedures as indicated in Figure 11 and contour map and 3D view of safety factor are given in Figure 12 respectively. At last by this method the numerical analysis of this study for main parameters which is computed by the generated code was pointed in Tables 4 and 5.
4. Discussion and Conclusions
Most of the early constructed earth dams in Iran werebuilt with no consideration of earthquakes and were not designed for earthquake forces because designers did not consider earthquakes probable threats. As more informa-

Figure 11. Comparison between safety factors of the proposed method by known procedures.
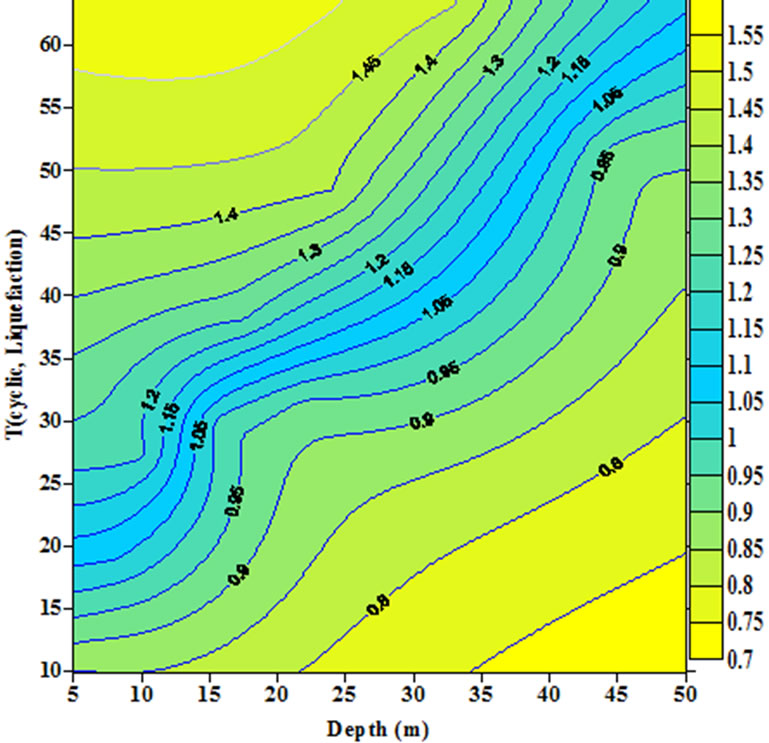

Figure 12. Contour map and 3D view of safety factor for selected area.

Table 4. Numerical results of the study.

Table 5. Computed values by “NLGSS_Shahri”.
tion of earthquakes was collected, the need to built dams that could withstand earthquakes was recognized. Earth embankment dams may be damaged by earthquakes in several ways including dam movement, liquefaction of fill in a dam, water waves caused by an earthquake over topping a dam, and direct damage caused by a dam being located on a fault.
In this study, after calibrating the input parameters, the constructed model was used together with employed several software packages to obtain the response of a layered soil profile. The main target of this phase of the study was to evaluate the “NLGSS_Shahri” capabilities in response of liquefiable soils in order to manipulate large amount of geotechnical data and to prepare a data input file for performing dynamic analyses.
At the present paper, a methodology and processing principles of C# developed GUI “NLGSS_Shahri” is introduced, and its application to the Nemat Abad earth dam in Hamedan province of Iran is presented. The large amount of geological and geotechnical data for soils of the selected area have been loaded to the constructed dynamic soil database. Dynamic site response analyses are performed using proposed method and liquefaction analyses are performed with generated code using results of dynamic analyses. The results of this study indicate that the generated program is a reliable tool for site response analysis and the proposed method can be used for site response analysis as well as the other procedures because comparison of the site response analysis of the proposed profile agreed good reasonable matching by the known applicable procedures. More that in this study, the dependence on local soil instability conditions related to mechanical characteristics of surface soils, such as the slope of soils and the depth of ground water table, was taken into account.
Spectral analysis of the results showed that the stiffness of the soil deposits had a significant effect on the characteristics of the input motions and the overall behavior of the structure. The peak surface acceleration measured by the proposed method was significantly amplified, especially for low amplitude base acceleration. The amplification of the earthquake shaking as well as the frequency of the response spectra decreased with increasing earthquake intensity. The results clearly demonstrate that the layering system has to be considered, and not just the average shear wave velocity, when evaluating the local site effects. Result of presented liquefaction potential in this study subjected to Avaj-Changureh earthquake shows that the layers 1, 4, 6, 11 and 12 are susceptible for liquefaction behavior and also showed that the studied area have moderately liquefaction potential regarding to mentioned event.
REFERENCES
- A. A. Shahri, B. Esfandiyari and H. Hamzeloo, “Evaluation of a Nonlinear Seismic Geotechnical Site Response Analysis Method Subjected to Earthquake Vibrations (Case Study: Kerman Province, Iran),” Arabian Journal of Geosciences, Vol. 4, No. 7-8, 2011, pp. 1103-1116.
- A. A. Shahri, K. Behzadafshar and R. Rajablou, “A Case Study for Testing the Capability of an Intermediate Generated Geotechnical Based Computer Software on Seismic Site Response Analysis,” International Journal of the Physical Sciences, Vol. 6, No. 2, 2011, pp. 280-293.
- M. H. Baziar and R. Dobry, “Residual Strength and Large Deformation Potential of Loose Silty Sands,” Journal of Geotechnical and Geoenvironmental Engineering, Vol. 121, No. 12, 1995, pp. 896-906. doi:10.1061/(ASCE)0733-9410(1995)121:12(896)
- C. E. Fear and P. K. Robertson, ‘‘Estimating the Undrained Strength of Sand: A Theoretical Framework,” Canadian Geotechnical Journal, Vol. 32, No. 4, 1995, pp. 859-870. doi:10.1139/t95-082
- K. Ishihara, “Liquefaction and Flow Failure during Earthquakes,” Geotechnique, Vol. 43, No. 3, 1993, pp. 351- 415. doi:10.1680/geot.1993.43.3.351
- J. A. Sladen and K. J. Hewitt, “Influence of Placement Method on the in Situ Density of Hydraulic Sand Fills,” Canadian Geotechnical Journal, Vol. 26, No. 3, 1989, pp. 453-466. doi:10.1139/t89-058
- S. M. Olson and T. D. Stark, “Liquefied Strength Ratio from Liquefaction Flow Failure Case Histories,” Canadian Geotechnical Journal, Vol. 39, No. 3, 2002, pp. 629- 647. doi:10.1139/t02-001
- T. L. Youd, I. M. Idriss, R. D. Andrus, I. Arango, G. Castro, J. T. Christian, R. Dorby, W. D. L. Finn, L. F. Harder, M. E. Hynes, K. Ishihara, J. P. Koester, S. C. Laio, W. F. Marcuson, G. R. Martin, J. K. Mitchell, Y. Moriwaki, M. S. Power, P. K. Robertson, R. B. Seed and K. H. Stokoe, “Liquefaction Resistance of Soils: Summery Report from the 1996 NCEER and 1998 NCEER/NSF Workshop on Evaluation of Liquefaction Resistance of Soils,” Journal of Geotechnical and Geoenvironmental Engineering, Vol. 127, No. 10, 2001, pp. 817-833. doi:10.1061/(ASCE)1090-0241(2001)127:10(817)
- M. P. Byrne and M. SeidKarbasi, “Seismic Stability of Impoundments,” 17th Annual Symposium, Vancouver Geotechnical Society, 2003.
- http://www.usgs.gov
- B. O. Hardin and V. P. Drnevich, “Shear Modulus and Damping in Soil: Design Equations and Curves,” Journal of the Soil Mechanics and Foundations Division, Vol. 98, No. 7, 1972, pp. 667-692.
- H. B. Seed and I. M. Idriss, “Soil Moduli and Damping Factors for Dynamic Response Analyses,” Report EERC 70-10, Earthquake Engineering Research Center, University of California, Berkeley, 1970.
- H. B. Seed and I. M. Idriss, “Simplified Procedure for Evaluating Soil Liquefaction Potential,” Journal of the Soil Mechanics and Foundations Division, Vol. 97, No. SM9, 1971, pp. 1249-1273.
- T. Imai and K. Tonachi, “Correlation of N-Value with S-Wave Velocity and Shear Modulus,” Proceedings of 2nd European Symposium on Penetration Testing, Amsterdam, 1982, pp. 57-72.
- Y. Ohta and N. Goto, “Estimation of S-Wave Velocity in Terms of Characteristic İndices of Soil,” Butsuri-Tanko, Vol. 29, No. 4, 1976, pp. 34-41.
- Y. Ohta and N. Goto, “Estimation of S-Wave Velocity in Terms of Characteristic İndices of Soil,” Butsuri-Tanko, Vol. 29, No. 4, 1976, pp. 34-41.
- T. F. Blake, “Formula (4),” In: T. L. Youd and I. M. Idriss, Eds., Summary Report of Proceedings of the NCEER Workshop on Evaluation of Liquefaction Resistance of Soils, Technical Report NCEER 97-0022, 1996.
- R. Golesorkhi, “Factors Influencing the Computational Determination of Earthquake-Induced Shear Stresses in Sandy Soils,” PhD Dissertation, University of California at Berkeley, Berkeley, 1989.
- I. M. Idriss, “Evaluation of Liquefaction Potential and Consequences: Historical Perspective and Updated Procedures,” Presentation Notes, 3rd Short Course on Evaluation and Mitigation of Earthquake Induced Liquefaction Hazards, March 13-14, San Francisco, 1997, p. 16.
- S. S. C. Liao and R. V. Whitman, “Catalogue of Liquefaction and Non-Liquefaction Occurrences during Earthquakes,” Department of Civil Engineering, Massachusetts Institute of Technology, Cambridge, Mass, 1986.
- S. S. C. Liao, D. Veneziano and R. V. Whitman, “Regression Models for Evaluating Liquefaction Probability,” Journal of Geotechnical and Geoenvironmental Engineering, Vol. 114, No. 4, 1988, pp. 389-411. doi:10.1061/(ASCE)0733-9410(1988)114:4(389)
- H. B. Seed and I. M. Idriss, “Ground Motions and Soil Liquefaction during Earthquakes,” Monograph Series, Earthquake Engineering Research Institute, Oakland, 1982, p. 134.
- T. D. Strak and S. M. Olsen, “Liquefaction Resistance Using CPT and Field Case Histories,” Journal of Engineering Geology, Vol. 121, No. 12, 1995, pp. 856-869. doi:10.1061/(ASCE)0733-9410(1995)121:12(856)