Eye Blink Responses to the Four Basic Taste Stimuli in Healthy Young Humans ()
1. Introduction
The four basic taste qualities of sweet, salty, sour, and bitter are widely accepted as the traditional forms of gustatory perception [1,2]. This has been demonstrated by electrophysiological studies of the peripheral and central nervous systems of various mammalian species [3,4]. Psychophysical experiments have shown that the perceived intensity of gustation follows Stevens’ power law [5] and is determined by stimulus concentration.
In addition to gustatory perception, taste stimuli applied to the human oral cavity can elicit reflex responses, including jaw and tongue movements and salivation [1,2, 6]. Taste stimuli can also elicit reflex responses of facial muscles [7,8], and the four taste stimuli elicit different patterns of facial muscle response [9]. Over the past three decades, researchers have extended the findings of the pioneering neurohistological studies [7,8] and proposed neural pathways for these gustofacial responses [9].
Gustofacial responses are more pronounced in normal and hydrocephalic neonates than in normal adult participants [8-10]. Animal studies have revealed different hedonic responses to taste stimuli in rats, apes, and other mammalian species [11,12]. Various facial responses are observed in response to taste stimuli in newborn infants; for example, retraction of the corners of the mouth and “smiling” secondary to sweet solutions, or lip pursing and blinking secondary to sour solutions [10]. However, there are few quantitative indices of the taste response that can be used in facilities such as nursing homes and hospital wards. The eye blink is one such index of emotional responses that is used in the psychophysiological field (e.g., [13]). The aim of the present study was to assess the eye blink responses elicited by taste stimuli in normal adults.
2. Materials and Methods
2.1. Participants
Six healthy young adults (three men and three women) aged 19 to 21 years participated in the experiment. No participants reported any problems with gustation, swallowing, or facial expression. Informed consent was obtained from all participants. The Ethics Committee of the Niigata University of Health and Welfare approved the experiments.
2.2. Test Solutions
Solutions designed to stimulate the four basic taste quailties (sweetness, saltiness, sourness, and bitterness) were used as stimuli. The reagents used for these four taste solutions were sucrose, sodium chloride, citric acid, and quinine hydrochloride, respectively (Table 1). The four reagents were dissolved in distilled water (DW) and stored at room temperature (approximately 23˚C). For each taste quality, solutions of low and high concentrations were prepared. The low concentration solution was set at twice the recognition threshold and the high concentration solution was set at the sensory upper limit of avoidance (Table 1). These two concentrations were validated during preliminary experiments with the same participants. DW was used as a control.
2.3. Recording Systems
A video camera (VDR-M70K, Panasonic Inc., Tokyo, Japan) was used to record facial expression during the experiments. The camera was placed 1.5 m in front of the participant to record the entire face. The height of the tripod was adjusted to ensure that the camera was focused on the center of the face (i.e., the top of the nose). The recorded images were captured and sent to a personal computer (Precision T5400, Dell Japan Inc., Tokyo, Japan) where they were encoded as AVI format files (704 × 480 pixel; 29.97 frames/s) for further analysis. A light-emitting diode was placed on the back of the participant. The light-emitting diode signal was recorded as an electrical rectangular pulse on the PowerLab system (ADInstruments Pty Ltd., PowerLab/8sp, Bella Vista, Australia) to enable the video images to be synchronized with the delivery of taste stimuli.
A piezoelectric sensor (PES) film (16 × 41 × 0.04 mm; DT1-028K, Tokyo Sensor Co., Ltd., Tokyo, Japan) was attached to the end-piece of a plastic syringe (2.0 mL volume). The PES was directly connected to the PowerLab system. When the experimenter pushed the plastic syringe to infuse the taste solution, the PES film was simultaneously deformed, and the pressure change associated with this deformation was recorded by the PowerLab system. The PES signal indicated the precise time of taste stimulus delivery.

Table 1. Concentrations of the four taste solutions used.
aLow concentration was set at twice the recognition threshold; bHigh concentration was set at the sensory upper limit of avoidance.
2.4. Procedures
The experiments were performed in a laboratory that had a constant room temperature of approximately 23˚C. The participant was instructed to sit comfortably by reclining on the backrest of a chair and gaze at the lens of the video camera. A flow procedure was used to apply taste stimuli to the tongue surface [14]. The participant was asked to hold a silicone tube (1.5 m length and 3 mm inner diameter) that was filled with one of the eight taste solutions or DW. One end of the tube was connected to the plastic needleless syringe, and the other end was placed on the tip of the tongue. Following an announcement of stimulus delivery, the experimenter commenced the PESand video-recording, and then pushed the plastic syringe to deliver ~1 mL of taste solution to the tip of the tongue. The recording continued until 5 s after stimulus delivery. One experimental session involved 12 stimulus deliveries (each of the eight taste solutions and four DW) in a random order. After each stimulus, the participant rinsed their mouth with deionized water, and there was an interval of 3 min before the next stimulus. For each participant, two identical experimental sessions were carried out on two different days.
2.5. Data Analysis
Eye blinks were identified from the video recordings by visual inspection. The following parameters were quantified:
• Number of eye blinks: The number of eye closings that occurred in the 5 s after stimulus delivery.
• Latency of the first eye blink: The time from stimulus delivery to the beginning of the first eye closing.
• Duration of the first eye blink: The time from the beginning to the end (i.e., full opening of the eye) of the first eye closing.
For each taste solution and DW, the number of eye blinks, and the latency and duration of the first eye blink, were averaged over the two sessions for each participant. The number of eye blinks was assumed to be a non-parametric variable and was compared across taste solutions (nine levels) using the Kruskal-Wallis test followed by the Steel-Dwass multiple-comparison test. The latency and duration of the first eye blink were assumed to be parametric variables and were compared across taste solutions (nine levels) using one-way analysis of variance, followed by Tukey’s multiple-comparison test. P-values of less than 0.05 were considered significant.
3. Results
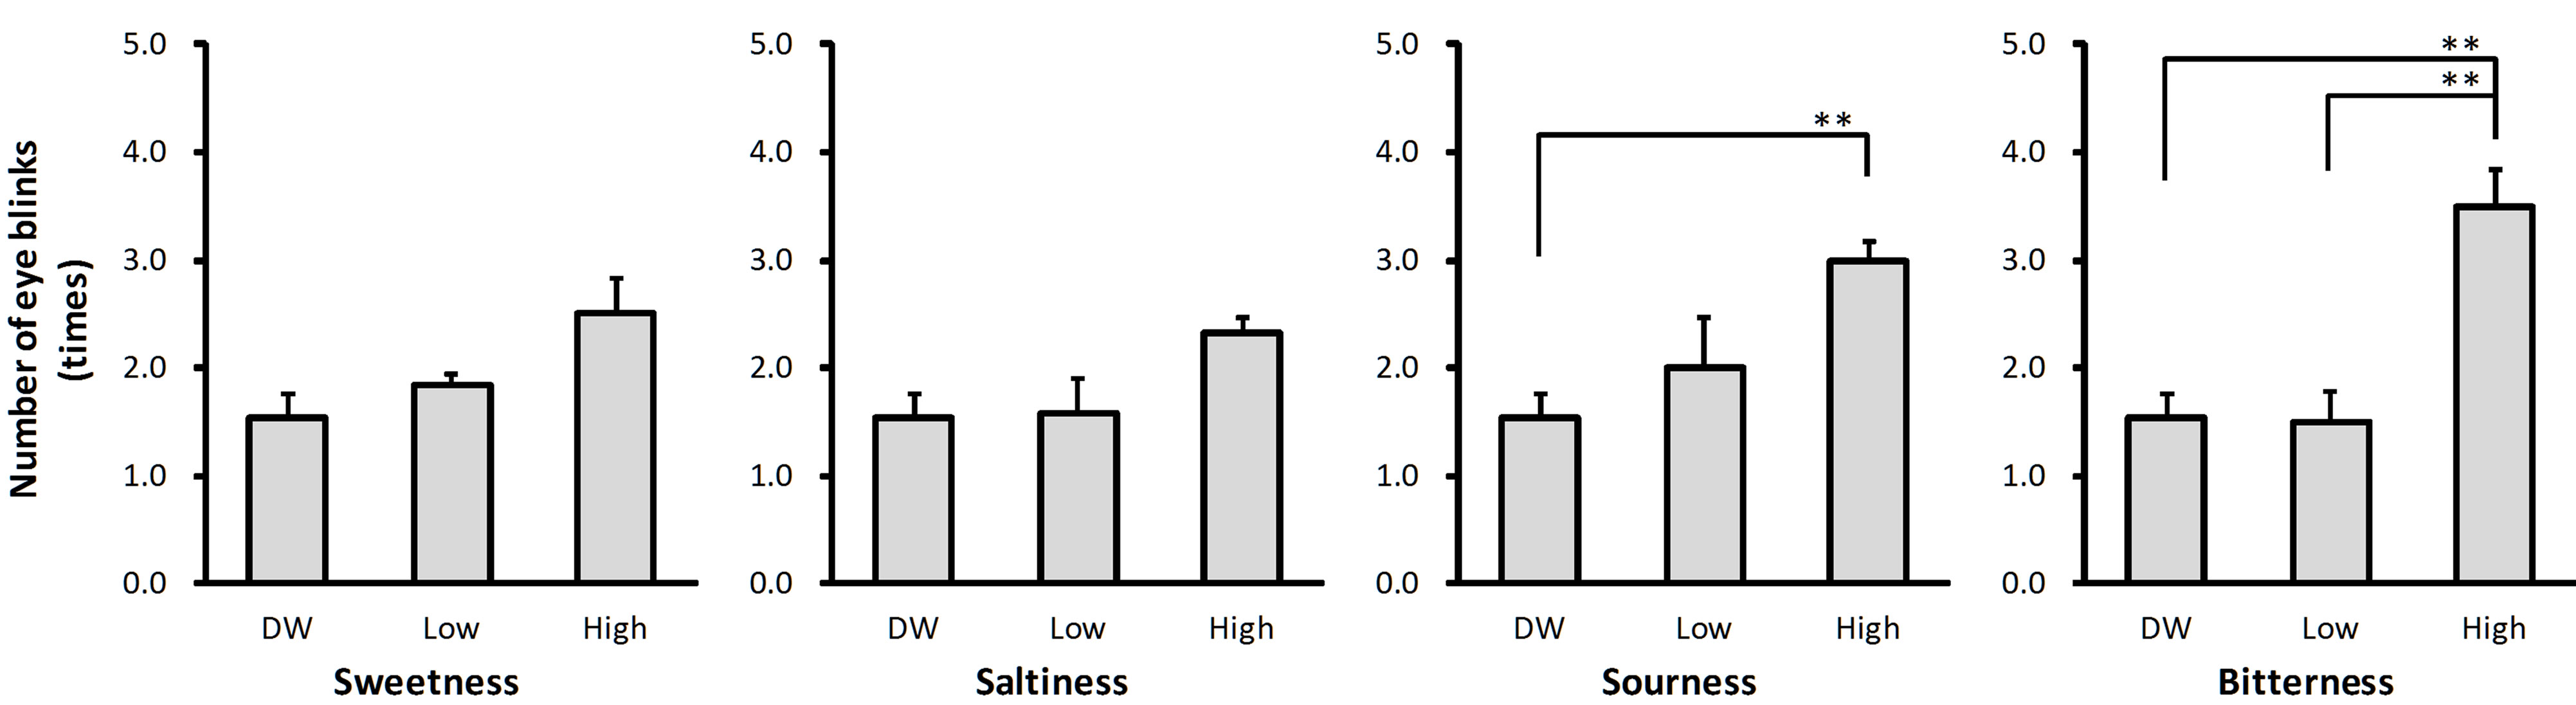
The number of eye blinks evoked by the low concentration taste solutions ranged from 103% (salty, Figure 1(b)) to 130% (sour, Figure 1(c)) of the number of eye blinks evoked by DW. The number of eye blinks evoked by the high concentration taste solutions ranged from 151% (salty, Figure 1(b)) to 227% (bitter, Figure 1(d)) of the number of eye blinks evoked by DW. Solution intensity affected the number of eye blinks for sour (P < 0.01) and bitter (P < 0.01) taste qualities (Figure 1). Post-hoc tests revealed that there were more eye blinks after stimulation with high concentration solution than after stimulation with DW for both taste qualities (P < 0.01 for sour and P < 0.01 for bitter), and more eye blinks after stimulation with low concentration solution than after stimulation with DW for bitter taste quality (P < 0.01; Figures 1(c) and (d)).
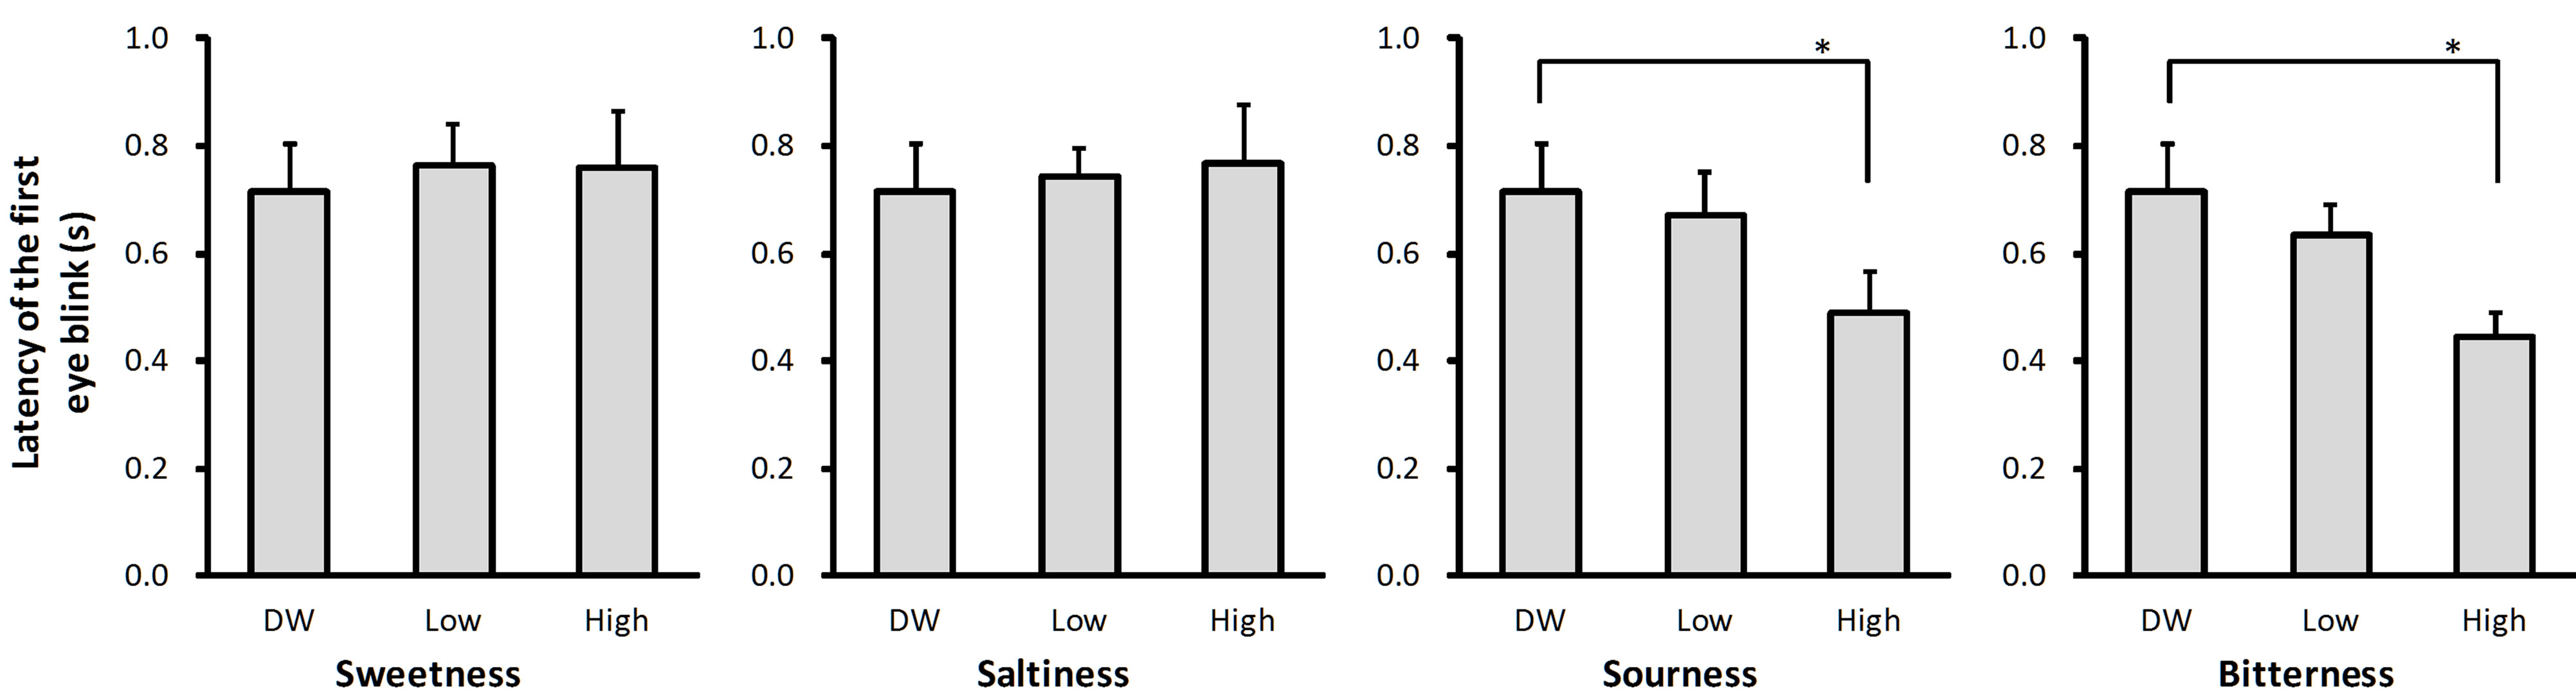
The latency of the first eye blink evoked by the taste solutions ranged from 62% (bitter, Figure 2(d)) to 108% (salty, Figure 2(b)) of the latency of the first eye blink evoked by DW. There was a main effect of solution intensity on eye blink latency for sour (P < 0.05) and bitter (P < 0.05) taste qualities (Figure 2). Post-hoc tests revealed that the latency was shorter after stimulation with high concentration solution than after stimulation with DW for both taste qualities (P < 0.05 for sour and P < 0.05 for bitter; Figures 2(c) and (d)).
The duration of the first eye blink evoked by the low concentration taste solutions ranged from 122% (sweet, Figure 3(a)) to 150% (bitter, Figure 3(d)) of the duration of the first eye blink evoked by DW. The duration of the first eye blink evoked by the high concentration taste solutions ranged from 140% (sweet, Figure 3(a)) to 188% (sour, Figure 3(c)) of the duration of the first eye blink evoked by DW. There was a main effect of solution intensity on eye blink duration for all four taste qualities (P < 0.05; Figure 3). Post-hoc tests revealed that the eye blink duration was longer after stimulation with high concentration solution than after stimulation with DW for sweet (P < 0.05; Figure 3(a)), salty (P < 0.05; Figure 3(b)), sour (P < 0.01; Figure 3(c)), and bitter (P < 0.01; Figure 3(d)) taste qualities, and longer after stimulation with high concentration solution than after stimulation with low concentration solution for bitter taste quality (P < 0.05; Figure 3(d)).
 (a) (b) (c) (d)
Figure 1. Number of eye blinks evoked by the taste solutions. The average number of eye blinks observed after stimulation with distilled water (DW) and low and high concentrations of sweet (sucrose: (a)), salty (sodium chloride: (b)), sour (citric acid: (c)), and bitter (quinine hydrochloride: (d)) taste solutions. Error bars represent standard error. Asterisks (**) indicate P < 0.01 between conditions indicated by horizontal lines.
 (a) (b) (c) (d)
Figure 2. Latency of the first eye blink evoked by the taste solutions. The average latency of the first eye blink observed after stimulation with distilled water (DW) and low and high concentrations of sweet (sucrose: (a)), salty (sodium chloride: (b)), sour (citric acid: (c)), and bitter (quinine hydrochloride: (d)) taste solutions. Error bars represent standard error. Asterisks (*) indicate P < 0.05 between conditions indicated by horizontal lines.
 (a) (b) (c) (d)
Figure 3. Average duration of the first eye blink evoked by the taste solutions. The average duration of the first eye blink observed after stimulation with distilled water (DW) and low and high concentrations of sweet (sucrose: (a)), salty (sodium chloride: (b)), sour (citric acid: (c)), and bitter (quinine hydrochloride: (d)) taste solutions. Error bars represent standard error. Single asterisks (*) indicate P < 0.05 and double asterisks (**) indicate P < 0.01 between conditions indicated by horizontal lines.
4. Discussion
It is necessary to begin by discussing two methodological considerations: stimulation and recording. The representative taste cognition thresholds in normal human adults are 20 mM for sucrose, 20 mM for sodium chloride, 0.2 mM for citric acid, and 0.008 mM for quinine hydrochloride [15]. The lowest stimulus concentrations used in the present study were twice the minimum cognition threshold of the study participants and were only about one tenth of the previously reported cognition thresholds. Cognition thresholds vary according to the size of the area stimulated, and the higher thresholds in the present participants may be due to the volume of taste solution given [16]. Thus, the taste solutions used in the present study were suprathreshold and effective stimuli. The present study used three eye blink parameters (the number of eye blinks, and the latency and duration of the first eye blink), which were measured based on video recordings. Previous studies [17,18] have used electromyographic recordings of the muscles around the eyes (e.g., the orbiularis oculi muscle). Electromyographic recordings may provide more precise temporal information on the relationship between muscle activity and eyelid movements, but do not guarantee whether eye blinks actually occurred or not. We aimed to measure the actual movement of the eyelid evoked by taste stimuli; therefore, we used video recordings, rather than electromyography, in this study.
The major point of discussion is how to interpret the responses observed in this study. The effective stimuli were sour (citric acid) and bitter (quinine), not sweet (sucrose) or salty (sodium chloride), taste solutions. There are at least two types of responses that could underlie the present results: gustofacial responses and noxious responses. The concentrations of taste stimuli applied are important cues for differentiation between these two responses. The present study used a 62.5 mM citric acid solution as the high concentration sour taste solution, and the stimulus elicited an increase in the number of eye blinks, and a decrease in the latency and an increase in the duration of the first eye blink. A previous study [8] reported that a sour taste stimulus, a 120 mM citric acid solution, evoked eye blinks in anencephalic and hydroanencephalic neonates as well as normal. The different study populations may underlie the differences between the present and previous studies, but in the present study we obtained three significant findings using a sour taste stimulus that was of a much lower concentration than that used in the previous study (62.5 mM vs. 120 mM citric acid). This strongly suggests that the observed eyelid responses were gustofacial rather than noxious responses.
In general, the latencies of reflex responses are short and uniform. The relatively long and variable latency of the first eye blink observed after taste stimulation in the present study may have been due to the method used to measure latency. We measured the total time from the onset of stimulation to the start of response, and the measured latency therefore included the time required for the mechanical components of stimulus delivery and the time for the physiological components of response. Alternatively, the long latency may be due to the neural pathways involved in the eye blink. Histological and electrophysiological studies have shown that, in mammals, neurons in the rostral part of the nucleus of the solitary tract receive sensory signals from taste receptors in the mouth and pharynx [8-10]. Microinjection of tracers to the rostral part of the nucleus of the solitary tract in rats shows that these neurons project to the facial motor nucleus and its vicinity [7]. These studies suggest that there is a neural connection between the rostral part of the nucleus of the solitary tract and the facial motor nucleus, and provide a potential neural pathway for the gustofacial reflex. These long and polysynaptic responses require a relatively long response time.
In the present study, the high concentration sour and bitter taste solutions induced an increase in blink latency, indicating taste aversion. According to a review of conditioned taste aversion in rats, the amygdala plays a principal role in taste aversion and its learning, and the amygdala also participates in the eye blink movement in rabbits [19] and rats [20]. One clinical electrophysiological study showed that electrical stimulation of the amygdala elicited activation of facial motor neuron in normal human participants [21]. The long latency observed in the present study could be explained if the high concentration solutions induced the emotion of fear in the participants and initiated eye blink responses from the amygdala.
In conclusion, eye blink responses were recorded on video to examine the effects of taste stimuli on facial expressions in normal human adults. The four basic taste solutions in high and low concentrations and DW were given to six participants. In comparison to DW, the stimuli of sour and bitter solutions in high concentrations increased the number of eye blinks, and shortened the latency and prolonged the duration of the first eye blink, but the taste stimuli evoked little changes in facial expression.
5. Acknowledgements
This study was supported in part by Grants-in-Aid for Scientific Research from the Ministry of Education, Science, and Culture of Japan (grant nos 2050072 and 24501001 to I.A.). The authors are grateful to Mr. H. Iwamori and Mr. S. Kawakami (Department of Health and Nutrition, Niigata University of Health and Welfare) for their valuable assistance in the preparation of the manuscript.