Impacts of Gold Mining on Rice Production in the Anum Valley of Ghana ()
1. Introduction
Located in the Ashanti region of Ghana is the Anum Valley Irrigation Project (AVIP) which was established in 1992 for the production of paddy rice. The AVIP paddy fields are divided into two areas; Area A which is situated at Nobewam is drained by two rivers (River Anum and River Owerri) whereas Area B, which is located at Odumase, is drained solely by River Owerri. The AVIP paddy fields are located close to the former Konongo Gold Mine, now known as the Owerri Gold Mines. It is worth noting that the Odumase paddy fields are in closer proximity to the gold mining site than the Nobewam fields (Figure 1). Evidence from earlier research showed that the gold mining activities at Konongo resulted in an elevation of the arsenic concentration in River Owerri. Arsenic concentrations much higher than the 10 µg/l permissible limit set by WHO for drinking water [1] have been recorded in water samples collected from River Owerri [2] . Analysis of water samples collected from irrigation channels at Nobewam and Odumase indicated that both sites are drained by arsenic-enriched water. The mean arsenic content of irrigation water from the Odumase paddy fields (144 ± 1.8 µg/l) was, however, found to be higher than that in water from the Nobewam paddy fields (27 ± 4.3 µg/l) [3] .
The contribution of gold mining to arsenic enrichment of environmental media is well documented in the literature. Field studies conducted in other gold mining areas in Ghana have reported adverse impacts on soil and water quality [4] -[9] . Soil and water samples collected from 11 gold mining sites in the Migori Gold Belt of Kenya were found to contain unacceptable levels of arsenic, mercury and lead [10] . Soluble arsenic concentrations in the headwaters of Gegogan Brook in Goldenville (a famous gold mining area in Nova Scotia, Canada) ranged from 30 - 50 µg/l [11] . High levels of arsenic (up to 48 mg/l) have also been reported in groundwater in numerous areas of the USA due to mining activities [12] . Although the impacts of mining pollution on horticultural produce and other food staples such as wheat and rice have been fairly well studied [13] -[16] , there is still a paucity of information within the Ghanaian context.

Figure 1. A map of southern Ghana showing the study areas with reference to rivers and regional capitals.
Much of the literature on the health risk implications of high levels of arsenic in rice have emanated from dietary studies conducted in Bangladesh [17] [18] and West Bengal [19] to assess the scope of impacts posed by the naturally high occurrence of arsenic in groundwater in the deltaic plain of the Ganges-Meghna-Brahmaputra rivers [20] -[23] . Reference [24] reported high levels of arsenic in Bangladesh-grown rice, vegetables, pulses and spices, but argued that vegetables contribute less to dietary arsenic exposure due to the relatively lower consumption rates, compared to rice. The average rice consumption rate for the Bangladesh population above age 5 has been quoted as 400 - 650 g dry rice/day [25] . Although rice consumption in Ghana is much lower than in Bangladesh, per capita rice consumption by the average Ghanaian consumer has almost doubled from 55 g dry rice/day in 1996 to 100 g dry rice/day [26] . The increasing dependence of the world’s population on rice, coupled with the unique susceptibility of paddy rice to arsenic toxicity, explains the current focus on rice in the research on dietary arsenic exposure [27] .
Under reducing conditions such as pertains in flooded paddy soils, the effects of arsenic build-up (whether due to naturally-contaminated groundwater or mining pollution) can be further intensified by the toxic effects of ferrous iron (Fe II) on the rice plant. Paddy rice and other plants adapted to flooded soils tend to counteract these effects by pumping oxygen from the shoots through aerenchyma to the roots, thus maintaining high redox potentials in the rhizosphere [28] -[31] . This phenomenon of rhizosphere oxidation causes the formation of a coating of manganese (Mn) and Fe oxy-hydroxides (also called root plaque) on the roots of aquatic plant species, which is essential for reducing the phytotoxic concentrations of organic solutes as well as Fe (II) and Mn (II) ions present in the soil solution [28] [29] .
Although Fe and Mn usually co-exist in root plaques of aquatic plants, Fe tends to be the main element because the oxides and hydroxides of Fe precipitate at a lower redox potential than those of Mn [32] . It has been shown that the formation of Fe plaque on roots of aquatic plants results in effective adsorption and detoxification of arsenic and zinc (Zn) in the rhizosphere [33] . It appears, therefore, that elevation of arsenic concentrations in paddy soils induces iron plaque formation on rice roots, which results in a lowering of the Zn concentration in the rhizosphere due to adsorption of Zn to form franklinite (ZnFe2O4), which is sparingly soluble [28] . Thus, arsenic contamination from gold mining activities could also increase the risk of deficiency of mineral nutrients in rice plants. It is this potential effect of soil arsenic and soil iron interactions on nutrient availability to the rice plant that informed the decision to analyse both soil arsenic and soil iron concentrations in this study.
2. Materials and Methods
2.1. The Study Area
The Anum Valley lies between latitudes 6˚15' and 6˚39' North, and between longitudes 1˚15' and 1˚19' West. The total land area developed for farming in the valley is 140 ha (40 ha at Nobewam and 100 ha at Odumase). Out of the 140 ha of land developed, 40 ha (i.e. 5 ha at Nobewam plus 35 ha at Odumase) are not irrigable due to the stony/gravelly nature of the topsoil. On the remaining 100 ha of irrigable land, the paddy fields have been developed into basins of 0.1 ha (50 m × 20 m). The most popular rice variety cultivated in the valley is Jasmine 85 (an aromatic rice variety). At Odumase, the main source of water for rice cultivation was River Owerri, and at Nobewam it was a mixture of water from River Owerri and River Anum (see Figure 1). At the time of this study, the irrigation systems at both Nobewam and Odumase had broken down and, hence, there was no mechanical control over the flow of water from the rivers through the irrigation channels.
The AVIP paddy fields at Nobewam and Odumase were selected for the current study because in an earlier study which explored variations in the concentrations of arsenic in soils from twenty paddy field sites across southern Ghana [3] , only samples from these sites recorded arsenic concentrations far exceeding 10 mg/kg, which is the generally accepted level for arsenic in non-contaminated soils. Since the number of samples collected from Odumase for the earlier study was rather small (n = 3), it was important to conduct a wider survey to establish the extent of arsenic contamination in the Anum Valley. This paper, therefore, reports on the concentrations of arsenic in 50 paddy soil samples collected from the Nobewam (n = 25) and Odumase (n = 25) paddy fields, both located in the Anum Valley; and compares the arsenic content of Jasmine 85 rice grains harvested from these fields to that of the same rice variety harvested from three control sites in other parts of Ghana. One control site was located at Abenase in the Eastern Region of Ghana, and the other two were at Simpa and Yirase in the Western Region (see Figure 1). These three control sites were selected because, like the Anum Valley paddy fields at Nobewam and Odumase, they were also lowland paddy fields with Jasmine 85 as the main rice variety under cultivation. Besides, in the earlier study of arsenic concentrations in paddy soils from southern Ghana, the arsenic content of samples from these sites were far below the values recorded for samples from the Anum Valley [3] .
2.2. Sampling Procedure
A combination of the convenience and systematic sampling methods were used in this study. The selection of basins to be sampled was based on convenience in that only basins which were under cultivation at the time of the study were selected. In order to assess the extent of arsenic transfer from soil to grain, the selection of sampling location was also partly influenced by availability of mature grains of Jasmine 85. Once a basin had been selected, a starting point for sampling was chosen and subsequent samples were then systematically taken from the starting point at 25 m and 10 m intervals, respectively, along the length and breadth of the basin. Soil samples were collected with a 5 cm diameter auger at a depth of 10 cm and stored in appropriately labelled plastic bags. The soil samples were not bulked because the heterogeneity in soil composition was of interest in this study. Samples of mature grains of Jasmine 85 were collected from each sampled basin and placed in appropriately labelled brown envelopes.
2.3. Preparation and Analysis of Samples
The soil samples were air-dried for 48 hours, during which period care was taken to disaggregate the samples by hand from time to time to avoid them hardening up into huge lumps. The samples were ground in a porcelain mortar and sieved through a 2 mm-sized mesh. Subsequently, 0.1 g of each soil sample was weighed into a quartz glass tube for block digestion.
Digestion was done in two batches of 25 samples each, and to each batch was added a blank, a spike and a certified soil reference material (NCS ZC 73007) for the purposes of quality control. The weighed-out samples were pre-digested overnight in 2.5 ml of nitric acid (HNO3) to which 2.5 ml of hydrogen peroxide (H2O2) were added immediately before digestion. The temperature for block digestion was raised at hourly intervals from 100˚C to 120˚C to 140˚C and was kept at the latter temperature until the samples were clear. Upon cooling, the sample digests were decanted into 15-ml centrifuge tubes and made up to the 10-ml mark with ultrapure deionised water (Milli Q, 18.2 MΩ). For arsenic analysis by inductively coupled plasma mass spectrometry (ICPMS), 1 ml of each 1:10 diluted digest was pipetted into a 15-ml centrifuge tube and further diluted to the 10 ml mark with ultrapure de-ionised water. For iron analysis by Atomic Absorption Spectrometry (AAS), 1 ml of each 1:100 diluted sample was further diluted with deionised water to the 10 ml mark in a 15 ml centrifuge tube.
The rice grain samples collected in this study were processed for analysis exactly as described in earlier studies by the same team of researchers [26] [34] . In all, a total of 16 grain samples were analysed for total arsenic content and percentage inorganic arsenic content—4 samples from Nobewam and 3 samples each from Odumase, Abenase, Yirase and Simpa.
2.4. Statistics
The two-sample t-test was used in comparing data for Nobewam versus Odumase, and regression analysis was used to test the significance of the relation between soil arsenic and soil iron concentrations. One-way analysis of variance (ANOVA) was used to compare differences in rice grain arsenic content. All statistical analyses were performed with Minitab v.16 (State College, PA).
3. Results
The recovery of arsenic from the soil and rice CRMs ranged between 83% - 89%; and recoveries of arsenic and iron from the spikes ranged between 87% - 92%. Although total recovery was not obtained, the high percentage recoveries recorded for the quality control measurements indicate that the digestion and analytical procedures used were robust and adequate. The limit of detection (LOD) of paddy soil arsenic was 0.06 mg/kg and that for paddy soil iron was 0.08%. For rice grain arsenic, LOD was 0.003 mg/kg.
3.1. Arsenic and Iron Concentrations in Paddy Soils from the Anum Valley
Figure 2 provides the percentage cumulative distribution of arsenic concentrations in paddy soil samples from Nobewam and Odumase. The concentration of arsenic in the Nobewam soils ranged from 0.6 mg/kg to 76.1 mg/kg, while that in the Odumase soils ranged from 5.3 to 106.2 mg/kg. Two-sample t-test performed on the data showed that mean arsenic concentration in the Nobewam soils (8.3 ± 3.0 mg/kg) was significantly lower (P < 0.001) than mean arsenic concentration in the Odumase soils (41.1 ± 6.0 mg/kg). At the 50th percentile, arsenic concentration in the Odumase soils (30.4 mg/kg) was almost ten times higher than that in the Nobewam soils (3.5 mg/kg).
The percentage cumulative distribution of soil iron concentrations in samples collected from both Nobewam and Odumase are presented in Figure 3. While iron concentration in the Nobewam soils ranged from 0.31% to

Figure 2. Percentage cumulative distribution of arsenic (As) concentrations in Nobewam and Odumase paddy soils.

Figure 3. Percentage cumulative distribution of iron (Fe) concentrations in Nobewam and Odumase paddy soils.
1.52%, that in the Odumase soils ranged from 0.38% to 1.64%. Two-sample t-test performed on the data showed no significant difference (P = 0.094) between the mean soil iron concentration for Nobewam (0.82% ± 0.05%) and that for Odumase (0.94% ± 0.08%).
When the soil data for both Nobewam and Odumase were analysed together, a highly significant regression relationship (P < 0.001) was observed between soil arsenic and soil iron concentrations (As = 70.0 Fe – 37.7) as shown in Figure 4. The regression analysis for only Nobewam soils, however, showed no significant regression relationship (P = 0.153) between soil arsenic and iron concentrations (Figure 5), although the relationship remained significant (P < 0.001) for the Odumase soils (Figure 6).
3.2. Arsenic Concentration in Rice Harvested from the Anum Valley versus Rice Harvested from Control Sites
Table 1 provides a summary of arsenic concentrations in rice grains harvested from the Anum Valley and from Abenase, Simpa and Yirase (control sites).

Figure 4. Regression of arsenic (As) versus iron (Fe) concentrations in both Nobewam and Odumase paddy soils.

Figure 5. Regression of arsenic (As) versus iron (Fe) concentrations in Nobewam paddy soils.
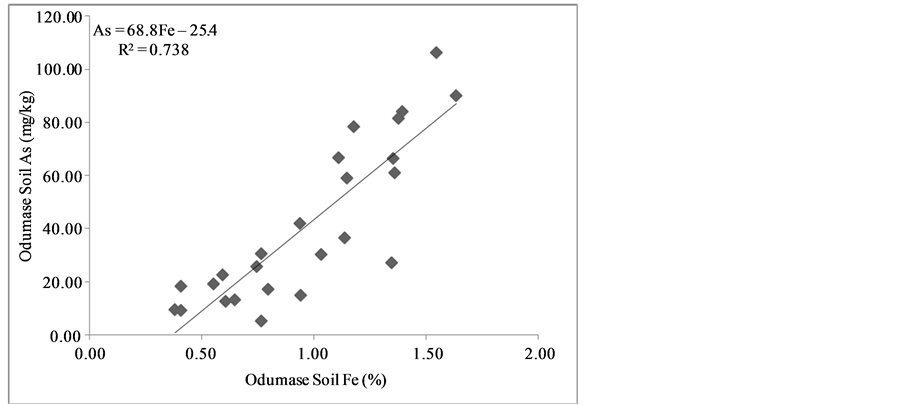
Figure 6. Regression of arsenic (As) versus iron (Fe) concentrations in Odumase paddy soils.

Table 1. Arsenic (As) concentrations in rice grains harvested from Anum Valley paddy field sites and control sites.
The values marked with asterisks in the last column of the table are the mean concentrations of inorganic arsenic in samples harvested from each study area.
The data in Table 1 show that there was no considerable difference in the arsenic content of rice grains harvested from the two study sites in the Anum Valley (i.e. Nobewam and Odumase). Since the mean grain arsenic concentrations for Nobewam and Odumase were not significantly different, the data for the two sites were pooled together and compared with the pooled data for rice grains collected from the control sites. One-way ANOVA performed on rice grain arsenic content versus paddy field location showed that the mean total arsenic content in Jasmine 85 harvested from the Anum Valley (0.41 ± 0.07 mg/kg; n = 7) was significantly higher than the mean total arsenic content in the same variety harvested from the control sites (0.11 ± 0.07 mg/kg; n = 9). Although rice grain samples from the Anum Valley had the lowest percentage mean total arsenic concentration of 61.7%, the corresponding mean inorganic arsenic content (0.25 mg/kg) was still considerably higher than the values recorded for the control samples (Table 1).
4. Discussion
4.1. Comparison of Arsenic Concentrations in Soils from the Two Anum Valley Paddy Field Sites
Soil arsenic concentrations exhibit considerable geographic variation [35] , but the general consensus is that arsenic levels in uncontaminated soils rarely exceed 10 mg/kg [31] [36] [37] . Figure 2 shows that less than 20% of the Nobewam soil samples recorded arsenic concentrations higher than 10 mg/kg, while more than 80% of the Odumase soil samples recorded arsenic concentrations exceeding 10 mg/kg. Surface run-offs from improperly disposed-off mine tailings at the former Konongo Gold Mine as well as artisanal mining activities in the Konongo-Odumase area are the main causes of arsenic contamination of the two paddy field sites in the Anum Valley [2] [3] . The contamination is much heavier in River Owerri, which is the only river that flows through the mine site at Konongo and the paddy fields at Odumase (see Figure 1). Reference [2] recorded arsenic concentrations of up to 430 µg/l in water samples collected from River Owerri. Since the water that flows through the Nobewam paddy fields is a mixture of water from both River Anum and River Owerri, it could be argued that the water flowing downstream from the source of River Anum causes a dilution of the arsenic concentration in River Owerri; hence accounting for the considerably lower mean total arsenic in the Nobewam soils. Differences in soil texture and soil conditions, such as organic matter content, redox potential and pH, may also account for the differences in soil arsenic concentrations; but these were not considered in the current study. The highest soil arsenic concentration recorded in the Odumase paddy soils (106.2 mg/kg) agrees well with results of the earlier study, which recorded arsenic concentrations of up to 103 mg/kg at the same site [3] .
4.2. Effects of Soil Arsenic and Soil Iron Interactions on Rice Plants
Generally, the concentration of iron in soils ranges from 0.5% - 5.0% [37] . The soil iron concentrations recorded for Nobewam and Odumase, therefore, fall within acceptable limits. Nonetheless, the strong relationship observed between soil iron and soil arsenic concentrations, especially at Odumase (Figure 4 and Figure 6), gives a cause for concern. The finding suggests either that iron is a co-contaminant of arsenic at Odumase or that arsenic in the Odumase soils is strongly bound to iron oxide minerals, as a result of enhanced rhizosphere oxidation induced by the phytotoxicity of arsenic. Oxidation of the rhizosphere will further promote iron plaque formation on the rice roots, and this has been shown to reduce availability of iron to the rice plant. Iron plaque, however, has higher affinity for arsenate (As V) and hence would have little influence on the uptake of arsenic in the form of arsenite (As III), which is the more soluble and mobile species of arsenic under flooded conditions [32] . Meanwhile, surface-adsorption of other nutrient elements such as zinc and manganese on iron plaque will decrease their phytoavailability, thus compromising the growth and development of the rice plant [32] [33] [38] . Symptoms of arsenic toxicity include cell plasmolysis, leaf wilting, root discolouration and violet colouration resulting from increased anthocyanin content. The most common effect, however, is growth reduction [37] . The effects of arsenic toxicity were already visible at the time of this study. Rice plants in a number of fields showed poor heading and stunted growth. Although nutrient element concentrations in plant tissues were not analysed in this study, this observation indicates that rice production in the Anum Valley is threatened by the elevated levels of arsenic and the binding of essential nutrient elements to iron oxide minerals.
4.3. Comparison of Arsenic Content in Rice from the Two Paddy Field Sites in the Anum Valley, i.e. Nobewam vs. Odumase
Given that mean arsenic concentration in the Odumase paddy soils was significantly higher than in the Nobewam paddy soils, it was interesting to find that there was no significant difference in the arsenic content of rice grains harvested from these two sites within the Anum Valley (Table 1). Evidence from studies on soil-shootgrain arsenic transfer have shown that rice grain arsenic concentrations increase sharply at low soil arsenic concentrations due to the highly efficient assimilation of arsenic by rice shoots, which efficiently transfer the arsenic to the grain at low shoot concentrations. Arsenic transfer to the grain, however, levels off at higher soil and shoot arsenic concentrations [34] [39] and this probably explains why rice grain arsenic content for Odumase was not significantly different from that for Nobewam. The observation of equally high arsenic concentrations in rice grains from Nobewam and Odumase, in spite of the higher contamination of soil and water at Odumase, is an indication of possible differences in the bioavailability of arsenic in soils at the two sites.
4.4. Comparison of Arsenic Content in Rice from the Anum Valley to Arsenic Content in Rice from the Control Sites
In an extensive study of the concentrations of inorganic arsenic and other trace elements in Ghanaian grain staples, rice grown in Ghana was found to be generally low in arsenic and cadmium compared to rice imported from other countries [26] . Thus, the low concentrations of arsenic in rice grain samples harvested from the control sites (i.e. Abenase, Simpa and Yirase) agree well with earlier findings. Since the arsenic concentrations in paddy soils and water used for rice cultivation are significantly higher in the Anum Valley [3] , it is not surprising that significantly higher arsenic concentrations were recorded in rice grain samples harvested from Nobewam and Odumase. A number of studies have also reported high arsenic concentrations in rice grown on mining-impacted soils [14] [15] [40] [41] .
The production of high arsenic rice in the Anum Valley is, however, a unique problem that has arisen as a result of arsenic contamination of River Owerri, mainly due to the poor gold mining practices in the KonongoOdumase area of the Ashanti region. Even with the least mean percentage inorganic arsenic content of 61.7% (Table 1), rice grown in the Anum Valley would contribute significantly more inorganic arsenic to daily dietary intake than rice grown at the control sites, assuming equal rates of consumption. The health risks associated with ingesting high arsenic rice are well documented [26] [27] [40] -[42] .
Field observations made in the course of this study suggest that ingestion of arsenic-contaminated water from River Owerri and its confluence with River Anum by some inhabitants of the Anum Valley could further increase the risk of dietary exposure to arsenic. It was also noted that some rice farmers harvest species of fish, which occur naturally in stagnant pools on the paddy fields, for consumption. Evidently, there is a need to review current land-use activities in the Anum Valley in order to reduce the build-up of arsenic in soil, water and food. Instead of paddy rice, cultivation of aerobically-grown plants such as maize and plantain may be more productive since arsenic is less soluble and also less mobile under aerobic conditions.
5. Conclusion
The study has confirmed that pollution from mining activities has resulted in high concentrations of arsenic in water and soils at the Nobewam and Odumase paddy field sites in the Anum Valley of Ghana. The levels of contamination with arsenic are, however, less pronounced at Nobewam than at Odumase. Although no significant differences were observed between the Nobewam and Odumase paddy field sites with respect to soil iron content, a strong relationship was observed between soil arsenic and soil iron concentrations, particularly at Odumase. Furthermore, equally high mean arsenic concentrations were found in rice grain samples from Nobewam and Odumase, despite the differences in soil arsenic content. These findings indicate that arsenic in the Odumase soils may be less bioavailable because it is bound to iron oxide minerals, as a result of enhanced rhizosphere oxidation caused by the phytotoxic effects of arsenic. This induction of iron plaque formation seems to have reduced the phytoavailability of zinc and other nutrient elements, thus causing poor heading and stunted growth of rice plants in the Anum Valley. In comparison to rice grain samples from Abenase, Simpa and Yirase (the three control sites selected for this study), the mean inorganic arsenic content of rice grains harvested from the Anum Valley was found to be considerably higher. Thus, consumption of rice grown in the Anum Valley would contribute more to the daily dietary intake of arsenic. The health implications may be further compounded by the source of drinking water and other dietary choices.
Acknowledgements
We are grateful to Mrs. Gladys Schwinger, Mr. Eric Nartey and Mr. Jeffrey Akpedonu for assistance in the field; and to Mr. Bashara Ahmed of the Centre for Remote Sensing and Geographic Information Systems (CERSGIS), University of Ghana, for help in creating the map of study sites.
NOTES
*Corresponding author.