Efficacy of non-pharmacological interventions in controlling type 2 diabetes in patients of African descent: A systematic review ()
1. INTRODUCTION
Estimates by the WHO demonstrate the scope of the diabetes challenge: 438 million people world-wide will have diabetes by 2030, and one in three Americans will have the disease by 2050 [1,2]. The prevalence of diabetes is much higher among populations of African descent in developed countries. In the USA, for example, African Americans are twice as likely to be diagnosed with diabetes (prevalence of 11.8%) and a third of cases are undiagnosed. Further, among African Americans type 2 diabetes accounts for 90% to 95% of all cases [3]. In the UK, it was estimated that the African Caribbean population had a prevalence of diabetes three times greater than the general population in 2006 [4].
Alongside the high prevalence of diabetes among patients from African ancestry in developed countries, increased complication rates are also reported. In the US, the National Health and Nutrition Examination Survey (NHANES) 1971-1992 prospective analysis of the amputation rates of a 14,407 cohort concluded that African American participants (2199 in number) underwent 2.8 times more amputations compared to their white counterparts [5]. Feinglass and colleagues further stated that males of African ancestry were 1.7 times more likely to experience primary and repeat amputations [6]. Likewise, the prevalence of diabetic retinopathy and macular oedema was also higher in participants from African ancestry with diabetes (36.7% and 11.1% compared to 24.8% and 2.7% among white, and 25.7% and 8.9% among Chinese patients respectively) [7]. In a different study Gulliford and colleagues determined that the prevalence of sight-threatening diabetic retinopathy was 15.2% in Africans, 14.7% in African-Caribbean and 9.4% in white Europeans. The data which were collected in three South London boroughs during an 18-month period suggested that retinopathy is not only more prevalent but also more severe in those with African ancestry [8].
Particular group characteristics may influence the management of diabetes among patients of African descent. These include the adherence to medication [9], health beliefs and cultural bias [10-14], health numeracy [15], access to health care and insurance issues [16-18], and socio-economic status [19]. Self-management practices in patients of African descent and other ethnic populations in developed countries were reviewed and it was concluded that there was lack of education, understanding and communication at the patient level and cultural differences or lack of cultural sensitivity at provider levels [20,21]. Chin and colleagues reported on effectiveness of interventions to reduce racial disparities in health care [22]. The most effective interventions were found to be multifaceted programmes aimed simultaneously at patient provider and health organisation. Culturally tailored quality improvement programmes based on cultural “leverage” showed improvement in patient empowerment for self-care, decreased barriers of access to physicians and improved cultural sensitivity by health care providers. Peek et al. [23] reviewed diabetes care interventions in multiple ethnic groups such as Hispanics, African Americans, Americans of Caribbean origin, Native American, Asian American and Pacific Islanders. The most effective interventions were noted to be culturally tailored, individual education with peer support and improvements to health care systems [23]. Hawthorne et al. [24] reviewed the literature in relation to the effectiveness of culturally appropriate health education for type 2 diabetes in patients of African descent and other ethnic groups. The authors reported improvement of mean difference in HbA1C at 3 and 6 months post-intervention, but not at 12 months. However, heterogeneity in the education and follow-up methods made interpretation of the benefits difficult to interpret.
A large number of people of African and Caribbean descent live in developed countries such as the USA and the UK. Such individuals have specific characteristics which may differentiate them from other ethnic and racial groups, and also have a high rate of type 2 diabetes. Therefore, it is important to review the effectiveness of targeted non-pharmacological interventions on diabetes control in this population. Such information is essential to establish the value of such programs and to inform the design of future care strategies. The effectiveness of these interventions will be assessed by their ability to reduce blood glucose levels in the target population. The goal is to compare the interventions with control or usual care.
2. METHODOLOGY
2.1. Search Strategy
Databases (PubMed, Embase, CINAHL, ZETOC, NHS evidence, Clinical trials.gov and SIGLE) were searched using the combined search terms “type 2 diabetes” and/ or “intervention” and “black” or “African” or “Caribbean”. In addition, references of the journals and reference text books were consulted. The searches were done between November and December 2010, May to June 2011 and between September 24th and October 6th 2011 (Figure 1).
2.2. Selection Criteria
The population of interest was adult participants of African descent in developed countries which includes “African-Americans”, “African-Caribbean”, “Non-Hispanic blacks” and “self-described blacks”. Studies were restricted to those published in English from the developed
English speaking countries such as the USA and the UK The interventions of interest were non-pharmacological including educational programs. The primary outcome of interest was a measure of difference in HbA1C with the standard deviation.
2.3. Inclusion Criteria
This included randomised controlled trials (RCTs) or prospective cohort studies published between January 1st 1995 and October 6th 2011. The participants, males or females, had type 2 diabetes according to the WHO criteria and were 18 years or older (adults). Trials including participants with diabetes under age 18, persons with type 1 diabetes, known LADA, MODY and those with gestational diabetes were excluded. Also excluded, were interventions in which less than 90% of participants were of African descent. Feasibility studies for an intervention were also excluded, but pilot studies were included if the outcome data were appropriate, and if the study was not duplicated.
2.4. Quality Assessment
Critical appraisal checklists were adapted from Cochrane Collaboration tool for assessing risk of bias and the quality of each study. Information from all included studies was extracted and tabulated. Where data were insufficient for a particular study, authors were contacted for clarification.
2.5. Data Extraction
Data were extracted using a RevMan data collection form according to the selection criteria, and subsequently analysed. The information extracted included the study information (author and year), participant characteristics and number of participants recruited. The duration of intervention was 6 months where possible. Drop-outs, as well as type of intervention and duration of the intervention/study duration were also extracted with every effort to minimise missing data. The outcome measures of HbA1C difference were calculated for each trial before synthesising the data.
2.6. Data Analysis
Standardised mean difference was used to describe the data. The mean difference for the intervention and the control were calculated separately and the standard deviation within the groups calculated for missing data. The effect size calculated was from the net difference in mean HbA1C between the intervention and the control groups. Hedges unbiased estimate was used to correct the overestimated value of the mean difference in studies with small sample sizes. Sd (within) was calculated from sq root  [25].
[25].
RevMan software was used for Meta-analysis of HbA1C results. Testing for heterogeneity in the data by the chi-square test and Forest plot of the trials was included in the review. RevMan statistics were also confirmed by calculation.
3. RESULTS
Initially 4952 studies were identified through database searches of PubMed, CINAHL, Embase, and one additional from a local conference. Of the 58 potential studies for inclusion only 9 met inclusion criteria and were subsequently included in the systematic review with 8 being controlled trials. The characteristics of included studies are tabulated below (Table 1). A Pre-test posttest longitudinal study was included because this study was randomised and had two groups—a control and experimental group, resembling a RCT [26]. A control intervention time series study, a cohort study, was also included [34].
3.1. Characteristics of Included Studies
All of the studies were comparisons of interventions within an African American population and the effectiveness at improving outcomes including HbA1C. The length of trials ranged from 6 months to 36 months. The sample participant sizes ranged from 64 to 4138 with mean age of 56 - 62 years. Participants were either all or at least 94% African Americans. All selected studies were from the USA. There were over 64% females in every group. The studies took place in urban African American communities, with the exception of Skelly et al. and Anderson-Loftin et al., which were located in rural southeast and South Carolina. Control groups included a 2 × 2 factorial design [31] and a three group experimental design [33]. The studies were of an intervention compared to usual care, conventional care or minimal intervention. Comparisons between the intervention and control group baseline group characteristics were not statistically different within each study. The one exception was that of Anderson-Loftin et al. [27].
In one trial [29] HbA1C was not the primary outcome and in the remaining trials, HbA1C was not the only outcome measured; BMI/weight, lipids and blood pressure were other outcomes measured in the remaining trials. Methods used to measure the unit of the outcome HbA1C varied and included high pressure liquid chromatography, Glycaffin column method, immunoturbidimetric method, and glucometer; none of the methods accounted for haemoglobin variants. HbA1C was measured in % mg/dl; IFCC mmol/mol units were not found in the literature. Proportion of patients reaching target HbA1C was only reported in few studies so this was

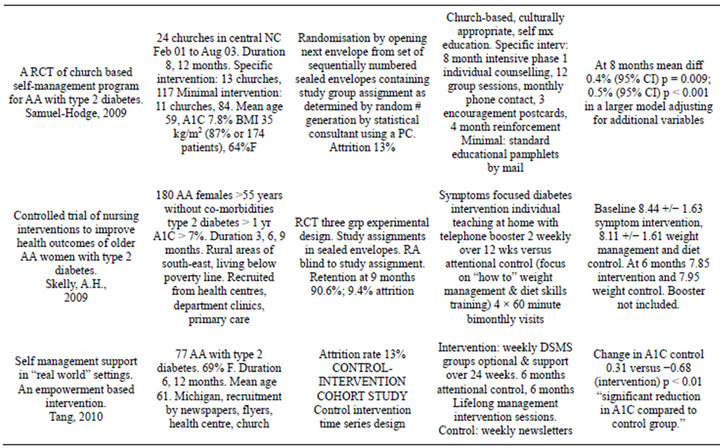
Table 1. Characteristics of included studies [26-34].
abandoned for meta-analysis.
The trials mainly targeted patient education. One study focused on exercise and dietary self-management. There were no multi-component interventions. The interventions used both individual or group designs—3 group interventions, 4 individual and 2 mixed interventions. There was one provider intervention and 8 patient interventions; the trial interventions used the expertise of diabetes educators, nurses, community health workers, lay health educators and counselors and, less often, physicians.
3.2. Quality of the Studies Selected
A total number of 3329 participants at baseline were divided into the intervention and control groups. Patients lost to attrition varied between 8% and 23% - 44%; for the latter there was a baseline difference between the intervention and control groups; all of the studies commented on attrition or addressed incomplete data. Using the modified Cochrane Collaboration tool for quality score, allocation concealment was described in one study [27], blinding in four studies [27,29,31,33], and adequate sequence generation in four [27,30,32,33]. Two studies were considered high quality, 6 studies were considered fair quality and 1 study considered inadequate/poor quality (Table 2).
Relevant HbA1C data were available for six of the studies for meta-analysis. The effect measure of standardised mean difference of the random effects model is presented in the forest plot below (Figure 2). The pooled results reveal high heterogeneity, that is, I2 = 92% of the variation between the studies is due to heterogeneity p < 0.00001; most of the observed variance is real, indicating that these studies are too different to compare. The random effects pooled standard mean difference favoured the intervention −0.66 (−1.15, −0.17). The test for overall effect produced a p = 0.009. Sensitivity analysis was done with removal of Gary study (Figure 3). This study was an outlier with weight of 18.1% (42.9% in the fixed method analysis) with sample size over 200 in each study arm; the other studies had samples sizes that were more comparable. After sensitivity analysis the heterogeneity was moderate to high I2 = 69% p < 0.01. The Chi-square test was still greater than the degrees of freedom at 12.99 versus 5 indicating heterogeneity. The random effects pooled standard mean difference still favoured the intervention after sensitivity analysis −0.48 (−0.81, −0.16). Also after sensitivity analysis the test for overall effect produced a p = 0.009.
4. DISCUSSION
In this systematic review and meta-analysis non-pharmacological care interventions specifically directed at populations of African descent appear to significantly
Table 2. Quality table for the included studies.