Theory of Electron Density of States of High Temperature Impurity Induced Anharmonic Superconductors ()
1. Introduction
The discovery of HTS [1], excitingly opened up a new field of research in solid state physics experimentalists as well as theorists. The effect of anharmonicity, impurities as electron-phonon problem in HTS is least studied [2-5] due to its very complicated nature, because the unit cell of these compounds contain, beside two superconducting planes, the chain elements connected by bridge with plain through the apical oxygen ions . The interaction of electrons with anharmonic lattice vibrations is a longstanding problem that is not yet fully understood. The effects of anharmonicity on the electron-phonon problem and more specifically on superconductivity are relatively unknown. The present investigation deals with the impurity induced anharmonic phonon-electron problem, in which the contribution due to anharmonicities, isotropic impurities and interference has been dealt via an almost complete Hamiltonian. Having developed the electron Green’s function the expressions for energy spectrum and electron density of states have been obtained with few new features for the High temperature superconductors.
2. Quantum Dynamics of Electrons
Let us consider the double-time thermodynamic electron retarded Green’s function [6,7]
 (1)
(1)
via an almost complete Hamiltonian [5-7]
 (2)
(2)
where ,
,  ,
,  ,
,  and
and , respectively are unperturbed electron-, unperturbed phonon-, electronphonon-, anharmonic (upto quartic terms)-, and defect contributions to the Hamiltonian
  and are expressible in the form [8]


In the above equations  and
and  are the electron creation (annihilation) and phonon field and momentum operators, respectively.
  (
( and
and  are phonon and electron wave vectors) and
  stands for electron-phonon coupling coefficient.
 ,
,  and
and  are anharmonic coupling coefficients mass and force constant change parameters, respectively. Following the equation of motion technique [8-10] of quantum dynamics via Hamiltonian (2) and using Dyson’s equation approach we can obtain the Green’s function as
 (3)
(3)
where  and
and  are electron and pairon frequencies.
The excitation spectrum i.e. a response function can be expressed as
 (4)
(4)
Here  and
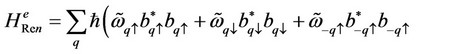
and  are the electron energy shift and electron line width respectively. Higher order Green’s function appearing in response function is decoupled using an appropriate decoupling scheme and the remaining Green’s function is evaluated via a renormalized electron and phonon Hamiltonian

 (5)
(5)
 (6)
(6)
Equation (3) can be written in simplified form as
 (7)
(7)
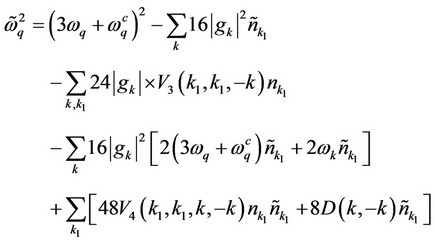
with electron perturbed mode and renormalized electron mode
  frequencies
 (8)
(8)
 (9)
(9)
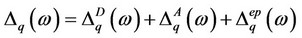
Now electron energy shift and line widths are obtainable as
 (10)
(10)

 (11)
(11)
 (12)
(12)

 (13)
(13)

 (14)
(14)

 (15)
(15)
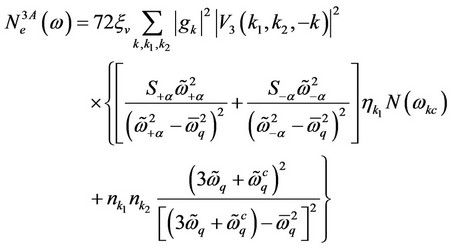
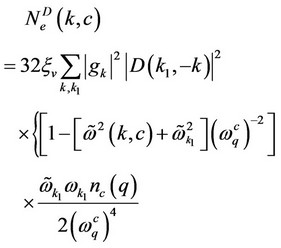
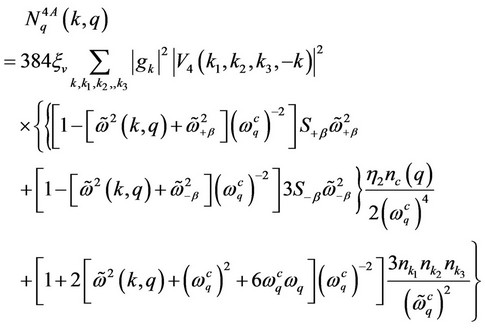
where the superscript “D”, “3A”, “4A” and “ep” stand for the contributions due to defects, anharmonicities (cubic  and quartic
 ) and electron-phonon interactions, respectively.
 (16)
(16)
 (17)
(17)
 (18)
(18)

 (19)
(19)
 (20)
(20)
 (21)
(21)
3. Electron Density of States of High Temperature Superconductors
The electron density of states (EDOS) in Lehman representation can be expressed as
 (22)
(22)
Imaginary part of  is given by
 (23)
(23)
Using the imaginary part of Green’s function from Equation (23) in Equation (22) in Lehman representation we can write result
 (24)
(24)
Equation (24) can be reasonably approximated for small values of line width in the form
 (25)
(25)
 (26)
(26)
The various contributions to EDOS appears in Equation (26) can be summarized as

 (27)
(27)
 (28)
(28)
 (29)
(29)
 (30)
(30)
All the above expressions of density of states depend on the temperature. Let us examine EDOS in the following two regions.
Case-1 At the temperature very close to critical temperature, most of the electrons in superconducting state are paired. The collection of pairons (cooper pair, bipolarons) constitutes the condense or super fluid i.e. the pairons dominate over the normal electron
 (31)
(31)

 (32)
(32)

 (33)
(33)

 (34)
(34)
Case-2 In this case  , the contribution of normal energy becomes least than the pairon energy, so that the pairon energy dominates over the unpaired energy of the system and transits to the superconducting state. The EDOS in this situation becomes as
 (35)
(35)
 (36)
(36)
 (37)
(37)
 (38)
(38)
 (39)
(39)
The various symbols in above equations can be expressed as
 (40)
(40)
 (41)
(41)
 (42)
(42)
 (43)
(43)
 is pairon distribution function.
Rest of the symbols are defined in references elsewhere [8].
4. Results and Discussion
The variation of EDOS for  and
and  is depicted in the Figures 1 and 2. These graphics are similar to the experimental imaging of quasi particle density of states for impurity induced
  EDOS and anharmonic EDOS. The central peak in Figure 1 exhibits the enhanced peak in the close vicinity of impurity site. This also reveals the evidence of four fold symmetric quasi particle cloud intensity peaks aligned with the nodes of the d-wave superconducting gap which is believed to characterize the HTSC and well supports the experimental observations of Pan et al. [11-12]. Figure 2 describes the effects of cubic anharmonicities on electron density of states
 . Four almost sharp peaks are found symmetrically distributed from both
  and
and  axes. It also notable that the pairon distribution function
 , energy
  and temperature functions
  heavily influence the anharmonic contribution to EDOS as well as the other terms appearing in the EDOS. It emerges from the present investigations that EDOS not only depends on energy but also on renormalized frequency, anharmonicities, impurity concentration and

Figure 1. Electronic excitation due to impurity induced electron-phonon interaction.

Figure 2. Effects of cubic anharmonicity contribution to EDOS.
temperature and well support to d-wave superconductivity.
5. Acknowledgements
The authors (HS) and (AS) are thankful to Ministry of Human Resource development (MHRD), New Delhi and Council of Scientific and Industrial Research (CSIR), New Delhi for the financial support to carry out this research work.
NOTES