Multivariate Approach to Characterizing Soil Quality of Gabonese’s Ferralitic Soils ()
1. Introduction
In the light of its functions, soil is one of the most important components of the environment [1] [2] [3] [4] . Soil is part of critical ecosystem services ensuring sustaining plant productivity and food security, filtering water and denaturing organic pollutants. Moreover, it controls soil nutrient recycling and sequestering organic carbon, provides a habitat for biodiversity, and mitigates greenhouse gases in the atmosphere and climate change [1] [2] [3] [4] [5] . However, the ability to play its role is threatened by environmental and anthropogenic factors [6] - [14] . Thus, the assessment of soil quality indices is a decision support to evaluate the magnitude of soil degradation and implement the appropriate intervention in the context of drought and climate change.
Recently, numerous works focused on the study of soil health [15] [16] [17] [18] or soil quality [19] [20] [21] [22] [23] . However, all these studies relate only to temperate zones while the assessment of soil quality is very scarce in tropical regions [24] [25] [26] , particularly in sub-Saharan regions [27] [28] [29] [30] .
Although both terms are similar, scientists are not in accordance with their interchangeability [5] [31] . Indeed, soil quality refers to the capacity of soil to deliver a wide range of ecosystem services, including biomass production [32] whereas soil health is presented as a finite and dynamic living soil resource, and is directly correlated to plant health [31] [33] and the committee for Soil Science Society of America [34] soil quality is defined as “the capacity of soil to function, to sustain plant and animal productivities, to maintain or enhance water and air quality and to support human health and habitation”.
Definitively, the improvement of soil quality is also a response to achieving the Sustainable Development Goals (Figure 1 and Table 1) (https://sdgs.un.org/fr/goals).
With a total area of 267,700 km2, Gabon is the most densely forested country in Central Africa, harbouring a forest cover of about 88.5% of the area [35] . The annual gross deforestation rate is estimated at 0.12% [36] [37] [38] . According to [39] , the country counts only 1% of arable land. Their fertility is controlled by both soil parent material and texture [40] [41] [42] [43] [44] . On one hand, the
![]() AWC = available water capacity; SOC = soil organic C; CEC = cation exchange capacity; EC = electrical conductivity; MBC = microbial biomass; MRT = mean residence time.
AWC = available water capacity; SOC = soil organic C; CEC = cation exchange capacity; EC = electrical conductivity; MBC = microbial biomass; MRT = mean residence time.
Figure 1. Relation between soil quality and sustainable development goals [31] .
![]()
Table 1. Advancing sustainable development goals through management of soil quality [31] .
SDGs : Sustainable development goals.
Ferralitic context of soils is dominated by Acrisol, Ferralsol, Nitrisol soils and particularly by Arenosol soils, which are the most represented soil type in Africa (22%) [39] [43] . However, these soils are mainly nutrient-poor with coarse texture. Nevertheless, they can however be managed to improve their fertility and ensure good plant and/or tree growth [45] [46] [47] . They may have an important amount of iron and aluminium oxides, inducing extremely or strongly acidic conditions in soils (pH < 5.5) [46] . Therefore, they are characterized by strong leaching of soil nutrients [48] In addition, the apparent sandy texture, dominated by kaolinite and characterized by low mineralogical activity and nutrient capacity storage [39] [43] [49] increases leaching and nutrient deficiency [44] [50] [51] . Moreover, the humid tropical context, associated with parent material, could be considered as the main threat to soil quality in Gabon. Indeed, the high humidity induces a rapid mineralization of SOM [39] [48] . Accordingly, these soils become unfavorable for food crops. Thus, the introduction of sustainable agricultural practices, such as the use of nitrogen-fixing species, application of organic manure or management of organic residues could improve soil health in Gabon. Despite the numerous agricultural projects launched in recent years, the knowledge dedicated to Gabonese soils is still very limited. However, recent works have highlighted their strong ability to store organic carbon [43] [44] and to foster better soil health through sustainable management [52] . Therefore, the only nationwide study on the determination of agronomic potential was carried out 40 years ago by OSTROM (Office de la Recherche Scientifique et Technique d’Outre-Mer).
Gabon is the second most forested country among the six countries located in the second largest rainforest ecosystem in the Congo Basin. The country counts 23 million ha out of 268 million ha of dense equatorial evergreen forest in the Congo Basin [53] . According to the FAO, the dominant land cover class in Gabon is evergreen and semi-deciduous forest. This forest cover is a great carbon sink [54] after the Congo Basin peatlands, located between the Democratic Republic of Congo and the Republic of Congo [55] . Recently, the United Nations Framework Convention on Climate Change certified Gabon for Carbon credit [56] . The input of this cover in carbon sink formation deeply depends however on the quality of the soil. To the state of our knowledge, few studies using soil quality indices, to evaluate soil quality within Congo Basin, have been conducted in Cameroon [57] [58] . Furthermore, maintaining healthy soils in the region is an absolute priority in view of challenges such as i) food security, ii) increase of forest production, iii) high fuelwood energy consumption and iv) climate change (https://www.un.org/development/desa/disabilities/envision2030.html; [52] ).
In the context of Gabon, the present study aims to i) determine the MDS soil indicators which control soil quality, ii) assess and map soil quality with the only set of data available through multivariate models and iii) identify the best model to track temporal changes in soil quality in countrywide to prepare future soil quality monitoring. Ultimately, how to better use soil quality indices to improve soil health and overall soil quality will be discussed.
2. Material and Methods
2.1. Study Area
Gabon is located in Central Africa and is the second most forested (10%) country in the Congo Basin (Figure 2), after the Democratic Republic of Congo (60% of the overall area). It is covered at 88.5% by a dense equatorial evergreen forest. The remaining vegetal cover consists of savannas (6%), flooded broadleaved (3%) and cropland (2%) [35] [54] [59] .
The climate is humid tropical with annual mean temperatures ranging between 26˚C (in January) and 23˚C (between June and August) [60] . Precipitation varies from the wet coastal northwest (3200 mm) to the drier interior southeast (1300 mm) due to a longitudinal precipitation gradient [61] .
The country has a contrasted basement geology. The eastern is largely dominated by metasedimentary and metaigneous rocks, while the western is a mosaic of carbonate and non‑carbonate rock minerals [40] . In addition, in the central and northeastern Gabon, the soils were developed on granite. Thus, they are classified as Xanthic Ferralsols and Ferralic Cambisols. However, soils from the arid southeast are rather iron-rich Plinthosols. And along the coast, soils are Ferralic Arensols and Calcaric Fluvisols [43] .
![]() G1: Estuaire; G2: Haout-Ogooué; G3: Moyen-Ogooué; G4: Ngounié; G5: Nyanga; G6: Ogooué-Ivindo; G7: Ogooué-Lolo; G7: Ogooué-Maritime; G9: Woleu-Ntem.
G1: Estuaire; G2: Haout-Ogooué; G3: Moyen-Ogooué; G4: Ngounié; G5: Nyanga; G6: Ogooué-Ivindo; G7: Ogooué-Lolo; G7: Ogooué-Maritime; G9: Woleu-Ntem.
Figure 2. Geographic sample location of study area.
2.2. Data Sources
This study is based on a database from OSTROM’s reports, which was carried out between 1969 and 1981 in Gabon. The dataset dedicated to 1059 samples from arable soil (0 - 30 cm depth) was extracted from reports. The sampling was performed according to various land use/land cover (primary and secondary forests, shrub and herbaceous savannahs, fallow forest and cropland) in 8 out of 9 provinces in Gabon. The dataset was grouped on physical (size particle fractions) and chemical soil parameters (soil organic carbon, total nitrogen, C/N ratio, soil water pH, cation exchange capacity, exchangeable bases and available phosphorus).
Soil pH was determined at a soil-water ratio of 1:2.5 (w:v) with a pH meter. Soil organic carbon (SOC) was measured using the Walkey-Black method [62] . Total nitrogen (TN) was determined by using the Kjeldahl digestion method [63] The spectrophotometer detection method was applied to determine available phosphorus (av. P), before an extraction step with 0.5 M sodium carbonate bicarbonate [64] Exchangeable bases (Ca2+, Mg2+ and K+) were extracted with 1 M ammonium acetate solution at pH 7 and were respectively measured using EDTA compleximetric titration and flame photometric methods [65] [66] The cation exchange capacity (CEC) was estimated by 1 N ammonium acetate (pH 7.0) method [67] [68] . Soil particle size distribution was determined by the pipet method [69] . Bulk density (BD) was determined using the pedotransfer function [44] .
2.3. Developing of Soil Quality Index
In the current context of anthropogenic pressure on soils and their degradation, soil quality is a good indicator of the measured soil status. Thus, the improvement of soil quality promotes soil health by creating an ecosystem favorable to agriculture and ensuring food security [5] [31] [70] . In consequence, both of them are measurement tools of soil status. As a consequence, its assessment indicates the influence, over a long period, of land use on agricultural sustainability [31] [71] [72] [73] .
The assessment of soil quality is based on the combination of physico-chemical [22] [74] [75] or even biological parameters (such as enzymatic activities and microbial biomass carbon) [19] [76] [77] . Indeed, the latter influence soil productivity and are generally sensitive to environmental changes [19] [77] [78] [79] . Then, these parameters are considered as indicators of soil quality [77] - [83] . Due to its ease of implementation and quantitative flexibility [84] [85] [86] , soil quality index (SQI) is the most frequently used among existing ones, such as soil card design and test kids [87] , geostatistical methods [88] and expert opinions [89] [90] . The development of SQI is based on three steps: i) selection of indicators, ii) score assignation for selected indicators and iii) integration of indicators in an index [91] . In the first step, two approaches as widely used in the evaluation of SQI: Total Data Set (TDS) and Minimum Data Set (MDS). On the one hand, TDS considers all indicators regarding the experimental analyses. On the other hand, MDS derives from TDS by a selection of indicators, using principal component analysis (PCA) and correlation analysis to reduce data redundancy [92] [93] [94] . Standard scoring functions [79] [95] [96] [97] , nonlinear or linear scoring function methods [19] [21] [22] are widely used to normalize data to eliminate the bias, such as different units within soil indicators [21] [94] . Finally, the integration of dimensionless indicators into a quality index is possible through the use of various models including additive (AQI) and weighted additive (WQI) index [74] [89] [98] [99] . However, the Nemoro Quality Index (NQI), based on the average and the minimum indicator score, without considering their weight [85] is also used as the SQI model [78] [96] [100] . To monitor soil quality in the long term, experiment indicators and approaches have thus to be first selected.
2.3.1. Indicator Selection
According to their influence in soil structure, nutrients cycles, carbon transformation and buffering capacity, soil physico-chemical properties (BD, pH, exchangeable bases, SOC, TN, CEC, av. P, C/N ratio, clay and sand) were investigated to select the minimum data set (MDS) indicators that are sensitive to the external environment [19] [77] [78] [79] [101] . Firstly, principal component analysis (PCA) was conducted to determine and select components with an eigenvalue ≥ 1. Soil variable with loading value ≥ 0.5 on multiple PCs was grouped into PC in which it had high value [20] [79] [102] . Secondly, norm values for each variable were calculated according to Equation (1) and those within 10% of highest scores from each group were selected [103] [104] Norm values were calculated as follows:
(1)
where Normik is comprehensive loading of soil variable i on the k PCs with an eigenvalue ≥ 1, λk is k-th PC eigenvalue, uik is the loading of soil variable i on the k-thPC.
Finally, correlation analysis was used to determine some variables with high norm values within groups were redundant and MDS could be further reduced [79] [105] .
2.3.2. Variable Scoring Functions
A scoring function was used to normalize data due to their different units [74] . Soil variables were transformed and normalized to dimensionless values between 0 and 1 using the standard scoring functions due to its accuracy [2] [78] [101] [106] [107] . According to their soil quality function, the variables scoring were calculated using three standard score function equations (“more is better, MB” (Equation (2)) and “less is better, LB” (Equation (3))) [21] [77] [100] . Three methods, such as linear, non-linear and standard score, were used to calculate the indicator scores.
For linear scoring, MB (Equation (2)) and LB (Equation (3)) were determined as follows:
(2)
(3)
where SL,m and SL,l are respectively the linear score indicators for “more is better, MB” and “less is better, LB” soil indicators, x is the soil variable value, xmax and xmin are the extremum value of each soil indicator [21] [106] [108] .
For non-linear, the scoring function is the following:
(4)
where SNL is the non-linear score indicator of soil variable ranging from 0 to 1, a is the maximum score which equal to 1 in this study, x is the soil variable value, xmean is the mean value of each inside the database and b is the slope of equation, −2.5 for MB and 2.5 for LB [19] [108] [109] [110] [111] .
For the standing scoring, the following score functions Equation (5) and Equation (6) were respectively used for MB and LB:
(5)
(6)
where
is the linear standard scoring function, x is the soil variable value, L and U respectively the lower and upper threshold values of the soil variable.
In this study, MB function was applied to soil variables which have positive effects on soil quality, such as chemical soil properties (exchangeable bases, SOC, TN, CEC, av. P, C/N ratio), whereas LB function refers to BD, because high value of this indicator was restrictive to soil quality [77] [78] [96] . According to acidic soil pH mean values observed in whole country (<5), MB scoring function was applied for pH [77] [78] . Considering its effects on macro/micro-porosity partitioning in soil and structural stability, MB function was used to score clay, whereas LB was chosen for sand due to its lixiviation effects on soil nutrients [22] [112] .
2.3.3. Soil Quality Index
Soil quality indexes were determined according to multivariate approaches. In the one hand, indicator scores were integrated into SQI using additive method (Equation (7)) and weighted additive (Equation (5)) was determined as follows [19]
(7)
where AQI is the additive and weighted additive soil quality index, Si is the variable score calculated according to Equations (2), (3), (4) and n is the number of variable in TDS or MDS.
Then, weighted additive soil quality index (WQIadd) was calculated according to Equation (8):
(8)
where and Wi is the weighting value of each variable, determined using communality values (Ci), which ranged between 0 to 1 for each indicator. These latter indicated the contribution of each variable to overall variance [77] [79] [96] . Moreover, Wi derived from PCA and was calculated as the ratio of communality value of variable with the sum of communalities of all TDS or MDS variables [77] [96] :
(9)
Then, SQI weighted communality soil quality index (WQIcom) was calculated using standard scoring function as follows:
(10)
where WQIcom is weighted communality soil quality index, Si is the variable score determined according to Equation (5) and Equation (6), Wi is the weighting value of each variable (Equation (9)).
In the other hand, given that the average and minimum scores for the indicators, the Nemero quality index (Equation (11)) was calculating according the following equation [78] [100] :
(11)
where NQI is the Nemero quality index, Pave and Pmin are respectively average and minimum scores variables in a sampling site, and n is the number of variables.
2.3.4. Evaluation of Soil Quality Indexing Methods
The accuracy and validation of each model were determined using the sensitivity index (SI), defined as follows:
(12)
where SI is the sensitive index, SQImax and SQImin are respectively the maximum and minimum soil quality values of the index observed under each indexing model [112] [113] . According to [114] the SQI model with a higher SI value is more preferable, as this is sensitive to perturbations and management practices.
2.3.5. Soil Quality Grades and Spatial Map Variability
Soil quality was divided into five grades according to Table 2. It is defined that grade V (Q5) refers to soil with the most severe restrictions on plant growth, grade IV (Q4) is more serious than grade III (Q3), which is suitable for plant growth, but with some limitations. The grade II (Q2) is suitable for plant growth and grade I (Q1) is the most suitable for the plant growth [9] [75] [85] .
2.4. Soil Quality Mapping
Digital soil quality mapping was possible due to a large part of the sample which was precisely located by geographic coordinates. Therefore, some samples were located using rivers, roads, or relief near the site. This old location method introduced imprecise location of some samples. It is also important to note that thirty years ago, the local coordinates system used on old maps were abandoned and replaced by the World Geodetic System WGS84, the most precise coordinate system, actually used in the world. This change in coordinate system is another source of precision lake in the sample location. Even if sample locations are not very precisely located, our maps are useful to make the regional interpretation method, we propose in this work.
Maps were elaborated in three steps. Firstly, the digitalization and georeferencing of old regional and national soil maps were done [44] . This preliminary work made it possible to locate the maps taking into account the new coordinate system. We were able to find the geographic coordinates of poorly located samples. Secondly, a database, including location, geographic coordinates, soil major classes and soil quality grades, for each sample was created. Finally, Qgis was used to overlay the map and the database. It was therefore possible to perform thematic analyses of the data.
2.5. Statistical Analysis
All statistical analyses (descriptive statistics, analysis of variance, PCA, Pearson’s coefficient correlations and linear regression) were performed with R Project 4.2.0 software. Correlation analysis was conducted to identify relationships between soil indicators. Tests were assessed at the 0.05 significance level.
![]()
Table 2. Soil quality grades classification criteria for soil quality index models into TDS and MDS approaches.
Q, Quality; VL, Very low (Q5); L, Low (Q4); M, Medium(Q3); H, High (Q2); VH, Very high (Q1); AQI, Additive quality index; WQI, Weighted quality index; NQI, Nemero quality index; TDS, Total data set; MDS, Minimum data set [22] .
3. Results
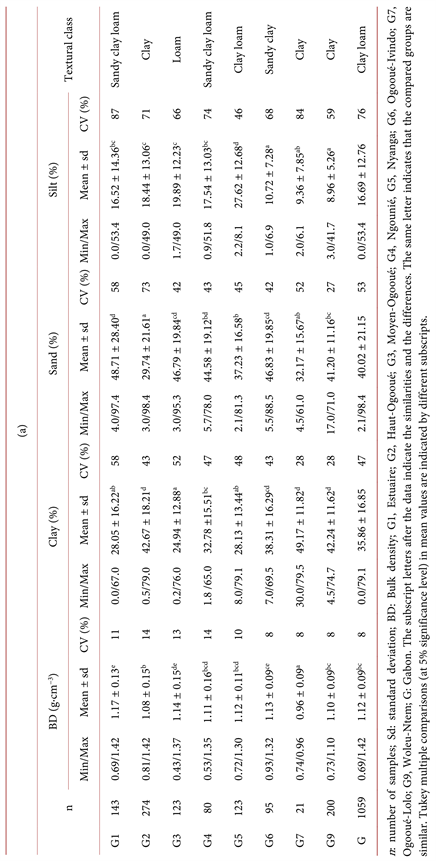
Thirteen soil physico-chemical parameters were extracted to ORSTOM’s reports and were analysed. Only bulk density (BD) was determined by a pedotransfer function. Descriptive statistics of properties of the studied arable soils of different provinces (n = 8) are shown in Table 3.
3.1. Soil Physical Properties
In this study, only two soil physical parameters, BD and size fraction particle, were investigated at a national scale (Table 3(a)). Size particles indicated a varied distribution in soil throughout the country. Topsoil clay proportions ranged from low (24.94% for G3) to high level (49.17% for G2) and between moderate (29.74 % for G2) to high amount (48% for G1) for sand fraction. The spatial distribution of clay fraction showed a significantly higher difference content in G2 compared to G1, G2, G3, G4 and G5 (P < 0.001). While at the same time, the silt proportion was significantly lower than others (P < 0.01). In general, the silt fraction distribution showed a slight variation in the contents, ranging from very low (<10% for G7 and G9) to low levels (10% - 25%), except for G5 (27%) which presented a moderate but significant highest content than others (P < 0.001). Ultimately, soils in Gabon presented low silt (10%), moderate clay (35%) and high sand (40%) levels which traduced a clay loam texture.
Bulk density had a slightly identical countrywide value. They ranged from 0.96 g∙cm−3 for G7 to 1.17 g∙cm−3 for G1, with a national value of 1.1 g∙cm−3. The BD value recorded in G7 was lowest and significantly different than others (P < 0.001), potentially due to the higher organic matter content that results in high pore space.
3.2. Soil Chemical Properties
The spatial variation of soil chemical properties, such as pH, SOM subsequent (SOC, TN, C/N ratio), exchangeable bases (Ca2+, Mg2+ and K+), cationic exchange capacity (CEC) and available phosphorus was presented in Table 3(b). The data showed a small variation in the pH values, ranging from 4.3 (G1, G7 and G9) to 5.5 (G5), with a national mean of 4.3.
Soil organic matter subsequent (SOC, TN and C/N ratio) had national mean values of 2.34%, 0.22% and 13.13, respectively. The topsoil SOC contents ranged from 1.76 (G6) to 3.45% (G7). The SOC amounts in G3 and G7 provinces were significantly different than others, except between G4 and G9. According to TN contents variation, a significant difference was only observed between, G2, G6 and G9 (P < 0.05), with values ranging from 0.17 (G2) to 0.50% (G6). A strong significant difference (P < 0.001) in C/N ratio values was observed between G1, G2, G3 and G4, compared to others. The recorded values ranged from 11.53 (G1) to 14.18 (G2) for C/N.
Soil nutrients, such as exchangeable bases (Ca2+, Mg2+ and K+) and available phosphorus exhibited a different dynamic at national scale (Table 3(b)). Topsoil
Table 3. (a): Soil descriptive statistical parameters of different provinces of Gabon; (b): Soil chemical descriptive statistical parameters of different provinces of Gabon.
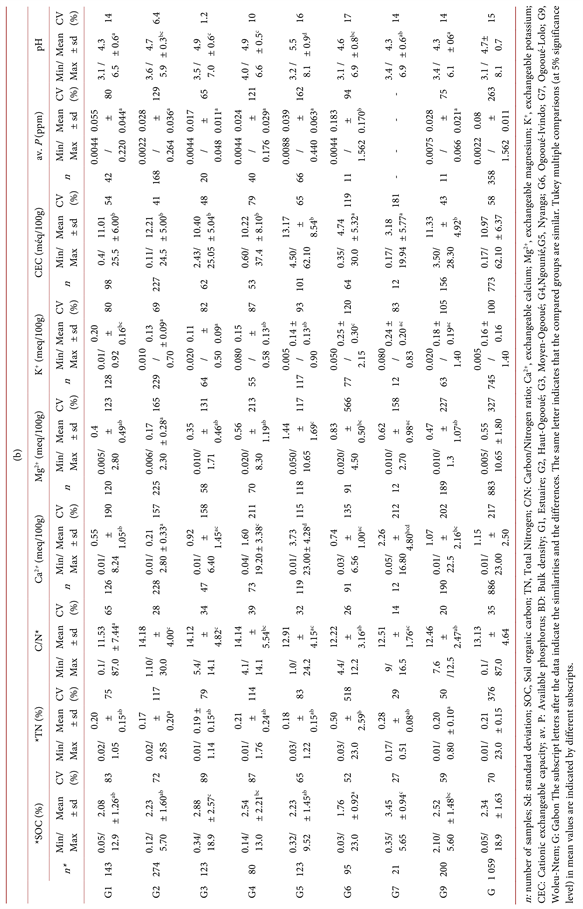
exchangeable Ca2+ contents had a wide variation with ranges of 0.21 (G2) to 3.73 meq/100 g soil (G5), with a national mean value of 1.15 meq/100 g soil. The contents recorded in G5 were significantly highest (P < 0.001) than others, excepted for G7. A moderate variation was observed for the exchangeable Mg2+ amounts. The significant highest content was again observed in G5 compared than others (P < 0.01), except for G6 and G7. The Mg2+ mean values ranged between from 0.17 (G2) and 1.44 meq/100g soil (G5). For exchangeable K+ dynamic, a slight variation, ranging from 0.11 meq/100g soil (G3) and 0.25 meq/100g soil (G6) with a significant difference, was observed between G6, G2, G3, G4 and G5. In other hand, CEC varied widely between 3.18 (G7) and 13.17 (G5). The contents, recorded in G7 (P < 0.01) and G6 (P < 0.001), were significantly lower compared to the other provinces. The national mean value of CEC was 10.97 meq/100g soil. The topsoil av. P amounts were up to 2 ppm, ranging from 0.17 to 1.82 ppm. G6 topsoil content was significantly higher than others (P < 0.001).
3.3. Interrelationships between Soil Indicator Properties
The linear regression (R), Pearson’s correlation coefficient (r) and ANOVA (at P-value < 0.05) were investigated to highlight the relationships between the different indicators. As there was no major variation in silt fraction for all the samples and no data for av. P for G7, these two parameters were not taken into account. Figure 3 presents the interrelationships of selected parameters used to assess soil quality indices. BD had moderate and strong negative correlations with SOC (r = −0.75, R2 = 0.56, P = 0.034) and clay (r = −0.80, R2 = 0.64, P = 0.017) respectively, while a moderate and positive correlation was observed with sand (r = 0.72, R2 = 0.52, P = 0.045). The same trend was observed with exchangeable K+, which showed a moderate to high correlation with C/N ratio (r = −0.72, R2 = 0.59, P = 0.027) and CEC (r = −0.81, R2 = 0.65, P = 0.015). The topsoil CEC showed a moderate to high negative correlation with TN (r = −0.76, R2 = 0.58, P = 0.028). In addition, TN and exchangeable K+ were moderately correlated (r = −0.81, R2 = 0.65, P = 0.015). Moreover, exchangeable Ca2+ and Mg2+ presented a significant close correlation between them (r = −0.85, R2 = 0.73, P < 0.01).
Although there was no significant correlation (at p < 0.05) between any parameters, on the one hand, pH had a weak to moderate positive correlation with CEC (r = 0.47, R2 = 0.22, P = 0.24), C/N ratio (r = 0.49, R2 = 0.24, P = 0.21), exchangeable Ca2+ (r = 0.60, R2 = 0.36, P = 0.11) and Mg2+ (r = 0.63, R2 = 0.40, P = 0.094). On the other hand, a negative correlation was observed with exchangeable K+ (r = −0.61, R2 = 0.37, P = 0.11).
3.4. Indicators Selection for MDS
From the results of PCA, all the soil indicators of different regions were grouped into different components (Table 4). Pearson’s correlation analysis was used to highlight the relationship between them and to reduce the redundancy (Figure 3). As presented in Table 4, PCA results showed the first three PCs with eigenvalues > 1, ranging between 2 and 4 explaining at least 10% of data variation. These latter accounted for 83% of the total variation and were used for MDS. Moreover, communality values for soil properties showed that the three PCs explained more than 60% of the variation in SOC and C/N ratio, more than 70% of the variation in the sand and TN, more than 80% of the variation in CEC, clay and pH, more than 90% of the variation in exchangeable bases (Ca2+, Mg2+ and K+) and BD. Thus, these highest communality values indicated a strong relationship between soil indicators and were considered to be important variables for soil quality assessment [77] [115] .
In PC1, which explained 36% of the total variation, exchangeable K+, TN, CEC and pH were considered as highly weighted PCA indicators, according to their absolute factor loading values ≥ 0.50. BD was excluded in PC1 due to its higher loading value (0.709) in PC2. As exchangeable K+ had the highest norm value (1.903), on the one hand, it was correlated with pH (r = −0.55, P > 0.05) and clay pH (r = 0.53, P > 0.05) and, on the other hand, significantly correlated with TN and CEC (r =−0.81, 0.76, P < 0.05), thus it was selected in MDS. In PC2, the C/N ratio, SOC, BD and sand showed absolute factor loading values ≥ 0.50. BD had the highest norm value (1.837) and was significantly correlated with SOC and sand (r = −0.75, 0.72, P < 0.05). Thereby, it was chosen in MDS. However, the C/N ratio was not correlated with the other parameters. In consequence, it was kept in MDS. In PC3, exchangeable Mg2+ had a higher absolute value than Ca2+ and both were closely and significantly correlated. Therefore, it was retained in MDS. Finally, exchangeable bases K+ and Mg2+, BD and C/N ratio were selected in MDS.
![]()
Figure 3. Results of Pearson’s correlations between soil indicators. C/N: Carbon/Nitrogen ratio; Ca2+, exchangeable calcium; K+, exchangeable potassium; Mg2+, exchangeable magnesium; CEC: Cationic exchangeable capacity; BD: Bulk density; Mg2+, exchangeable magnesium; SOC, Soil organic carbon; TN, Total nitrogen. *: P < 0.05; **: P < 0.01.
![]()
Table 4. Results of principal component analysis (PCA) for soil quality indicators in the studied provinces.
TDS, Total data set; MDS, Minimum data set; PC, Principal component; Norm, Norm value; Com, Communality value; SOC, Soil organic carbon; SON, Soil organic Nitrogen; C/N: Carbon/Nitrogen ratio; Ca2+, exchangeable calcium; Mg2+, exchangeable magnesium; K+, exchangeable potassium; CEC: Cationic exchangeable capacity; av. P, Available phosphorus; BD: Bulk density. Bold face factor loading is considered high weighted. Bold and underlined face factor loading is selected as MDS.
3.5. Soil Quality Assessment
3.5.1. Soil Quality Based on the TDS Approach
Table 5 shows the results of soil quality indices obtained by the four models (AQI, WQIadd, WQIcom and NQI). The SQIs values ranged from 0.34 to 0.50 for AQI, from 0.35 to 0.50 for WQIadd, from 0.37 to 0.43 for WQIcom and from 0.27 to 0.31 for NQI. According to SQ grades, WQIcom and NQI highlighted a very low soil quality in the whole country, while the low quality was only observed in G7 using AQI and WQIadd models (Figure 4). The interrelationships between all models were assessed using multivariate correlations (Figure 5). A close and significant correlation (r = 0.99, R2 = 0.98, P < 0.01) was observed between AQI and WQIadd, NQI and WQIcom were highly correlated between them (r = 0.83, R2 = 0.68, P = 0.012), but weakly correlated with the latter.
3.5.2. Soil Quality Based on the MDS Approach
According to soil indicators and the PCA, four selected the MDS indicators, such as exchangeable bases Mg2+and K+, C/N ratio and BD, were scored to assess AQI, WQI and NQI soil quality. The results showed that the SQIs values ranged from 0.36 to 0.55 for AQI and WQIadd, from 0.36 to 0.45 for WQIcom and from 0.20 to .0.29 (Table 5). Regarding the four models, 50% of studied regions (G1, G2, G3 and G4) presented a low soil quality (Q4), whereas 25% were both medium (Q3: G5 and G9) and high quality (Q2: G6 and G7) using AQI (Figure 4). Under WQIadd model, 75% were very low and the others (G6 and G7) were of medium quality. According to WQIcom, all the regions were in low quality ranges. Concerning the NQI model, it revealed that 63%, 25% and 12% were respectively of low (G1, G2, G4, G6 and G9), medium (G3, and G5) and high (G7) quality. According to the above, regardless of the used model, G7 province had a better soil quality than the others.
The correlation between the models showed the same trend as the TDS approach. A perfect and significant correlation was recorded with AQI and WQIadd (r = 1, R2 = 1, P < 0.01). Moreover, WQIcom and NQI models showed a close and significant correlation (r = 0.97, R2 = 0.93, P < 0.01) (Figure 5).
![]()
Table 5. Soil quality indices and grades of using different models into TDS and MDS approaches of provinces of Gabon.
TDS, Total data set; MDS, Minimum data set; AQI, Additive quality index; WQIadd, Weighted Additive quality index; WQIcom, Weighted communality quality index; NQI, Nemero quality index; SQI, Soil quality indice; SG, Soil grade; G1, Estuaire; G2, Haut-Ogooué; G3, Moyen-Ogooué; G4: Ngounié; G5, Nyganga; G6, Ogooué-Ivindo; G7, Ogooué-Lolo; G9, Woleu-Ntem; Q5, Very low quality; Q4, Low quality; Q3, Medium quality; Q2, High quality.
![]()
Figure 4. Spatial variability of soilquality grades evaluated by TDS and MDS approaches into AQI, WQIadd, WQIcom and NQI indices. VL, Very low (Q1); L, Low (Q2); M, Medium(Q1); H, High (Q4); VH, Very high (Q5).
![]()
Figure 5. Multivariate correrlations between AQI, WQIadd, WQIcom and NQI indices into TDS and MDS approaches. r, Pearson’s correlation coefficient; R, Linear regression coefficient ; P, P-value.
![]()
Figure 6. The linear relationships between AQI, WQIadd, WQIcom and NQI values (n = 8).
![]()
Table 6. Sensitive index according to SQI models for TDS and MDS approaches.
TDS, Total data set; MDS, Minimum data set; AQI, Additive quality index; WQIadd, Weighted Additive quality index; WQIcom, Weighted communality quality index; NQI, Nemero quality index; SQI, Min, Minimum; Max, Maximum; SI, Sensitive index.
3.5.3. Comparison of Soil Quality TDS and MDS Approaches
The linear regression coefficients (R2) between TDS and MDS varied from 0.17 to 0.82 and were arranged as follows: WQIadd > AQI > NQI > WQIcom (Figure 6). Furthermore, the results of ANOVA showed the same trend regarding significant correlation (Figure 5). There were strong and significant correlations between the TDS and MDS approaches into WQIadd (r = 0.91, P < 0.01), AQI (r = 0.86, P < 0.01), NQI (r = 0.80, P = 0.016) models.
Moreover, the comparison of SQIs calculated, using different approaches and models, showed a strong and significant correlation between AQI-TDS and WQIadd-MDS (r = 0.86, R2 = 0.74, P < 0.01), and between WQIadd-TDS and AQI-MDS (r = 0.91, R2 = 0.82, P < 0.01). While NQI and WQIcom models were only correlated respectively into the TDS and MDS approaches (r = 0.79, R2 = 0.62, P = 0.021) (Figure 5). These results suggest that AQI and WQIadd are better models than WQIcom and NQI. Ultimately, MDS gave a relative higher SI value compared to the TDS (Table 6). These latter were ordered as follows: AQI-MDS = WQI-MDSadd (1.53) > WQIadd-TDS (1.46) > AQI-TDS (1.45) > NQI-MDS (1.40) > WQIcom-TDS (1.27) > NQI-TDS (1.24) > WQI-TDS (1.17). According to the TDS and MDS correlation in the model, WQIadd is found to be a better model than AQI, with a weak loss of information.
4. Discussion
Our data processing of physical and chemical soil properties shed light on parameters to be used in statistical approaches. Further comparison of the approaches then allowed the discrimination of data to be used in future researches dedicated to Ferralitic soil quality.
4.1. Soil Quality Grades According to the TDS Approach
Based on the TDS approach, all the regions presented a very low quality grade (Q5) when applying WQIcom and NQI. However, although the Q5 grade was predominant (87.5%) with AQI and WQIadd models, the low grade (Q4) was observed only in G7 (Figure 4). The results obtained with the multiple correlations, between AQI and WQIadd (r = 0.99; R2 = 0.98; P < 0.01), on the one hand, and between NQI and WQIcom (r = 0.83; R2 = 0.68; P = 0.012) on the other hand, showed a similar distribution in the spatial distribution of soil grades (Figure 5 and Figure 6). The finding was consistent with previous works [19] [22] [74] [81] [100] . However, [22] found a high correlation between all models. According to TDS-SQI grades, all provinces presented soils with the most severe restrictions for plants [75] [85] [95] . The results were in agreement with soil physico-chemical parameter status (Table 3). In general, they were classified between very low to low [49] [116] [117] .
4.2. Soil Quality Grades According to the MDS Approach
In our study, BD, Mg2+, K+ and C/N ratios were retained in MDS. The result was consistent with the literature, which showed that the assessment of soil quality requires both physical and chemical properties [77] [82] [108] . BD is an important physical parameter, which controls soil porosity and root growth. It has often been used as a physical indicator of soil quality [74] [78] [81] [83] [95] Soil BD is a sensitive indicator of soil compaction, and its value is closely related to soil texture, structure, compactness and organic matter content [99] . BD recorded values in this study (<1.5 g∙cm−3) were in accordance with values of literature and characterized a structure allowing proper air and water movements and root growth [118] [119] [120] . Exchangeable Mg2+ and K+ are also widely used as indicators in MDS [75] [77] [79] [95] [101] [112] . They can reflect soil fertility quality because they are essential and vital nutrients for plant growth and crop production [21] [79] . In Gabon, topsoil mean contents of K+ (0.16 meq/100g soil) and Mg2+ (0.55 meq/100g soil) were low and similar to those obtained in the other studies [49] [116] [119] . C/N ratio was included in MDS by [81] [106] . It reflects the availability of N relative to C and thus microbial activity [81] [121] . C/N ratios recorded (<15) reflect the rapid mineralization of N for immediate plant use [122] [123] .
The findings showed that the severe restrictions for plant growth (Q4) were predominant, but decreased from WQIcom (100%) to AQI (50%). On the other hand, using NQI and AQI models, respectively 12.5% and 25% of soils were suitable for plant growth (Q2) whereas, with WQIadd, Q3 (37.5%) was the best soil quality grade observed, suggesting moderate value along with some limitations for plant growth [75] [85] [95] (Figure 4). As mentioned in the TDS approach, AQI and WQIadd were closely correlated (r = 1; R2 = 1; P < 0.01). The same trend was observed with NQI and WQIcom, which were strongly correlated (r = 0.97; R2 = 0.93; P < 0.01). This result proves that AQI and WQIadd, on the one hand, and NQI and WQIcom, on the other hand, show with high accuracy the similarity between the models.
4.3. Soil Quality Approach and Model Validation
In this study, the MDS approach gave the highest soil quality score. Indeed, Q5 (87.5% - 100%) was the predominant soil grade in TDS, whereas it was Q4 (50% - 100%) in MDS (Figure 4). Previous works mentioned that TDS can produce more comprehensive results and certainly some important soil quality information could be lost during PCA analysis in the MDS approach [95] [106] . However, it is commonly accepted that the MDS approach is a tool for data reduction and is widely used in the assessment of soil quality [2] [74] [79] [100] [101] [107] . Moreover, a better soil quality grade was obtained using the MDS approach, which was consistent with previous studies [22] [95] . This finding is in agreement with the SI index, where the MDS values were relatively higher than TDS (Table 6). In consequence, the MDS approach indicates better accuracy than TDS [124] .
Although, the perfect matching between AQI and WQIadd was observed (Figure 6) and had the same accuracy (SI = 1.53, Table 6), a strong relationship was recorded between the TDS and MDS approaches into WQIadd (r = 0.91; R2 = 0.82; P < 0.01) than AQI (r = 0.86; R2 = 0.74; P < 0.01) and NQI (r = 0.80; R2 = 0.65; P = 0.016). This result indicates that MDS represented more accurately TDS when WQIadd was applied. The finding was in consistence with previous studies, which found higher accuracy with WQIadd than AQI and NQI [22] [74] [112] . On the one hand, according to [22] and [85] , this trend could be explained by the use of indicators weights. Indeed, each soil indicator was independently differentiated by its weight and the highly weighted soil properties are considered as key factors. Contrary to AQI and NQI models, which are respectively based on extreme values and lowest score of soil indicators, without considering their weights [78] [85] . On the other hand, [19] and [81] showed that WQIadd is more accurate than AQI and NQI models. Accordingly, WQIadd was found to be the best model for assessing soil quality in our study.
4.4. Soil Quality Status and Implication
Soil quality in Gabon varies from low to medium quality, according to the WQIadd-MDS index. This trend is in accordance with [39] , who have shown that the country has an agro-ecological zone ranging from poor to medium, despite the presence of luxurious rainforest. Moreover, the soil quality is closely correlated with inherent factors, such as soil parent material and climate [39] [43] [44] [52] . With 1% of arable land [39] combined with anthropogenic pressure due to the revival of the agricultural sector, the monitoring and management of these soils remain vital so that they provide their ecosystem services. Recent work reported how those inherently nutrient-poor soils under savannah, spanning over 6 million hectares in Central Africa from Gabon (majority in G2) through Congo-Brazzaville to Congo-Kinshasa, may be improved through sustainable management [52] .
In the pedoclimatic context of Gabon, the assessment of soil quality is, on the one hand, a good tool to assess management-induced changes in the soil and to link existing resource concerns to environmentally sound land sustainable practices [125] . On the other hand, it provides information over a long period [5] [31] . As reported in the literature, agricultural activities are the principal factors of degradation of 60% of the soil ecosystem services [73] [126] [127] . Moreover, soil quality is often related to soil degradation, which can be defined as the time rate of change in soil quality [125] . Therefore, the assessment of soil quality will allow monitoring of soil status and the introduction of sustainable agricultural practices, such as the use of nitrogen-fixing species and cover plants, the soil recarbonization with application of organic fertilizers, the responsible consumption of water and chemical fertilizers, and the promotion of agroforestry systems. These sustainable practices will enhance soil health by promoting soil biodiversity, improving SOC and nutrient pools and preventing their degradation [31] [52] [128] .
5. Conclusions
The aim of this study was to assess soil quality through minimum soil indicators, which are more sensitive to Gabonese’s Ferralitic soil context, and to identify the best model to follow temporal changes in soil quality. Thus, eleven among thirteen soil indicators used, extracted from OSTROM’s reports, were selected and investigated in PCA. According to the findings, K+, Mg2+, BD, and C/N ratios were retained as the MDS soil indicators. In consequence, the results indicate that the MDS soil indicators, associated with the physical (BD), chemical (K+ and Mg2+) and biological (C/N ratio: microbial activity) soil parameters, are more sensitive to the pedoclimatic context and therefore affect the health of Gabonese soils.
Based on the TDS approach, the results of the assessment of soil quality have shown that the very low-quality grade (Q5) was obtained countrywide with both methods WQIcom and NQI. While just over 12% low soil quality (Q4 grade) is observed using AQI and WQIadd methods. In contrast, although Q4 grade was by far the main soil grade status, no less than 50% whatever the model in the MDS approach, 12.5% (G7) and 25% (G6 and G7) had a high soil quality (Q2), identified as suitable soils for plant growth respectively applying NQI and AQI models. Although both AQI and WQIadd had a similar SI value, WQIadd was chosen as a sensitive soil quality method to the pedoclimatic context. Thereby, the study highlights a variation of soil quality in the countrywide. It indicates that the SQI based on the MDS method could be a useful tool to comprehensively assess soil quality in Gabon. On the one hand, soil quality assessment is a good tool to track soil temporal changes in Congo Basin soils and to improve their use and sustainable management. On the other hand, SQI can be viewed as a primary indicator for soil sustainable management in the region.
The findings of this article provide an inventory of the quality of the current Gabonese soils 40 years ago. Thus, more data are now needed to achieve current quality of soils and thus to estimate the impact of climate and soil management changes over the past 40 years. Consequently, this study indicates that multivariate methodologies could be a useful tool to comprehensively assess soil quality in the Congo Basin’s forest systems. In addition, the use of soil quality indices, through soil indicators more sensitive to pedoclimatic context or land use, is a good strategy for long-term monitoring of soil quality within the Congo Basin and above all to improve their health.
Credit Author Statement
N.Y Musadji: Collection data, Data processing, Writing-Original draft preparation; R. G. Mabicka Obame: Collection data, Data processing, Writing-Original draft preparation; M. Mbina Mounguengui: Writing-Reviewing and Editing; L. S. Koutika: Conceptualization, Visualisation, Writing-Reviewing and Editing, Formal Analysis; E. Ravire: Reviewing and Editing; C. Geffroy-Rodier: Conceptualization, Visualisation, Writing-Reviewing and Editing, Formal Analysis.
Acknowledgments
The authors thank all the researchers who contributed by their work to the knowledge of soils of Gabon. We thankfully acknowledge to D. Martin, Y. Chatelin, J. Collinet, E Guichard G. Sala, A. Forget, M. Delhumeau, C. Marius and many others for their strong contributions in the characterization and establishment of soil maps of the numerous localities of Gabon. We thank Dr Arnaud Brice PAMBO-PAMBO for the reviewing and his knowledge on the SQI methodology.