Imaging and Dosimetric Consideration for Titanium Prosthesis Implanted within the Irradiated Region by Cobalt-60 Teletherapy Unit ()
1. Introduction
Radiotherapy is a treatment of cancer with ionizing radiations. Radiotherapy is classified into two main areas, namely: external beam radiation therapy (teletherapy); where the source of radiation is in remote from the patient’s region to be treated and brachytherapy; where radiation sources are placed directly or in close proximity to the target to be treated in the host. With reference to this, image-based radiation therapy has become the standard practice. Patient data are acquired with computed tomography (CT) scanners, and then exported or downloaded into the Treatment Planning System (TPS) for dose computation to obtain dose distribution within the treated region. Optimization of the radiation dose to the intended target is achieved with the TPS by selecting appropriate beam irradiation geometries and beam weightings [1] [2] .
This work focuses on titanium prostheses and their effects on CT imaging and radiation metrology. The best practice is to consider the dosimetric effects of this prosthetic implant in order to enhance the accuracy in the patient radiation dose delivered such that it meets the tolerance of ±3% (difference between measured and calculated dose) as recommended by International Commission on Radiation Units & Measurements (ICRU) for regions implanted with prostheses [3] [4] .
2. Methods and Materials
2.1. Materials
The materials used in this study include the following: Equinox 100 Cobalt-60 teletherapy machine (Best Theratronics), locally designed (fabricated) water phantom to represent the pelvic region or trunk of an average adult human, ionization chambers, electrometers, barometer, digital thermometer, Titanium for commercial use (Grade 1; C: 0.01, Fe: 0.097, N: 0.014, O2: 0.099, H: 0.002, Total < 0.4) plates, CT scanners, tissue characterization phantom, Blue water phantom, Treatment Planning System (Prowess Panther Version 4.6) and RadiAnt DICOM Viewer software.
2.2. Water Phantoms
Plate 1 shows a pictorial view of the round phantom used for this study. The phantom was marked on the laterals and anterior with cross marks where lasers pass through during measurements on both CT scanner and teletherapy machines. Titanium plates of dimensions of 400 × 40 × 4 mm3 (length × breadth × width) were submerged in water for measurements.
Another full scatter blue water phantom of dimensions 480 × 480 × 410 mm3 was also used (Plate 2). This is a measuring device for the measurements and analysis of the radiation beam of medical linear accelerator which use Omni-Pro Accept software for analyzing the measured data. It consists of a 3D servo (the blue water phantom with mechanics), a common control unit (CCU) with integrated two-channel electrometer and two single detectors (ionization chambers).
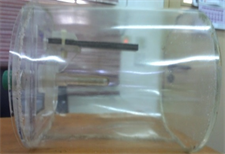
Plate 1. A pictorial view of the PMMA in-house built water phantom.
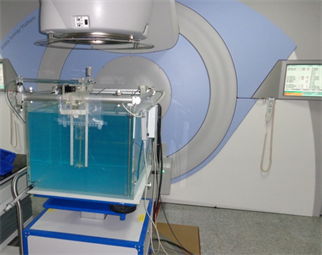
Plate 2. The blue water phantom setups under Elekta Synergy Platform gantry.
Basic dose distribution data are usually measured in a water phantom, and this closely approximates the radiation absorption and scattering properties of muscle and other soft tissues. In addition to that, the choice of water as a phantom material is that it is universally available with reproducible radiation properties. A well-constructed titanium holder was then mounted on the edge of the blue water phantom.
2.3. Scanning of Phantom
The tissue characterization phantom was scanned with both CT scanners. Prior to the scanning of the phantom it was insured that the phantom was positioned such that it was central to the aperture of the CT scanners. This was done with the help of internal patient alignment system (lasers) of the CT scanners and three indentation marks placed on the phantom. After scanning the phantom in each case, a titanium insert (Plate 3) was used to replace one of the inserts and the scan repeated. The positioning of the titanium insert was replaced with another insert such that the titanium insert was moved to the inner concentric ring and the scan was repeated. The change of position of the titanium insert within the phantom was to account the effect of the position of a material on its CT number [1] [5] . The bigger phantom was dismantled and the head phantom was removed. The above scanning procedure was repeated with head phantom. For the head phantom the position of the titanium on the outer concentric ring was replaced by another insert in the center of the phantom. Some scan parameters were used during the scanning of the tissue characterization phantom; 120 kVp for scans with the 6 slice CT scanner. For the scans the slice thickness was set at 2.5 mm for a CT scanner. After the scans, the CT image data sets of the phantoms were downloaded on to a CD-ROM.
2.4. Determination of CT Numbers
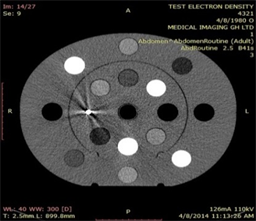
The CT image data sets on the CD-ROM were read with RadiAnt DICOM Viewer to determine the HU of the various inserts within the phantoms. A circular region of interest (ROI) with an area equal to one fourth the total cross-sectional area of an insert was created. For the titanium insert the ROI was smaller, this was because the titanium within the insert was very small as shown in Plate 4. The aim of a small size was to avoid many streak artifacts in the
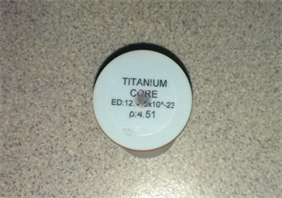
Plate 3. The Titanium insert, with a density (ρ) of 4.51 g/cm3 and electron density (ED) of 12.475 × 10²³ per cm3.
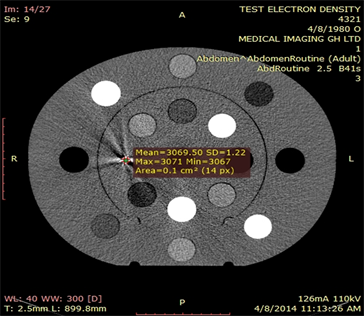
Plate 4. An approximated HU of titanium inset on a selected slice, abdomen scan routine.
image, which also causes high discrepancies on HU of other inserts. This ROI was used to measure HU of the insert such that the ROI was central to the insert during the measurement. These procedures were repeated for a number of successive slices per phantom. The mean HU values (HUm) of the region encompass by ROI was displayed and recorded. The average HUm for the same insert was determined regardless of its position and phantom type. The average HUm values determined were correlated against their respective electron densities inscribed on the surface of an insert. From this correlation CT number to relative electron density convention curves were shown for each individual CT scanner [5] .
A picture (Plate 4) showing the approximate Hounsfield Units above was obtained from the RadiAnt DICOM Viewer. For this particular slice, potential energy was 110 kVp and tube current of 126 mA. The mean CT number obtained was identified as 3069 with standard deviation of 1.22 and the region of interest was 14 pixels.
2.5. An In-House (Fabricated) Phantom Imaging
CT scanner was used to scan the locally fabricated water phantom which had a holder within it to hold different configurations of titanium plates in place. The holder was designed such that the position of the titanium plate from the surface of the phantom can be altered as shown in Plate 5. Before the CT scans were performed, the phantom was set up such that the laser passed through the cross markings on the phantom. Typical scanning parameter of 120 kVp and 130 kVp were used in standard scanning protocols for the 6 slice scanner. The slice thicknesses were set at 3 mm for both scanners. After the scan, CT image data with CT scanner were copied into the compact disk (CD) and imported into the
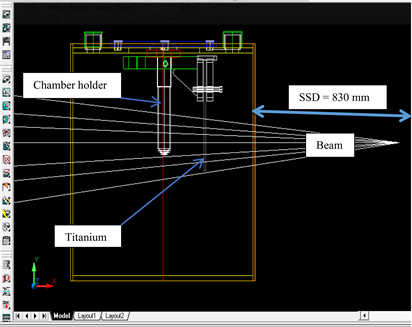
Plate 5. Experimental setup and simulation geometry for acquisition of depth dose data in water, with a titanium plate (ρ = 4.65 g/cm3), 4 mm thickness [6] .
Prowess Panther 4.6 treatment planning systems.
2.6. Dose Measurements in Round Phantom
Forward planning was done in both TPS with a prescribed dose of 2 Gy (200 cGy) normalized to center of the sensitive volume of the chamber inserted within the phantom. SAD treatment technique was employed using various field sizes (7 × 7 cm2, 10 × 10 cm2, and 15 × 15 cm2) and the treatment time was recorded for all irradiation geometries. The beam came from the left lateral side such that the direction of propagation of the beam was perpendicular to the titanium plate within the phantom (Plate 6).
3. Results and Discussions
3.1. Computed Tomography Images
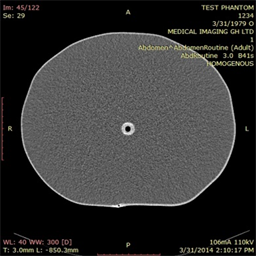
Axial images of the tissue characterization phantom scanned with SOMATOM Emotion CT scanner, during the CT calibration, are shown in Plate 7. Plate 8 shows transverse images of the phantom scanned with and without titanium insert in the phantom. The image with titanium insert is affected by streak artifacts due to high variation in density between the metal and the other materials in close proximity to the metal. The metal attenuates most of the X-rays through photoelectric effect as a result of the energy of the beam used for the CT scan. The intensity of the X-rays after passing through the metal is very low, which will make transmitted X-rays from neighbouring materials low than they are truly supposed. Materials in the neighbourhood of the metal may have densities or HU far low than normal. With reference to the above, it is therefore imperative to obtain the HUs of the various inserts without the titanium insert. The scan with the titanium insert was only used to determine HU of the titanium. The CT numbers were recorded in Table 1 for comparisons. The effect (streak artifacts) was found to improve with certain scan parameters such as increase in kVp and beam filtration applied in the CT scanner. These were in consonance with studies done by other researchers [5] .
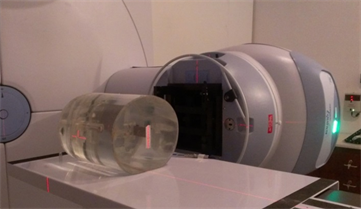
Plate 6. The round phantom orientation on the couch during measurement of TPS planned doses, with vertical and horizontal lasers and 60Co gantry at 90˚.
 (a)
(a) 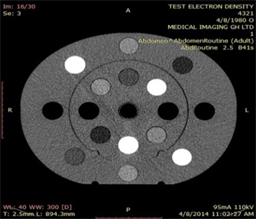
(b)
Plate 7. Axial view of a tissue characterization phantom, (a) without and (b) with titanium insert surrounded by streak artifacts.
 (a)
(a) 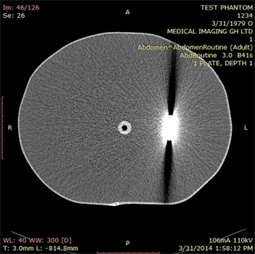
(b)
(c)
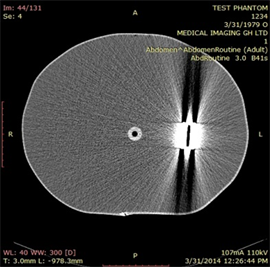
Plate 8. Axial images of a fabricated water phantom showing (a) homogeneous (left), (b) 4 mm titanium (centre) and (c) hollow (air gap) metal (right) scans.
![]()
Table 1. Comparison between CT numbers measured with tissue characterization phantom and those of CT number to rED conversion curves for Prowess Panther TPS for the requisite CT scanner.
3.2. Simulation of Effect of Prosthesis on Dose Distribution in Phantom Designed to Represent the Trunk or Pelvic Region with Cobalt-60 Beam
Relative dose measurements at depth of 17 cm in the fabricated phantom without the prosthesis are within ±3% of those calculated with the Prowess TPS for the selected field sizes for cobalt-60 beam. An air medium (hollow) created between the metal plates gave extra doses at the point of measurement. Calculated treatment time in the presence of hollow or air gap is more than the expected time needed for treatment, which may cause overdose to patients with prostheses. The measured doses compare to those calculated with the TPS increase as much as 6.5% for deep seated prosthesis. These results are shown in Figure 1. The effect is more pronounced with small field sizes. For smaller field sizes much of the radiation field is covered by the prosthesis and much of the radiation is attenuated. The TPS therefore exaggerates the attenuation offered by the prosthesis due to inherent deficiencies in the dose computation engine of the TPS or artifacts offsetting densities of the various materials constituting the phantom. This may also be as a result of enhancement of beam intensity and
![]()
Figure 1. Measured PDDs of FS = 200 × 200 mm2 superimposed for 4, 8 and 12 mm metal thicknesses irradiated with 60Co beam energy.
incorrectly interpolated CT values around the region of hollowness. Reft et al. (2003) mentioned that the vital physical properties that can influence dosimetry of a radiation beam are; hollowness, shape, size, and composition of the material [3] . Hollow metals have been found to create a lot of artifacts in their vicinity on CT images and this may introduce errors in the doses calculated by the treatment planning system when a radiation beam is allowed to pass through this region.
The results show that for smaller field size, 7 × 7 cm2, the doses measured by a detector at a given depth were enhanced less than doses at bigger field sizes. Thinner titanium plate (4 mm) attenuates less gamma rays than thicker plates. Shallow depth metal had less influence on the dose due to the fact that the streak artifacts are shallow and close to the surface, covering less medium area. The dose increase was between 1.1% and 4.5%. In the presence of artifacts, attenuation is inconsistent and the doses measured at a point have a tremendous increase. Therefore, there is a likely overdose to OAR’s located behind, in the region around the prosthetic material and in the beam perspective. Furthermore, the streak artifacts may obscure tumours as discussed by Shimozato et al. (2010) and OAR on the laterals of the metal, causing inappropriate control of cancer tumours during radiation therapy. The fact is that, artifacts caused by the presence of a metal in a volume scanned by an X-ray CT scanner may influence the CT numbers and eventually introduce errors in the dose distribution calculated [4] [7] [8] . It is a result of different CT numbers, more side scatter and forward scatter due to interactions of photons with a high dense material. Hence, convolution superposition calculation algorithm shows larger variations in simulation of dose distribution around the metal prosthesis in the presence of artifacts. Details on percentage deviations on measured dose to the calculated dose are shown in Table 2. Depth 1 is a depth of the detector from the distal surface of the metal when the metal holder fixed inside the phantom during measurements is at hole number 1 and it is approximately 7.0 cm. Depth 2 is a depth of the chamber from distal side of the plate when the holder is fixed at hole number 2 and it is approximately 11.3 cm. Plate 9 shows the distances when the metal holder is at depth 1 and 2.
After corrections for artifacts [9] , the dose distribution varied between −0.59% for a 7 × 7 cm2 and 0.31% for the 15 × 15 cm2 (within ±3% tolerance) within a homogeneous medium. Table 3 shows all calculated values obtained after artifacts are corrected in Prowess Panther TPS. For the air gap created between the metal plates, there is still a large increase in dose at a point. The change in dose
![]()
Table 2. Measured dose for a phantom BEFORE correction of artifacts on 60Co machine, and a calculated dose of 200 cGy.
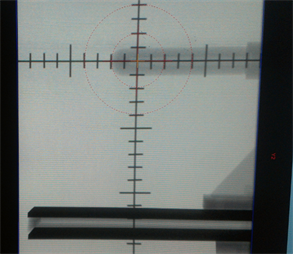
Plate 9. The scales showing distances between the detector holder and the metal plate.
![]()
Table 3. Measured dose for a phantom AFTER correction for artifacts on 60Co machine, and a calculated dose of 200 cGy.
at this point varied from 0.25% to 4.02% for all depths. Air gap acts as an enhancing medium for gamma rays energy passing through it. This reveals that there are multiple backscatters in the hollow as a result of photoelectric effect, Compton scatter and electron-positron pair production. The beam intensity attenuation increases as the metal thickness increases. The dose decrease at the isocentre, 17 cm deep, is 6.92% for 12 mm at shallow depth. Table 3 again shows all the deviations of measured dose to those calculated after the corrections for artifacts by Prowess Panther.
4. Discussion
Titanium CT number observed by scanning a tissue characterization phantom is approximately 3070 HU. The TPS used extrapolates titanium HU well and gives better simulation for doses around high-Z materials. Prowess could reduce relative dose variation to smaller extend but results could not really match with ±3% tolerance recommended by ICRU on measured and calculated doses. This is because the gray scale used for a clear viewing of metallic region boundaries to discriminate between water and metal does not give exact boundaries. Also, zooming these boundaries does not give a straight line due to pixels’ shapes.
Relative doses measured in the blue water phantom agree with that measured after metal artifacts corrections by the use of a treatment planning system. Increasing a metal thickness means increase in streak artifacts and dose variations at any point along the central axis of the beam. In most cases, percentage decreases for same energy on different field sizes are comparable at each depth. Also regions around metals show dark color, which indicated very low HUs during CT numbers measurements which causes dose distribution inconsistency along the penetrating beam. The boundary between metal and water was hardly recognizable in the CT images and, therefore, artifacts corrections are not really reproducible if metal thickness is unknown. Depth doses were affected by metal presence and thickness of the metal.