Solar Activity and Meteorological Fluctuations in West Africa: Temperatures and Pluviometry in Burkina Faso, 1970-2012 ()
1. Introduction
A few years ago, the way the sun was regarded has radically changed and there was a growing interest on SunEarth links, Sun-Earth problems, and Solar-Terrestrial Physics as a whole. Therefore the Sun-Earth study shows oneself so important for general science and the life on Earth as well. The discovery of solar wind, plasma flux constantly presents in the near Sun-Earth and interplanetary space helps improve now the investigations on SunEarth and solar activity variations. This heat radiation from the Sun is believed to be the primary factor of Earth climate conditions. Several studies have been made over the last decade on geomagnetic activities and weather variations (Delouis and Mayaud [1], Courtillot and Le Mouel [2]; Legrand and Simon [3], Simon and Legrand [4], Gonzalez et al. [5], Ouattara et al. [6], Zerbo et al. [7,8]) and local magnetic observations (Patel. [9], Courtillot and Le Mouel [10]).
Our present research endeavors to make us understand the natural links between solar activity, geomagnetic activity, and terrestrial weather phenomenon in a large context including Earth, Sun, throughout climatology studies in Burkina Faso, equatorial area in West Africa.
2. Data Sources and Data Analysis
Several data are used in our investigations: (1) Temperatures and pluviometric values taken from “Direction Générale de Météorologie du Burkina Faso (1970-2012)”; (2) sunspot number (Rz) and the Polar Cap Index (PCI) from omni data set http://omniweb.gsfc.nasa.gov/form/dx1.html. Temperatures and pluviometry are used to show the time variation of climatic parameters. The PCI and the Rz are used to evaluate the global Joule heating and the solar cycle phases
3. Results and Discussion
Figures 1 and 2 show the profiles of variation of two climatic parameters, precipitations (P˚) and temperatures (T˚) superimposed with sunspot numbers (Rz) for the time interval 1970-2012. From the Figure 1 we can remark that the level of precipitations varies from with solar cycle and that the most important precipitations are recorded when sunspot numbers are lest significant. As to temperatures (Figure 2), it shows itself increasing
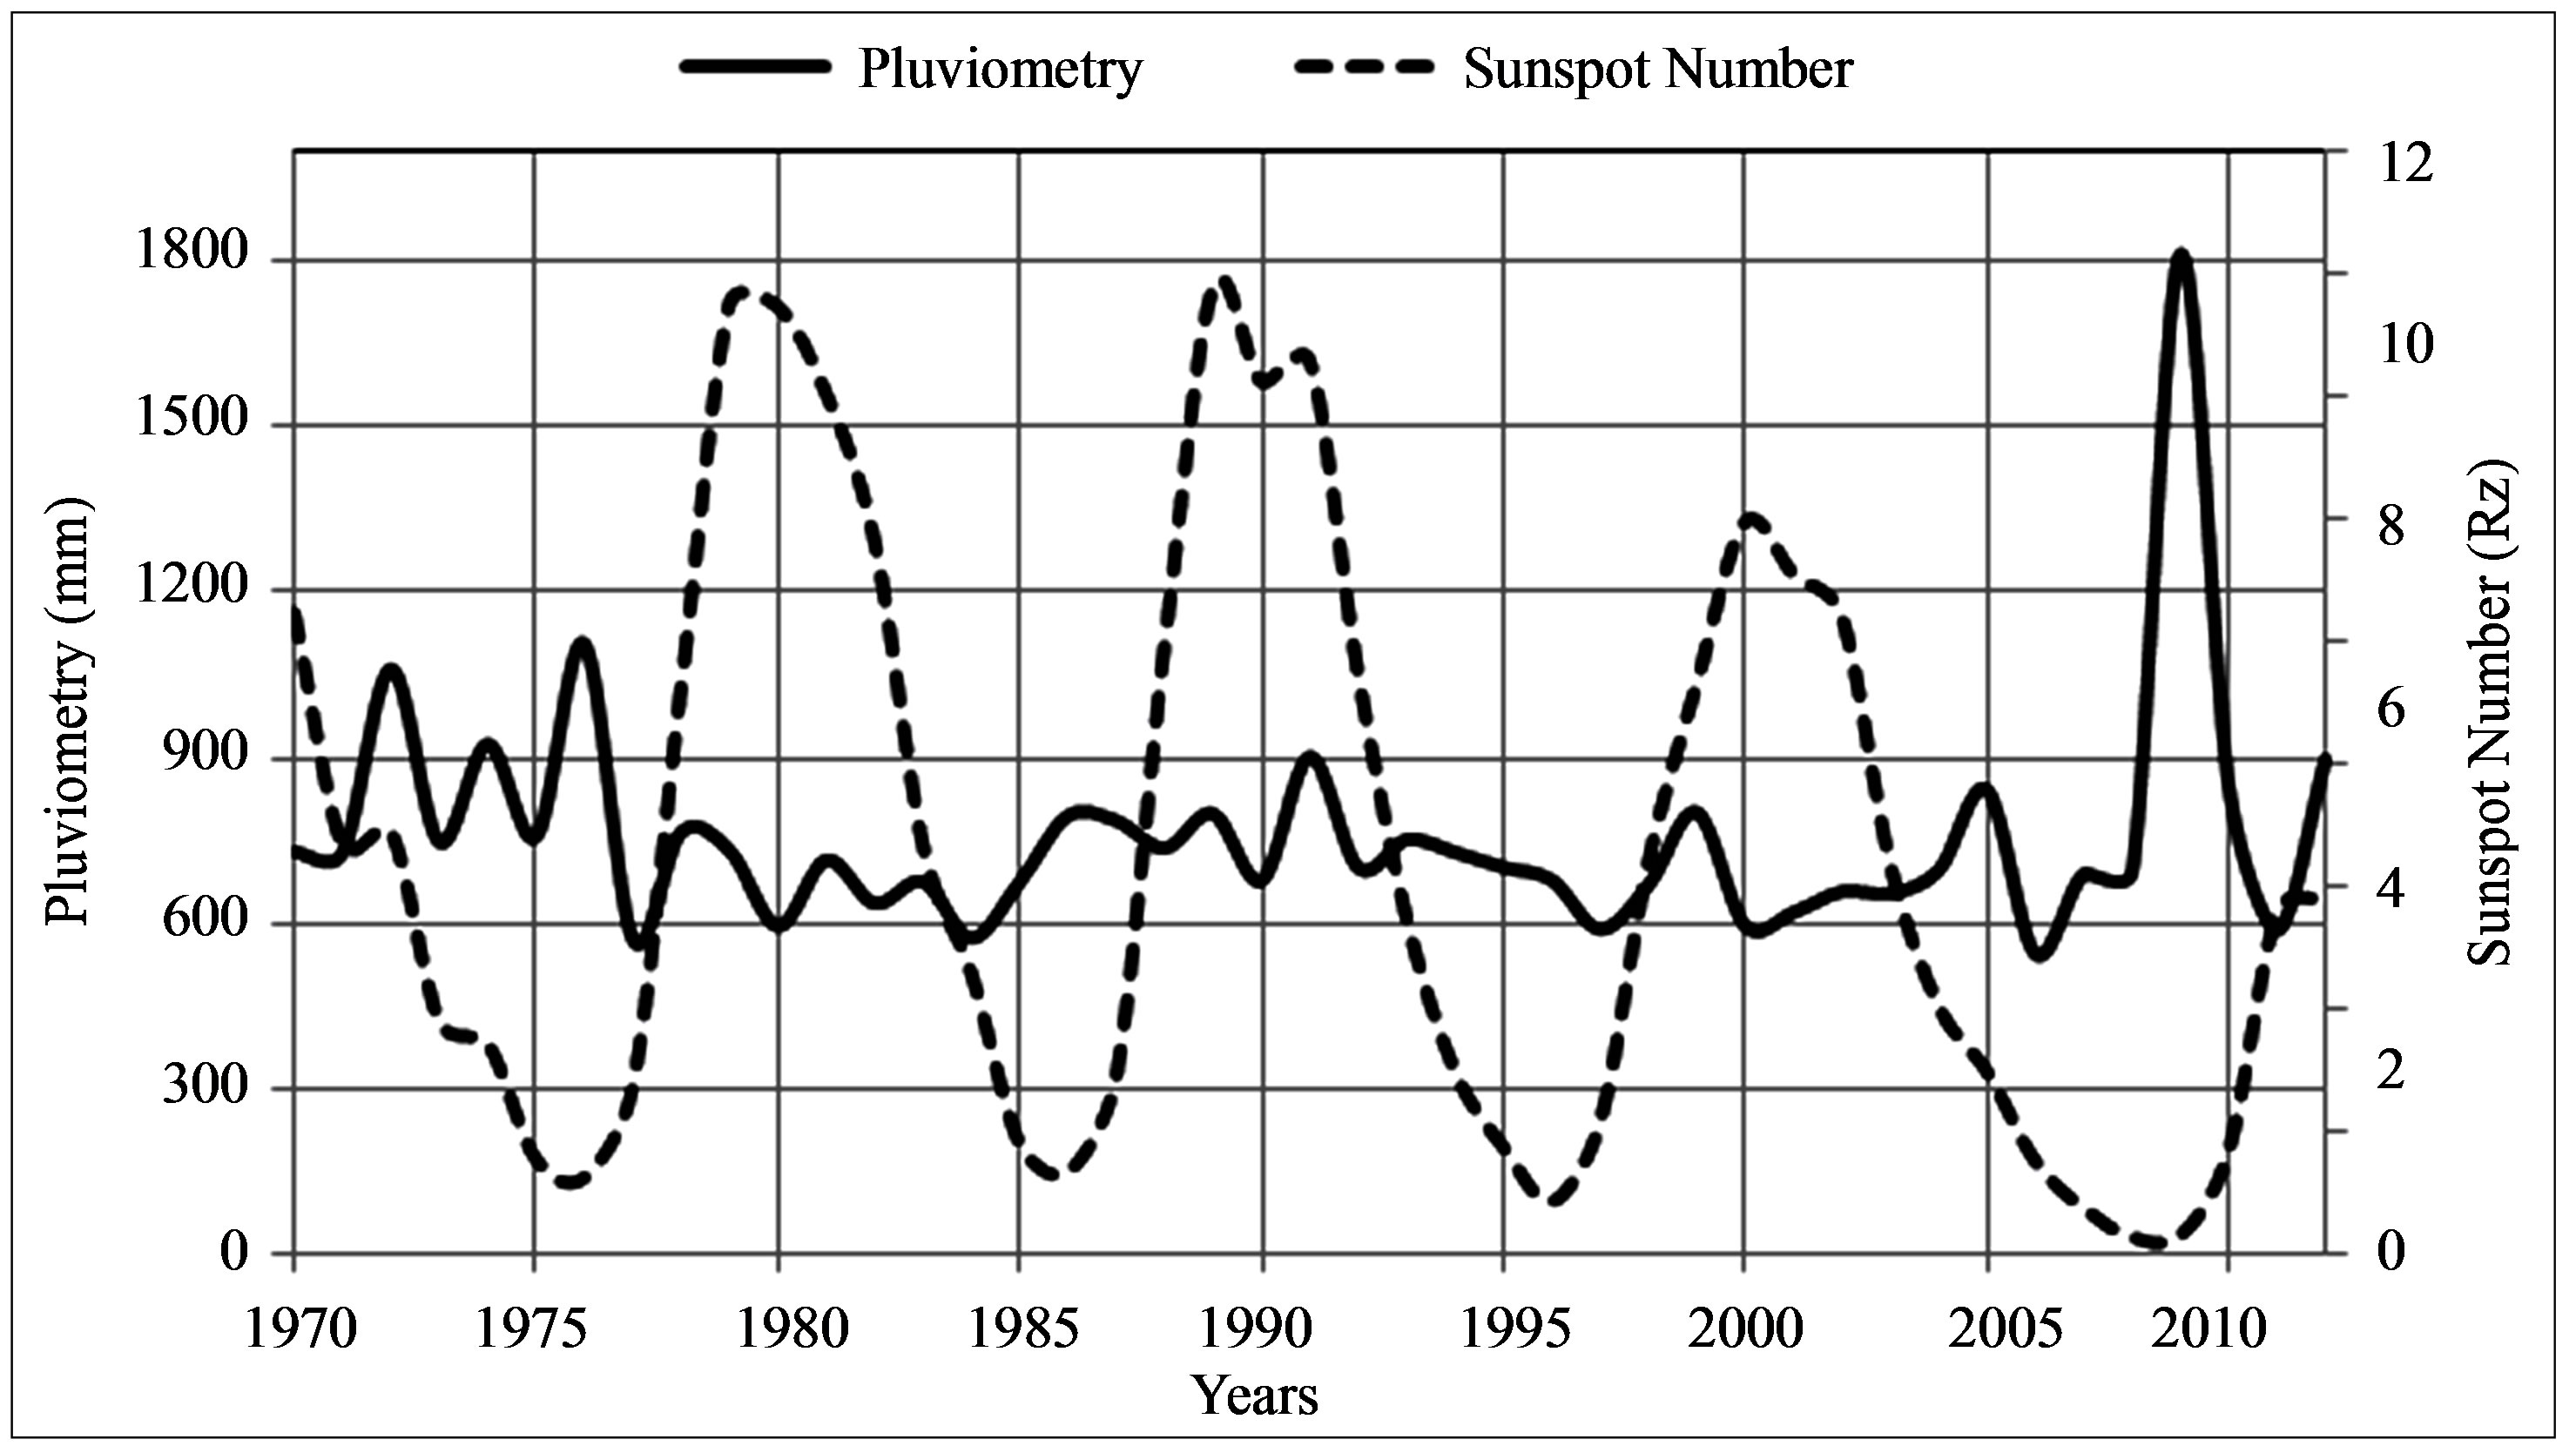
Figure 1. Time profiles of Pluviometry (P˚) and the Sunspot number (Rz), during the period 1970-2012.

Figure 2. Time profiles of Temperature (T˚) and the Sunspot number (Rz), during the period 1970-2012.
since 1970. Referring ourselves to previous works on solar and geomagnetic activities done by Lockwood et al. [11] and by Zerbo et al. [8], where it is showed that the interplanetary magnetic field (IMF) has doubled his intensity during this last century and that solar activity shows important gradual augmentation, we can presume the fact a link exists between solar activity and temperature variations as suggested by J. E. Solheim et al. [12]. Figure 3 superimposes sunspot numbers and polar cap index (PCI). We can remark that the peaks in PCI profile occur near the sunspot maximum and more frequently on the declining of solar cycle. We can assume that the peaks observed in PC index are closely linked with rapid solar wind streams from the coronal holes and CMEs characteristics of these two solar cycle phases. Placing now our study in the context of solar cycle phases (Minimum, Increasing, Maximum, and Decreasing) and geomagnetic classification proposed by Zerbo et al. [7], we made interesting analysis:
1) During Minimum phase where Quiet activity (QA) is predominant [6-8], precipitations increase (Figure 1) and temperatures decreases (Figure 2). This phase is characterized by slow solar wind speed and high density of solar plasma 2) During Maximum phase where Shock Activity (SA) is predominant [6-8], precipitations increase (Figure 1) and temperatures fluctuates (Figure 2). Here Coronal mass ejections (CMEs) are the most important solar events with important energy dissipated in interplanetary medium modifying atmospheric circulation and chemistry (overpressure or depression).
3) During Increasing/Decreasing phase where Recurrent Activity (RA) is predominant, precipitations decrease (Figure 1) and temperatures increases (Figure 2). These periods are characterized by high stream solar wind speed flowing from coronal holes [6-8] and the

Figure 3. Time profiles of Polar Cap Index and the Sunspot number (Rz), during the period 1970-2012.
most disturbed magnetic field with important solar dynamo and joule effect.
All that implies that there is no zero climate response to the non constant energy receive from sun (G. Tsiropoula [13]). The possible mechanisms which can explain the sun-climate link is the link cosmic ray and cloud cover investigate by Peter L. [14] and the sun dynamo which effect local temperature (C. de Jager [15]). We can schematize the mechanism as followed: active sun induces lest cloud cover and quiet sun important cloud cover and agree with the precipitations and temperatures profiles plotted in Figures 1 and 2.
4. Conclusion
Interesting correlations are found between solar fluctuations and the two climatic parameters (P˚, T˚) investigated in our study. Mean to our results we can assume that active solar is associated with weak incident cosmic ray consequently with low cloudiness which brings warming. Likewise, quiet solar is associated with important cloud cover and consequently brings important precipitations and chills terrestrial atmosphere. Thus, natural link exists between solar activity and climatic parameters even if it is not the only cause of climate global warming.
5. Acknowledgements
We are obliged to the anonymous referees with help to improve science. Special thanks to Direction Générale de Météorologie in Burkina Faso, and Omni wed data base for providing data. Thanks a lot to IJAA editors.
NOTES