Organically-Expanded Graphite/Octadecylamine: Structural, Thermal and Relaxation Evaluation ()
1. Introduction
Due to the intrinsic properties, many synthetic and natural fillers, both modified and unmodified, are employed alone or in micro and nanocomposites. Silica is one of the most used. Hybrid materials containing different amounts of Aerosil® were studied by Tavares et al. [1] to investigate relationship among silica content, molecular structure and intermolecular interactions. Sol-gel silica was synthesized through hydrolysis and condensation of tetraethyl orthosilicate (TEOS) for use in dental composites [2]. Different biopolymer/filler systems were investigated and changes in the relaxation times were detected by proton-spin lattice relaxation [3]. Relaxometry study showed the influence of Viscogel® B8 and silica on relaxation times in poly (lactic acid) nanocomposites [4]. Lamellar α-zirconium phosphate was expanded with octadecylamine and incorporated in linear low density polyethylene (LLDPE) to produce nanocomposites [5]. Alphazirconium phosphate was synthesized by refluxing and added to poly (vinyl alcohol) to obtain nanocomposites [6]. Novel fire retardant material using α-zirconium phosphate was prepared [7]. An organic-inorganic hybrid layered zirconium phenylphosphate was prepared and used in a nanocomposite based on poly (ethylene terephthalate) [8].
Graphite is an abundant natural material. Its good electrical conductivity, thermal, chemical and mechanical properties attract research interest in it [9]. Hwang and collaborators [10] prepared supports for PtRu catalysts in direct methanol fuel cells using modified graphite carbon nanofibers. Electrocatalysts were produced by carbon nanotubes and graphite powder [11]. Electrode material for a vanadium redox flow battery was prepared by graphite felt with nanodispersed bismuth [12]. Selective determination of dopamine was performed through functionalizated-graphene modified graphite [13]. A graphite-epoxy composite was prepared for electrochemical immunosensing [14]. Expanded graphite was applied in the preparation of a nanocomposite based on styrene-butadiene rubber [15]. A graphite electrode modified by 8-hydroxiquinolines was used for determination of copper at trace levels [16]. An electrodeposited Pb-modified graphite strip electrode was developed as a trichloroethylene sensor [17].
In this work, organically-expanded graphite with octadecylamine was produced for use in extrinsically conducting polymer. Structural, thermal and relaxation evaluation are reported.
2. Experimental
2.1. Materials
Graphite powder was supplied by Nacional de Grafite Ltda. The oxidizing agent—sufuric acid (98%) and nitric acid (65%)—were supplied by Vetec. Octadecylamine was supplied by Spectrum.
2.2. Graphite Treatment
Natural graphite (NG) was modified in two steps. The first step was based on literature reports [18-20]. To remove the moisture before treatment, the graphite powder was dried at 80˚C for 12 hours. A sulphonitric solution (sulfuric and nitric acid mixture, 4:1 v/v) was added to the graphite powder. The suspension was sonicated and stirred at room temperature for 5 hours. In this process, the graphite acid mixture (AM-G) was obtained. After that, the suspended powder was filtered and washed with deionized water until pH 5.5 and dried at 80˚C for 12 hours.
The second step consisted of octadecylamine (ODA) functionalization. AM-G was added in a 70/30 v/v alcohol solution and the suspension was maintained without stirring for 24 hours. After that, the suspension was stirring for 24 hours and then filtered and washed with ethanol for removal of non-reacted octadecylamine and dried at 80˚C for 12 hours to obtain ODA-AM-G.
2.3. Thermal Analysis
The thermogravimetric analysis was performed with a TGA 92 SETARAM under air atmosphere operating in the range of 30˚C - 700˚C at a heating rate of 10˚C/min.
2.4. Morphological and Structural Evaluation
Scanning electron microscopy (SEM) was performed with a JEOL JSM 5610 LV microscope with 15 kV of voltage, with magnification up to 3000 times.
Wide-angle x-ray diffraction (WAXD) was carried out in a Brüker D8 Advance diffractometer, using CuKα radiation with 40 KV of voltage and current of 40 mA, with 2θ between 2˚ - 35˚.
FTIR spectroscopy was performed with a Thermo Nicolet Nexus Instrument. The samples were analyzed in a medium infrared region (4000 - 600 cm−1) using attenuated total reflectance (ATR) and using KBr disks, with resolution of 2 cm−1 and 640 scans.
2.5. Low-Field Nuclear Magnetic Resonance Relaxometry
The measurements of proton spin lattice relaxation time (T1H) in NG is not possible due this material have only carbon atoms in its composition. Thus, the acid mixture (AM) was analyzed as the starting point for comparison with the treated materials. So, the measurements of proton spin lattice relaxation time (T1H) in AM, AM-G and ODA-AM-G were carried in the frequency range between 50 kHz and 300 MHz using different techniques. The measurements of T1 above 9 MHz (23 MHz, 90 MHz and 300 MHz) were performed in two different devices with inversion-recovery pulse sequence (180˚- τ-90˚). The variation range of the waiting interval (τ between the pulses ranged of 0.1 to 10,000 ms and the interval between recycle applied to the end of the pulse sequence was 5 seconds. The devices were a Maran Ultra 23 and a 0.21 - 7.1 T variable magnetic field NMR spectrometer.
In turn, the measurements of T1 in the range of 50 KHz until 9 MHz were done at room temperature using a fast field cycling (FFC) device developed at the physics department of Instituto Superior Técnico, Portugal. In this type of relaxometry, the analyses were proceeded through the sequence of field cycles. In each cycle, the sample remained subjected to the BE field during a time τ. After the BE→ BD transition, a pulse of radiofrequency was applied to the sample in resonance with the Lamor detection frequency. The free induction decay was detected and the sample was left to relax to equilibrium for a stabilization time at a T1 value five times longer. The cycle time was always greater than the stabilization time. The initial amplitude of the free induction decay signal was proportional to the magnetization Mz (τ). The Mz (τ) decay can in general be multi-exponential, with different relaxation times. All measurements were done according to the work developed by Sousa and collaborators [21] and Preto and collaborators [22].
3. Results
The results provided by SEM, FT-IR, WAXD, TG and LFNMR are discussed hereafter.
3.1. SEM Results
Figure 1 shows the SEM images (magnification—3000x) of the NG, AM-G and ODA-AM-G. In comparison with NG, morphological changes can be seen in the AM-G image, evidencing partial lamellar expansion. The image the sample modified with octadecylamine (ODA-AM-G) indicated that partial lamellar exfoliation was successful. This permits inferring that the insertion of the hydroxyl (OH) and carboxyl groups (COOH) on the surfaces of the
 (a)
(a) (b)
(b) (c)
(c)
Figure 1. SEM images for NG (a), AM-G (b) and ODA-AMG (c) samples.
graphite layers and their distension was promoted by acid oxidation and sonication. The presence of OH and COOH groups enabled the modified graphite to react with octa decylamine and to expand and exfoliate its layers.
3.2. FTIR Results
The FTIR spectra of the samples are shown in Figures 2(a) and (b). As expected, the NG spectrum did not present any absorption in the medium infrared range. In the AM-G (Figure 2(b)) spectrum, OH (3500 cm−1) and COOH (1700 cm−1) could be detected. The bands at 3333, 3252 and 3161 cm−1 (amine N-H bonds) and in the range of 2918 - 1366 cm−1—related to the C-H and N-H bonds —are characteristic of octadecylamine (Figure 2(a)). The ODA-AM-G spectrum showed absorptions related to ODA, indicating the insertion of amine in the graphite galleries, obtaining modified graphite.
3.3. WAXD Results
Figure 3 shows the WAXD results. The NG and AM-G
 (a)
(a) (b)
(b)
Figure 2. (a) FTIR spectra for ODA-AM-G and ODA samples; (b) FTIR spectra for AM-G sample.
diffractrograms presented a single 2θ peak at 26.5˚ but the diffractogram of the treated graphite showed a broadened and less intense diffraction peak. After acid treatment and sonication processes, the insertion of the OH and COOH reactive groups promoted some defects in the crystal distortion and orientation of the graphite lamellar stacking. In the diffractrogram of the graphite modified with octadecylamine (ODA-AM-G), although the 2θ peak at 26.5˚ still remained, it was less intense than for the AM-G and a new diffraction peak around 21˚ was observed. This suggests that ODA insertion occurred and at least a partial delaminated structure was achieved. If any exfoliated structure was produced, it could not be detected by WAXD.
3.4. TGA Results
Figure 4 shows the thermogravimetric curves. The degradation curve of NG showed a first degradation around 100˚C, attributed water absorption and degradation of the carbon chain around 700˚C. The AM-G curve also re-

Figure 3. WAXD results for NG, AM-G, ODA-AM-G and ODA samples.
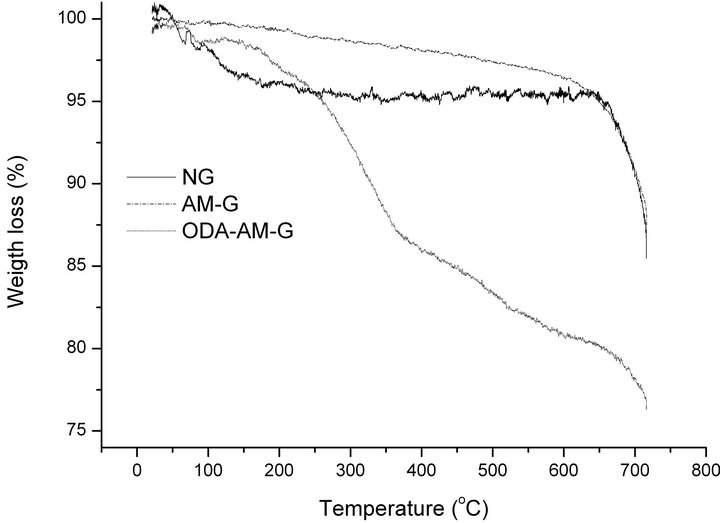
Figure 4. TGA curves for NG, AM-G and ODA-AM-G curves.
vealed carbon chain degradation near 700˚C. Three different degradation steps were observed in the ODA-AMG curve. The first was located between 200˚C - 350˚C, the second was around 350˚C - 600˚C and the final onewas above 700˚C. The first two could be attributed to the degradation of the octadecylamine inserted in different types of structures of the modified graphite (delaminated and exfoliated). The final step represented the degradation of the graphite carbon chain. The results confirmed that organically modified graphite was produced.
3.5. Relaxometry Results
The relaxometry results are presented in the Figure 5. The acid mixture (AM sample) showed a straight line parallel to the frequency axis, being T1H quasi constant for all frequencies. For octadecylamine, the variation of relaxation time versus frequency presented a sigmoidal curve (S shape). For the graphite modified with acid mixture (AM-G sample), the curve revealed a rise from 105 Hz to 107 Hz, after which it remained constant. The profile was due to the presence of carboxyl and hydroxyl groups inside the graphite galleries, which can be chemically linked or adsorbed on the surface. The relaxometry curve of graphite modified with octadecylamine (ODA-AM-G) also showed that the relaxation time was dependent on the frequency. The profile of the graphite/ octadecylamine curve indicated two rises. The first started at 105 Hz and finished at approximately 106 Hz. There was a plateau between 106 - 107 Hz but the point near 109 Hz suggested that a second rise occurred. It could be assumed that at least two kinds of structures were present in the graphite/octadecylamine sample. The first rise could represent the exfoliated structure where the octadecylamine molecules are less constricted while the second one could be attributed to the delaminated structure—octadecylamine molecules are more squeezed between the graphite layers. The result supports the obser vations from the WAXD and TG analyses.
4. Conclusion
Natural graphite was modified by the action of an acid mixture. The presence of hydroxyl and carboxyl groups on the graphite lamellar surface allowed its chemical modification through reaction with octadecylamine. Organically modified graphite was obtained. The techniques of characterization allowed inferring that a mix of structures—delaminated and exfoliated—was achieved.
5. Acknowledgements
We would like to thank the Brazilian research agencies CNPq and CAPES for financial support, CETEM—Brasil for assisting with the SEM analysis and also Laboratório de Engenharia Química e Biologia and Laboratório de

Figure 5. LFNMR for AM, AM-G, ODA-AM-G and ODA samples.
Ressonância Magnética Nuclear, both of IST in Portugal, for helping with part of this study.
NOTES
#Corresponding author.