Changes in reaction time, coefficient of variance of reaction time, and autonomic nerve function in the mental fatigue state caused by long-term computerized Kraepelin test workload in healthy volunteers ()
1. INTRODUCTION
It is well known that stressful social events frequently become the trigger for acute mental fatigue and sometimes cause problems with mental health and chronic fatigue, occasionally resulting in death in the case of overwork [1-3]. In Japan, 60% of the general adult population complaints of fatigue and one third of the population suffers from chronic fatigue [4]. Furthermore, about four hundred people have died caused by overwork every year. In 2006, the Japanese Ministry of Health, Labor, and Welfare made a new law for protecting against health problems due to overwork. According to this new law, Industrial physicians have to check the mental and physical health conditions of all laborers, if they work more than 100 hours overtime per month. However, no specific biomarkers for fatigue state have been found, and the vast majority of industrial physicians have judged their health conditions just by the subjective symptoms given in questionnaires and physiological observations. Therefore, Japanese physicians are extremely eager for evaluating worker’s fatigue state objectively by using some makers of fatigue.
In 2009, the new study group for fatigue supported by the Japanese Ministry of Health, Labor, and Welfare (Head: Kuratsune H) was set up, and the sensitivity and the specificity of several makers of fatigue state including autonomic nerve activity have been studied. Recently we demonstrated that autonomic nervous alterations are associated with daily level of fatigue [5], and that mental fatigue caused by prolonged cognitive load is associated with sympathetic hyperactivity [6].
Our co-workers K. Yamaguti and T. Sasabe devised the new software named the Computerized Kraepelin Test (CKT) for conveniently checking the calculation capability. Using this software, it is easy to determine the reaction time (RT), coefficient of variance of reaction time (CV), and accuracy of the answers (AC) during this test. Since the long-term CKT workload causes mental fatigue state, there is a possibility that a mental fatigue model of healthy volunteers would be produced by using this workload. Furthermore, as mentioned above, the CKT itself is the software for checking certain kinds of brain functions. Therefore, it also is available for checking changes in brain function during the fatigue state caused by the long-term CKT workload. In this present study we evaluated the fatigue sensation, and brain function in terms of RT, CV, AC, and autonomic nerve function during, before and after the long-term CKT workload in healthy volunteers.
2. MATERIALS AND METHODS
2.1. Subjects
The subjects in this study were 24 students in Kansai University of Welfare Sciences (4 males and 20 females, 19 - 22 years of age). The study protocol complied with the Helsinki Declaration for Human Experimentation. The protocol was approved by the Ethics Committee of Kansai University of Welfare Science, and all subjects gave their written informed consent for the study.
2.2. Protocol of Task
We conducted a 2-day experiment. At the first and second morning without eating breakfast, all subjects assessed their subjective fatigue levels by using the visual analog scale (VAS) from 0 (minimum) to 100 (maximum). Their baseline autonomic nerve activities were determined by using heart rate variability analysis of the data from a 5-minute electrocardiogram (ECG) before the fatigue-inducing task. After this analysis, each subject performed a 2-hour fatigue-inducing task (see details in the following paragraph) without rest. After this task, they assessed their subjective fatigue levels by using VAS at 0, 20, and 60 minutes after the start of their rest period [7]. Their autonomic nerve activities were also examined again by 5-minute ECG before and after 20-, and 35-minute rest (Figure 1(a)). During the 2-hour fatigue-inducing task and 55-minute rest period, all subjects maintained the fasting state with the exception that they drank water.
2.3. Computerized Kraepelin Test (CKT)
In this study, computerized Kaepelin test was used as a fatigue-inducing task. Two digits from 0 to 9 and one “+” symbol were displayed at the top of the laptop computer screen (Figure 1(b)). Ten digits, from 0 to 9, were also displayed at the half bottom of the screen. The examinee was ordered to add these 2 digits at the top of the screen and show the answer by selecting a 1-digit number from 0 to 9 displayed at the half bottom of the screen by using a pointing device. For example, in the case of “6 + 5” on the laptop computer screen, the answer is 11; but the examinee should select the last 1-digit number of 1. When the examinee selected a 1-digit number on the screen, 2 new digits from 0 to 9 immediately appeared at the top of the screen. The examinee had to continue this procedure for 120 minutes as a fatigue-inducing task. The reaction time (RT), coefficient of variance of reaction time (CV), and accuracy of all of the answers (AC) were recorded automatically.
Since the response of most of the examinees during the first 5 minutes of this fatigue-inducing task was slow because of their inexperience, we evaluated the RT, CV, and AC at 6 - 10 minutes, 61 - 65 minutes, and 116 - 120 minutes after the beginning of the task as the change in response due to the fatigue state.
Furthermore, we also evaluated the RT, CV, and AC for 4 minutes after a 1st 20- and a 2nd 35-minute rest for evaluating the change in the response due to their recovery by resting (Figure 1(a)).
2.4. Measurement of Heart Rate Variability
ECG signals were collected on-line via 3 electrodes attached to both wrists. These ECG signals were collected at 1000 Hz and converted from analog to digital with a 12-bit resolution. R-wave peaks were detected by using an LRR-03 device (GMS Co., Tokyo, Japan). R-R wave variability was measured as an indicator of autonomic nerve activity. The system calculated instantaneously the R-R intervals as the difference between successive R-wave peaks.
 (a)
(a)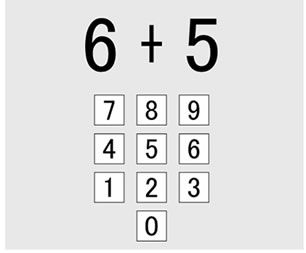 (b)
(b)
*: Subjects assessed their subjective fatigue levels for 1 min by using the visual analog scale (VAS), and their autonomic nerve activities were examined by heart rate variability analysis of the data from a 5-minute electrocardiogram (ECG); **: The RT, CV, and AC on the CKT lasting 4 minutes were also determined after 20 and 35 minutes’ rest for evaluating their recovery by the rest.
Figure 1. (a) Schematic presentation of long-term Computerized Kraepelin Test (CKT) workload. We evaluated the reaction time (RT), coefficient of variance of reaction time (CV), and accuracy of the answers (AC) at 6 - 10 minutes, 61 - 65 minutes, and 116 - 120 minutes after the beginning of CKT as the change in response due to the fatigue state; (b) Schematic presentation of CKT on the laptop computer screen.
2.5. Spectral Analysis
Frequency-domain analyses of HRV were performed on a collected R-R interval time series of 5 consecutive minutes by using the maximum entropy method (MemCalc; GMS Co., Tokyo, Japan) [8]. Thirty-second subsequences of R-R intervals that started at every beat were generated. The power integrals of the low-frequency component (LF, 0.04 to 0.15 Hz) and high-frequency component (HF, 0.15 to 0.40 Hz), as well as the LF/HF ratio, were calculated in all 30-second R-R interval subsequences. Finally, the mean of the LF/HF ratio in the whole time series was chosen as an autonomic index in this study.
2.6. Statistical Analysis
Differences in variables between groups were assessed by using a multivariate analysis of variance (type II MANOVA), which was performed on the fatigue VAS score, LF/HF ratio, RT, and CV of CKT. R version 2.8.0 was used to perform all multivariate analyses of variance [9].
3. RESULTS
3.1. Behavioral Results
The fatigue VAS (fVAS) scores of the 24 students before and after the long-term (2-hour) CKT workload are shown in Figure 2. The fVAS scores at both 1st and 2nd days were increased by the fatigue-inducing task and recovered to the baseline level by the rest. Those increases and recovery from the fatigue sensation were statistically signifycant (type II MANOVA, p < 0.001). The fVAS score for the morning of the 2nd day (2nd day baseline) tended to be higher than that for the morning of the 1st day (type II MANOVA, p = 0.0547).
Figure 3(a) shows the change in the RT of the 24 students before and after the CKT workload. Their RT was significantly increased by the fatigue-inducing task and recovered by the rest at both 1st and 2nd days (type II MANOVA, p < 0.005). The RT of the 1st –day session during and after the CKT workload tended to be longer than that of the 2nd-day session (type II MANOVA, p = 0.093).