Spatial Analysis of Fine Particulate Matter (PM2.5) in South St. Boniface and Mission Industrial Area, Winnipeg, Manitoba, Canada ()
1. Introduction
Scrap metal recycling has positive and negative environmental impacts (Foulke, 2008) . Positively, recycling metals can replace virgin ore from mining the earth, which is less energy intensive. Scrap metal recycling facilities salvage valuable metals from automobiles, aluminum sheets and copper parts in buildings. Negatively, heavy metal and particulate emission from scrap metal recycling pose a risk to human health and the environment (Owoade et al., 2015; Ogundele et al., 2017) . Scrap metal shredders emit lead, zinc, mercury, chromium, and other metals (Foulke, 2008) . Studies of scrap metal recycling facilities in Nigeria and the USA measured high levels of fine particulate matter (PM2.5) emissions exceeding the World Health Organization’s (WHO) guidelines (Owoade et al., 2015; Raun et al., 2013; World Health Organization, 2000; 2006) .
Significant health risks are posed by fine particulate matter less than 2.5 microns in size (PM2.5) (World Health Organization, 2021) . This PM2.5 penetrates deep into the respiratory airways, thoracic region, lungs, and bloodstream to cause damage (World Health Organization, 2013) . The WHO air quality guideline has no safe exposure level to PM2.5, with increasing levels resulting in higher rates of cardiopulmonary and respiratory diseases (Xing et al., 2016) . The small size of 2.5 microns allows the particle to remain airborne to travel large distances from its industrial or fire source (Brauer et al., 2018; Sofowote & Dempsey 2015) .
Numerous epidemiological studies identify health risks and increased hospitalization rates from short-term exposure to fine respirable particles, especially among the elderly and people with pre-existing lung and heart diseases (Rückerl et al., 2011; Le et al., 2014) . Exposure to PM2.5 damages the lungs and respiratory airways, worsening asthma symptoms, causing breathing difficulties and irritating the throat (D’Amato et al., 2015; Jung et al., 2019) . Exposure to PM2.5 is associated with respiratory and cardiovascular risks, including chronic obstructive pulmonary disease (COPD), asthma, chest pain and bronchitis (Sutherland et al., 2005; Ovadnevaite et al., 2006) . Many industries cause particulate emissions, noise, increased traffic, and toxic substances pollution posing health risks (Ostrowski et al., 1999; Koranteng et al., 2007) . PM2.5 pollution risks both the health of workers with exposure on the job and nearby residents to industrial pollution sources in mixed land-use neighborhoods (Taylor, 2014) . Mixed land-use areas often attract hazardous industrial facilities near racialized and lower-income neighborhoods, increasing their health risks (Hamilton, 2013) . Long-term exposure to PM2.5 is correlated significantly with respiratory-related diseases and death (Brunekreef & Holgate, 2002) . As well as particulate, other hazards from industrial facilities include noise, increased traffic, and toxic substances posing health risks (Ostrowski et al., 1999; Koranteng et al., 2007) . Thus, concentrating on polluting industrial facilities near low-income and racialized residential areas constitutes environmental injustice and greater health risks (Mohai & Saha, 2015; Whittemore, 2017) .
To understand and manage air quality in mixed land-use areas requires regulatory urban air monitors to measure ambient levels of PM2.5 (Canadian Council Ministers of Environment (CCME, 2022) . However, regulatory analysis of local sources of PM2.5 is limited due to its expensive cost to deploy monitoring equipment and the inability of monitors to assess both upstream and downstream sources simultaneously to pinpoint emission sources (Han & Stock, 2017; Oluwadairo et al., 2022) . The PM2.5 levels in ambient air vary spatially for different land-uses, industrial, residential, commercial, and agricultural activities and with mixed land-uses can be difficult to pinpoint pollution sources. The spatial variability of PM2.5 is due to local sources, not regional sources (Pinto et al., 2004; Anastasopolos et al., 2022) .
This study discusses the levels and sources of pollution impacting the low-income residential area of South St. Boniface next to the Mission Industrial Area (MIA), which includes a metal shredder (Winnipeg Regional Health Authority, 2015) . This paper studies the PM2.5 levels at different distances and directions from the metal shredder. In this paper we first discuss the study areas. Then we discuss the equipment used in the method and its validity to show how we arrived at our sampling strategy, considering wind direction and distance from the shredder. In the findings, we quantify PM2.5 levels downwind of the shredder to compare to upwind levels and background levels away from pollution sources. In the findings, we show graphs and maps of the pollution levels in different seasons to reveal the pollution sources. We then discuss the findings considering health and environmental risks and make recommendations to safeguard health and the environment.
2. Materials and Methods
2.1. Study Area
This pollution study focuses on the MIA and SSB neighborhoods on the north and east side (see Figure 1) of the St. Boniface area. The St. Boniface and St. Vital districts of Winnipeg, Manitoba, with a population of 95,514 (Statistics Canada, 2021) . The SSB neighborhood is located within one km of a scrap metal shredder, a railway, and many other manufacturing facilities in the MIA area. This area has a large population of low-income people, Indigenous people and people of colour (Statistics Canada, 2021) . The scrap metal shredding and processing operations have caused fires, explosions, noise and emissions, raising deep concerns from the residents and business owners in SSB (Canadian Broadcasting Corporation, 2015; Larsen, 2017) . Residential areas in central St. Boniface, SSB and Southdale are located nearby MIA on the south side.
2.2. Monitoring Approach, Instrument Selection, and Validation
The first author monitored Winnipeg’s MIA in the SSB neighborhood for over 500 daytime hours for PM2.5 from June 2018 to December 2018. The MIA has many diverse industries within a 24.5 km2 area of the Red River and Seine River junction, including a scrap metal recycling plant with a metal shredder (Manitoba Environment and Climate, 2017) . The scrap metal shredder is located less
![]()
Figure 1. Map of St. Boniface, Winnipeg, showing the locations of residential neighborhoods and the recycling industry with inset of Canada.
than one kilometers from the closest residential street in the SSB neighborhood The scrap metal recycling facility received a license to operate a scrap metal shredder on January 16th, 2017 (Manitoba Environment and Climate, 2017) .
2.2.1. Equipment to Monitor PM2.5 Levels
The regulatory method to monitor PM2.5 compliance requires designated Environmental Protection Agency (EPA) Federal Reference Methods (FRM) or Federal Equivalent Methods (FEM) using manual gravimetric pre-weighed filter paper and non-filter-based techniques (Noble et al., 2001; CCME, 2011) . These high-volume air samplers have a suction fan at a precise airflow. Government and regulatory agencies deploy these methods (FRM and FEM) to report city or regional air quality levels for PM2.5. The FRM regulatory approach costs thousands daily, which is unaffordable for citizens or most universities.
To regularly monitor emissions over the many pollution events is required, which requires more than one day per year (Carvlin et al., 2017) . The FRM/FEM monitors are expensive equipment and require trained staff with technical expertise to operate and maintain, which is costly. The many thousands of dollars required for long-term FRM monitoring meant this method could not be used. Other validated methods had to be used for long-term monitoring to be affordable. Commercially available low-cost particulate monitoring technologies have shown accurate results for PM concentrations (Northcross et al., 2013; Wang & Ogawa, 2015; Jiao et al., 2016) . We chose the rechargeable battery-operated Dylos DC 1700-PM laser particle counter to monitor air quality for citizen science purposes rather than regulatory purposes, due to its good accuracy for indoor and outdoor PM2.5 concentrations (Northcross et al., 2013; Dylos Corporation, 2019; Arling et al., 2010; Semple et al., 2013; Steinle et al., 2015) . This monitor is low-cost compared to traditional gravimetric and continuous designated EPA particulate matter monitors in industrial and residential areas (Steinle et al., 2015) . This awareness and advocacy tool has allowed monitoring networks for citizens to advocate for better air quality (Clements et al., 2017) .
2.2.2. Validation of Dylos Laser Particle Counter for PM2.5 Measurement
The Dylos DC 1700 is a laser particle counter of light scattering, detecting and counting particles (cubic foot) in two size ranges: coarse particulate matter larger than 2.5 µg (PM2.5) to 10 µg (PM10) and fine particulate matter, small from 2.5 to 0.5 µg (Dylos Corporation, 2019) . We measured only fine particulate matter in this study (Figure 2). Particles smaller than 0.5 µg are nanoparticles not measured by the Dylos 1700. The DC 1700 draws the airstream at 28.32 litres/minute with an inbuilt computerized fan to monitor the particles in the measurement chamber with a laser beam operating at a 650 nm wavelength (Northcross et al., 2013) . The airstream particles pass through a laser light, which causes scattering effects. Dylos logged the number of particles detected for each particle size by the scattering effect on an inbuilt memory, storing up to a week’s time-stamped data recorded every minute (about 10,000 samples). Dylos particle count per cubic foot to microgram per meter cube (µg/m3) unit measurement of PM2.5 by FRM and FEM using validated statistical and algorithmic models (Arling et al., 2010) considering relative humidity factor in SSB and MIA.
Many studies validate the Dylos’ accuracy. Validation was done when the Dylos is collocated with designated EPA FRM and FEM PM2.5 air monitors
![]()
Figure 2. The rechargeable battery-operated Dylos DC 1700-PM laser particle counter.
(Carvlin et al., 2017; Northcross et al., 2013; Arling et al., 2010; Semple et al., 2013; Steinle et al., 2015) . According to Steinle et al. (2015) , Dylos and a FEM national PM2.5 air monitoring network showed a correlation of 0.9 and 0.7 at urban and rural background sites, respectively. Similarly, field tests of wood smoke by Dylos 1700 and FEM were highly correlated at 0.81 and 0.99 (Carvlin et al., 2017) .
2.2.3. The Sampling Method
We calibrated the settings of the Dylos counter to measure the PM2.5 concentration of suspended particulate matter below 2.5 µg, specifically PM2.5. We monitored for PM2.5, at the fence line or property’s edge of the recycling industry, close to the emission source (Owoade et al., 2015; Raun et al., 2013) . This sampling point was the best place to measure emissions available, as the outdoor metal shredder lacked an exhaust stack and we were not allowed on the industrial property.
We followed a daily schedule routine for monitoring MIA and SSB. At MIA, we recorded the upwind PM2.5 for one hour in the morning and one hour in the afternoon with the Dylos 1700 Air Quality Monitor before scrap metal recycling in the MIA commenced. Our schedule of monitoring SSB and MIA is summarized in Table 1.
2.3. Method of Data Analysis
We obtained the mean, median and standard deviation for the PM2.5 from the Dylos and the FRM stations. We corrected the PM2.5 using the relative humidity factor from the nearby Environment Canada weather station. We installed a Watchdog weather station downwind of the MIA to obtain more localized data for temperature, humidity, wind speed and direction. We determined the statistical significance of the Dylos PM2.5 levels in SSB and the PM2.5 levels by Pearson correlation to Manitoba’s FRM/FEM monitors. The hourly data met the assumptions of Pearson correlation of related pairs, continuous data, and linearity. The statistical significance was defined at a level of p < 0.05 (Pei et al., 2016) . Using Pearson correlation, we tested the hypothesis that the hourly upwind PM2.5 measured by the Dylos and corresponding FRM monitors data using statistical software SPSS version 23 and Microsoft Excel 2016.
![]()
Table 1. PM2.5 monitoring schedule in mission industrial area (MIA) and South St. Boniface (SSB).
The statistical hypothesis test for this p-value is H0: No statistically significant relationship exists between the upwind PM2.5 in MIA and ambient levels measured by regional regulatory monitors (PM2.5) in Winnipeg. H1: A statistically significant relationship exists between MIA’s upwind (PM2.5) and Winnipeg’s ambient level measured by regional regulatory monitors (PM2.5). We performed a statistical hypothesis test for the p-value and variability (r) test, with the hypothesis (H) for H0 being the null hypothesis. H0: There is no statistically significant relationship between the tested instruments, the Dylos (residential monitor) and FRM monitors.
The descriptive statistics for downwind mass concentration of PM2.5 during scrap metal recycling operations for monitoring hours were analyzed with SPSS and Microsoft Excel. We compared the daily mean values of downwind respirable fine particulate matter (PM2.5), upwind values, and regulatory monitors with the Canadian Ambient Air Quality Standards (CAAQS) threshold values of 27 µg/m3. We applied regulatory guidelines/standards to compare levels. We also compared the PM2.5 levels in MIA and SSB to the background PM2.5 levels in FRM stations. Then we statistically analyzed the one-way analysis of variance (ANOVA) and posthoc test on SPSS version 23. We analyzed the hourly mean differences of PM2.5 values measured at the downwind fence line scrap metal shredding emission monitoring points with a one-way ANOVA (PM2.5). We compared if statistically different then the downwind cardinal points as group factors. We also statically analyzed Tukey’s HSD multiple comparisons of means. We determined summary statistics of PM2.5 for the different streets in Dufresne Avenue of SSB, including daily mean and standard deviation of PM2.5 measured in St. Boniface, hourly minimum, and maximum values of daily PM2.5, CAAQS 2015 24-hours value (27 µg/m3) for poor air quality.
Also, we mapped spatial and temporal variation of PM2.5 in the MIA and SSB neighborhoods using Arc Map on the ArcGIS desktop. Variations in PM2.5 are mapped over the months through time-series data (Liu et al., 2017) . Mapping of air pollutants provides a visual of the local and regional levels of air pollutants, revealing hotspots with higher pollution levels (Bari & Kindzierski, 2018) . Thus, ArcGIS software was applied to conduct a spatial analysis of PM2.5 hourly data measured at the scrap metal recycling fence line areas and the residential sampling points. In our study, PM2.5 values were interpolated using geostatistical kriging analysis and the color-coding of Canadian Ambient Air Quality Standard (CAAQS) for management action level for achieving air quality zone (see CAAQS in Table 2). Monthly visualized patterns of respirable particulate matter emission trends at the scrap metal shredder sampling points and ambient levels in SSB are presented.
3. Result and Discussion of Particulate Matter (PM2.5) in Mission Industrial Area and South St. Boniface
The summary statistics for the PM2.5 monitored in the upwind and downwind
![]()
Table 2. Canadian ambient air quality standards (CAAQS) for PM2.5.
directions of the scrap metal shredder in Mission Industrial Area are presented in Chart 1.
3.1. Upwind Values of PM2.5 near Fence-line of Scrap Metal Recycling Activities
Chart 1 shows the upwind PM2.5 level for the MIA follows the trend of the FRM1 monitor located on Ellen Street, five kilometres away. Both the Dylos and the FRM1 range from 1.7 µg/m3 to 25.3 µg/m3 in the morning and 1.8 µg/m3 to 22.3 µg/m3 in the afternoon. A similar trend in farther FRM2 on Scotia Street, sited eight kilometres from MIA, also recorded 0.4 µg/m3 to 36.9 µg/m3 for the morning and hourly afternoon readings ranged between 1.3 µg/m3 and 24.4 µg/m3.
The average (PM2.5) upwind measurements taken by the Dylos instrument and ambient (PM2.5) level measurement FRM1 monitor showed a significant, very strong linear relationship (r = 0.83, p < 0.01). Similarly, average (PM2.5) upwind measurements for the Dylos and FRM2 monitor had a significantly strong relationship (r = 0.83, p < 0.01). FRM1 and FRM2 monitors showed a significant, strong linear relationship and a very high positive correlation (r = 0.73, p < 0.01) (see Table 3 for Correlation Analysis).
The monitored high upwind and the ambient PM2.5 exceeded 27 µg/m3 for CAAQS and 24-hour mean 15 µg/m3 by the World Health Organization (WHO) in MIA on 8th, 17th and 23rd August 2018. During these dates, hourly upwind levels measured by the Dylos ranged between 19.2 µg/m3 to 24.6 µg/m3, similar to the values at Ellen 20.1 µg/m3 to 25.3 µg/m3. Scotia recorded 24.4 µg/m3 to 36.9 µg/m3 [45], respectively, the city-wide wildfire smoke impact on ambient air quality. Except on wildfire days, the upwind Dylos PM2.5 levels in MIA ranged from 0.3 µg/m3 to 11.7 µg/m3. These upwind levels were slightly lower than the FRM/FEM monitors, ranging from 0.4 µg/m3 to 15.5 µg/m3. By comparing downwind with the upwind, we could isolate the source of the pollution to the shredder. The downwind levels were significantly higher than the upwind Dylos and FRM/FEM monitors.
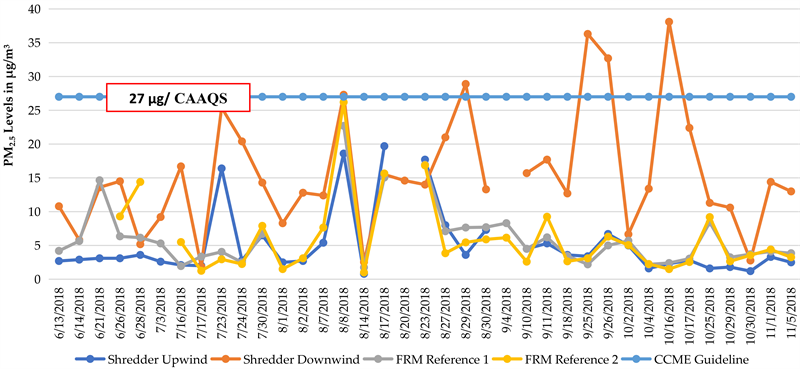
Chart 1. PM2.5 levels in up/downwind scrap metal shredder and ambient PM2.5 levels in reference monitors, Winnipeg.
![]()
Table 3. Pearson correlation of PM2.5 levels monitored at upwind scrap metal shredder and FRM1 and FRM2 regulatory monitors.
*Significant at p ≤ 0.05 level; **Correlation is significant at the 0.01 level (2-tailed).
3.2. PM2.5 Downwind Fence-Line Measurement near Scrap Metal Recycling Operations
The daily mean values of PM2.5 measured at the downwind north, south, west, and east fence line of the scrap metal recycling operations range between 1.9 ± 0.85 µg/m3 and 38.1 ± 20 µg/m3 between June 13th and December 18th, 2018. The PM2.5 air monitoring at the fence line sampling points of the recycling facility had significant variation. In June 2018, the fine respirable particulate matter ranged between 5.2 ± 2.03 µg/m3 and 14.5 ± 6.7 µg/m3, below the 27 µg/m3 limit of CAAQS. For June, the daily hourly minimum and maximum values ranged from 3.3 to 8.4 µg/m3 and 7.6 to 25.6 µg/m3. This was below the threshold values limit for management action.
Our study found higher daytime downwind PM2.5 between July and October 2018. In July, the daily mean value ranged from 1.86 ± 0.85 to 25.4 ± 9.71 µg/m3, below CAAQS (see Chart 2). Daily mean values of PM2.5 observed in August ranged from 2.55 ± 0.82 to 28.9 ± 15.4 µg/m3. Scrap metal shredding and other activities sporadically operated during August 2018 due to the annual maintenance of the automobile shredder. Daily means for three out of 11 monitoring days in August, at 27.2, and 28.9 µg/m3, respectively, exceeded the 27 µg/m3 CAAQS. In September and October 2018, four monitoring days out of 13 exceeded CAAQS. Daily mean values of PM2.5 during the scrap metal recycling operation hours ranged between 28.1 ± 10.1 µg/m3 and 38.1 ± 20.7 µg/m3 (see Chart 2).
3.3. Result of One-Way ANOVA for PM2.5 Downwind Emissions from Scrap Metal Shredding
The one-way ANOVA in Table 4 shows a statistically significant difference between the 243-hourly means of PM2.5 for the four downwind monitoring points of scrap metal shredder, F(3, 40) = 14.66, p ≤ 0.001. Furthermore, the Tukey HSD multiple comparisons of means showed a statistically significant difference between PM2.5 levels for the four grouped downwind monitoring points: Northwesterly, Northeast, Southwest, and Southeast (p ≤ 0.001).
3.4. Result and Discussion of Respirable Fine Particulate Matter (PM2.5) in South St. Boniface
In the residential areas, the daytime PM2.5 means ranged between 0.79 ± 0.14 µg/m3 and 27.9 ± 6.45 µg/m3 between June 15th and December 13th, 2018 (see Chart 3). The highest daily mean values occurred on three out of the eight monitoring days on the 10th, 16th, and 24th of August, which measured 21.9 ± 1.1 µg/m3,

Chart 2. Emissions of fine respirable particulate downwind from scrap metal shredder for seven months.

Chart 3. PM2.5 levels in Up/downwind scrap metal shredder and ambient PM2.5 levels in reference monitors, Winnipeg.
![]()
Table 4. One-way ANOVA for PM2.5 levels monitored downwind directions of the scrap metal shredder.
*Significant at p ≤ 0.05 level.
25.6 ± 5.9 µg/m3, and 27.9 ± 6.5 µg/m3, respectively. High PM2.5 levels in residential areas for these three days were similarly recorded at the reference monitoring stations, 41.6 ± 8.4 µg/m3, 38.7 ± 9.5 µg/m3, and 4.8 ± 0.6 µg/m3 for FRM2 monitor, and 43.3 ± 5.1 µg/m3, 27.1 ± 5.9 µg/m3 and 6.9 ± 0.5 µg/m3 for FRM1 monitor in Winnipeg. These three-day means exceeded the CAAQS 27 µg/m3 threshold guidelines for poor air quality. The highest values occurred when wildfire smoke from British Columbia, Alberta or Ontario smoke were moving into Winnipeg in early and late August 2018 (see Chart 4).
With higher ambient PM2.5 levels and short-term human exposure, smoke plumes from wildfire provide risks to vulnerable and distant geographical populations. PM2.5 values in SSB were lower than the CAAQS for days monitored. Daily means of PM2.5 observed in June and July ranged from 1.1 ± 0.2 µg/m3 to 4.54 ± 0.3 µg/m3, respectively. These summer levels in SSB were lower and within the PM2.5 values 1.9 ± 0.6 µg/m3 to 6.6 ± 0.7 µg/m3 for FRM1 monitor station,

Chart 4. Monthly ambient PM2.5 levels monitored in South St. Boniface for seven months.
with 2.7 ± 0.7 µg/m3 to 10.9 ± 4.6 µg/m3 for FRM2 monitor station. Similarly, PM2.5 levels June and July in the residential area of SSB were lower than the MIA upwind measurements ranging from 2.0 ± 0.2 µg/m3 to 16.4 ± 18.5 µg/m3 (see Chart 4). Similarly, PM2.5 values for September to December monitoring months ranged from 1.5 ± 0.53 µg/m3 to 9.81 ± 3.87 µg/m3 (see Chart 4). These PM2.5 levels from September to December in SSB are lower than the 1.2 ± 0.1 µg/m3 to 35.8 ± 30.8 µg/m3 measured at the FRM2 station and 1.8 ± 0.04 µg/m3 to 12.7 ± 1.4 µg/m3 measured at the FRM1 station.
The observable differences in PM2.5 mass concentrations in the MIA and SSB are attributed to the northwesterly dominant wind direction observed and recorded by our Watchdog weather monitoring station (Figure 3). The SSB residential neighborhood is located southeast of the city area. The scrap metal shredder is northeast of the residential area. The northwesterly dominant wind direction will mostly disperse fugitive emissions from the scrap metal shredder downwind of the dominant wind direction (Figure 3). Prevailing wind direction affects industrial facilities’ dispersion of PM2.5 concentration emission. According to the industrial air pollution dispersion study by Guerra et al. (2006) , wind direction was a statistically significant factor in the local and regional dispersion of industrial emissions of PM2.5 concentration.
3.5. Result of One-Way ANOVA and Correlation Analysis for PM2.5 in Dufresne Avenue, South St. Boniface
The result of the one-way ANOVA (see Table 5) showed a statistically significant difference between the 256-hourly means of PM2.5 levels at Dufresne Avenue compared to other streets, where F(3, 256) = 4.4 and p-value = 0.005). Furthermore, the Tukey HSD multiple comparisons of means showed a statistically significant difference between PM2.5 levels for three out of four monitoring streets (Kavanagh-Cherrier (p = 0.033); Kavanagh-Doucet (p = 0.037).
PM2.5 concentrations vary spatially at different scales. Limited air monitoring networks in city areas or large population settlements under-report the ambient
![]()
Figure 3. Wind rose for wind speed and wind direction measurement from mission industrial watchdog weather station. (6 June to 2 November 2018).
![]()
Table 5. One-way ANOVA for PM2.5 levels monitored downwind directions of the scrap metal shredder.
*Significant at p ≤ 0.01 level.
air quality of industrial and mixed-use areas (Guerra et al., 2006) . Hence, our study used the statistical analysis method, Pearson correlation, to show the relationship between the ambient PM2.5 concentrations monitored by the Dylos (residential) monitor at South St. Boniface with Winnipeg’s FRM monitors. We compared the 260 hours of PM2.5 data in SSB with 240 and 220 hours of data for FRM1 and FRM2 monitors in downtown Winnipeg. The charts above showed the increasing and decreasing trends of PM2.5 levels compared to the Manitoba ambient PM2.5 levels for Winnipeg. These two FRM monitoring stations sited five and eight kilometres from our particulate monitoring sites in SSB. Both monitoring stations in downtown Winnipeg reported Winnipeg’s general air quality, without providing local ambient air quality readings to other parts of the city.
The Dylos (residential) and FRM1 (Reference) monitors have a significant, strong linear relationship (r = 0.67, p < 0.001). The direction of the relationship is positive for Dylos and FRM1, meaning these variables tend to increase together (see Table 6 for Correlation Analysis). The Dylos and FRM2 have a significant relationship linear relationship (r = 0.52, p < 0.001), which is moderately positively correlated), meaning these variables tend to increase together. Similarly, the FRM1 and FRM2 monitors have a significant positive linear relation
![]()
Table 6. Pearson correlation of PM2.5 levels monitored with Dylos at South St. Boniface and FRM1 and FRM2 regulatory monitors.
*Significant at p ≤ 0.01 level; **Correlation is significant at the 0.01 level (2-tailed).
for the north and east sides. The FRM1 (Reference) and FRM2 (Reference) are very strongly positively correlated, meaning these variables tend to increase together.
4. ArcGIS Mapping of PM2.5 in Mission Industrial Area and South St. Boniface
The interpolated maps of Maps 1(a)-(f) display the patterns and distribution of PM2.5 trends based on emissions and the prevailing wind direction of the study area. The green patterns on the interpolated maps indicate satisfactory air quality sampling areas, with PM2.5 levels of less than ten µg/m3, in the residential areas in SSB. The July map shows that the green pattern displayed in the Industrial Metal Inc. scrap metal shredder indicates the inaccessible PM2.5 monitoring areas within the industry site where we could not measure. Please note green does not indicate zero or acceptable particulate matter levels but notes a lack of any data. The yellow shading on the interpolated maps represent areas where PM2.5 levels exceed 10 µg/m3. This borderline level requires action to prevent the deterioration of air quality. The monthly orange patterns show PM2.5 levels of 19 to 27 µg/m3. These high levels are mostly within 100 meters of the scrap metal industry’s fence line. Last, the dark red patterns are areas where episodic hourly emissions exceeded PM2.5 > 27 µg/m3. The emissions reached higher levels of 20.3 to 67.2 µg/m3 from the scrap metal industry in the MIA and 21 to 35 µg/m3 ambient PM2.5 levels in the residential area.
Discussion of Interpolated Maps for PM2.5 in Mission Industrial Area and South St. Boniface
The higher PM2.5 levels downwind of the shredder compared to those upwind indicate that the metal shredder is the source of increased particulate matter. The
![]()
Map 1. (a) June 2018 spatial distribution of particulate matter in South St. Boniface; (b) July 2018 spatial distribution of particulate matter in South St. Boniface; (c) August 2018 spatial distribution of particulate matter in South St. Boniface; (d) September 2018 spatial distribution of particulate matter in South St. Boniface; (e) October 2018 spatial distribution of particulate matter in South St. Boniface; (f) November/December 2018 spatial distribution of particulate matter in South St. Boniface.
findings show exceedances and deteriorating air quality in the downwind westerly and northwesterly areas. The interpolated maps display higher levels as red and orange patterns. The map shows the spatial and temporal patterns of variation in PM2.5 levels. During the fires of August 2018, Canadian Ambient Air Quality Standards exceeded 35 µg/m3 for SSB caused by the summer smoke waves that drifted into Southern Manitoba from British Columbia and Alberta. Smoke from wildfires has atmospheric residence time that often lasts for days (Andreae, 1990) . According to Le et al. (2014) , the elevated outdoor concentration of PM2.5 from wildfire smoke contributes to a 49.6% increase in respiratory and cardiovascular diagnoses compared to the absence of forest fire smoke.
Monthly kriging maps display the periodic trends of air quality patterns below CAAQS and episodic deteriorating air quality caused by summer wildfire smoke. The air quality patterns seen from the interpolation in the residential area are linked with the impact of meteorological conditions, dominantly wind direction during the sampling season (see Figure 3). During this sampling period, higher emissions were predominately dispersed downwind of the shredder, which is upwind from the SSB residential area. Thus, ambient PM2.5 in the SBB residential area during the summer and fall seasons was from the regional transboundary movement of smoke and particles on already higher levels than the reference in the SBB (Sapkota et al., 2005) .
Our study’s monitoring upwind sites and FRM/FEM monitor sites showed an increased PM2.5 level by ten µg/m3 caused by the wildfire smoke waves from British Columbia and the northern Manitoba-Ontario border area (Canadian Broadcasting Corporation [CBC], 2018) . Studies have reported wildfire smoke waves significantly influencing summertime air quality in Canada and the Western United States, leading to a short-term exponential increase in PM2.5 levels (Davignon, 2014; O’Dell et al., 2019) . Wildfires often cause temporary deterioration of air quality, often accompanied by regional advisories on health risks associated with exposure to PM2.5.
5. Conclusion
The scrap metal shredder was identified as the source of PM2.5 emissions at measurable levels during its daily operations by comparing samples upwind and downwind. Most daily mean levels, downwind of the scrap metal shredder PM2.5, exceed upwind levels and background sites in the air quality reference monitoring stations. Exceedances of regulatory levels occurred in the downwind air monitoring points of MIA, with upwind points in SSB residential area, during this sampling season, standards were not exceeded except during wildfire season. The exceedance of PM2.5 emissions levels in MIA is a public health concern and increases the risks for the proximate residential neighborhood like SSB. However, when the wind shifts in other seasons, SSB may be at risk of exceeding standards.
Zoning toxic and polluting industrial facilities near low-income communities create poor health situations in these areas and health inequity. As SSB is low-income, with a median income of $43,200 (Statistics Canada, 2021) compared to the federal median average of $68,400, this low-income community suffers environmental injustice. This low-income community experiences higher pollution and risks compared to other communities, including exposures to children from contaminated air and soil. The health risks associated include asthma, and chronic respiratory conditions (WHO, 2013; Xing et al., 2016) .
The PM2.5 emissions from the scrap metal recycling shredder had sporadic daytime exceedance levels above the CAAQS. This exceedance signals a need for regulatory monitoring and management action to prevent pollution. Ambient particulate matter monitoring in residential areas and traffic corridors averaged daytime PM2.5 below the poor air quality standard for CAAQS.
The ambient PM2.5 levels showed a moderate to very strong correlation with the PM2.5 values reported by Manitoba Air Monitoring Station, Ellen and Scotia Streets, Winnipeg. In Winnipeg, pollution from northern summer forest fires contributed to a significant increase in ambient PM2.5 values for the residential neighborhood of SSB during three days of monitoring in August 2018. The seasonal impact of wildfire smoke on ambient air quality worsens the environmental risks and burden from industrial zoning facilities proximate to residential neighborhoods and the associated health impacts on the communities.
The PM2.5 air sampling by Dylos DC 1700 provided a low-cost air monitoring technique for citizens to monitor risk from PM2.5. However, future research for data validation using Dylos AQM in Winnipeg should be collocated with government (FRM/FEM) PM2.5 monitors. Using a single Dylos AQM at the monitoring locations in this study prevented the simultaneous collection of real-time upwind and downwind PM2.5 levels in MIA and SSB. Consequently, our PM2.5 monitoring study did not compare daily real-time in SSB concurrently when the scrap metal shredder operated. This research found high emissions above regulatory standards in MIA, requiring regulatory monitoring and enforcement.
Acknowledgements
We acknowledge and appreciate financial and other support provided by SSHRC and the South St. Boniface Resident Association, Winnipeg, Manitoba. They went door-to-door to fundraise to buy the Dylos DC1700 Air Quality Monitoring for data collection.