1. Introduction
The liver is an organ which plays an important role in the body [1], which is functioning extensively as the regulation of blood sugar levels, protein synthesis and detoxification [2].
Liver diseases are major problems throughout the world and afflicts over 10% of the world population. Many environmental toxins cause liver injury to humans, and despite new advances in hepatology, the treatment for liver diseases does not resolve the problems caused by these toxins [3,4].
Toxic substances such as abuse of alcohol, drug and carbon tetrachloride (CCl4) can cause liver diseases. The CCl4 has been widely used in the induction of acute liver damage in experiment of mice model [5,6]. According to the previous studies, CCl4 assumed to be a typical poison causing oxidative stress. Acute liver diseases are associated with the causing of CCl4 and characterized by increasing apoptosis and oxidative stress in the liver [7,8].
Liver cirrhosis is a condition of severe liver damage which impairs its ability to function properly. Liver cirrhosis is associated with complex metabolic disorders that lead to a catabolic state. Mal-assimilation and loss of protein result in malnutrition that highly prevalent among patients with liver cirrhosis and loss of protein result in malnutrition [9].
Malnutrition especially protein-calorie malnutrition is very common in patients with liver cirrhosis [10]. Liver cirrhosis is associated with reduced energy intake and increased resting energy expenditure [11]. Protein components found in milk and its products provide high branched chain amino acids, as well as kareish cheese is significantly higher in protein content than the full cream cheese. Branched amino acids do not represent any load on the diseased liver because of their metabolized extra hepatic [12,13].
So, dietary formula with high Fisher ratio (branched chain amino acid/aromatic amino acids) is important to improve nutritional state in liver cirrhotic patients. Formula containing medium chain triglycerides (MCTS) oil is important for cirrhotic patients since medium chain triglycerides could be absorbed without bile where the later is not easily produced by the scarred liver [14,15].
Elevated oxidative stress has been reported in a variety of chronic liver diseases which arises from increased formation of oxygen free radicals along with deficiencies of antioxidant vitamins and reduced antioxidant enzymes’ activities [16-18].
So it might be of importance to incorporate antioxidant sources in the nutritional supplements for liver cirrhotic patients [18,19].
Halliwell [20] indicated that polyphenolic compounds extracted from food or fruit can protect against liver injury because they exhibit one or a combination of antioxidant, antifibrotic, immunomodulatory, or antiviral activities. Also, Mohamed and Al-Obit [19] indicated that it is important to incorporate antioxidant sources in the nutritional supplements for liver cirrhotic patients.
Yang et al. [21] indicated that the germination of wheat grains could maximized the production of antioxidants as vitamins C and E [22-24].
Therefore the study was imitated to evaluate the prepared formulas from the stand point of potential effect of prepared formulas on liver cirrhotic rats.
2. Materials and Methods
2.1. Materials
Minerals, casein, cellulose, starch, vitamins, ascorbic acid, and carbon tetrachloride (CCl4) were purchased from El-Naser Pharm. & Chem. Ind Comp. Cairo, Egypt. The kits used in this study were purchased from Diamond diagnostics, Cairo, Egypt.
Yogurt, honey and wheat (Giza 91) were obtained from Agriculture Research Center (ARC), Giza, Egypt. Other materials included red rice, chicken, yeast, kareish cheese, sugar, corn oil and curcum, artichokes (Cynara scolymus), carrot (Caucus carota), sweet potato (Ipmoea batatas), banana (Musasapintum, M. pardisiaca), apples and prickly pear (Opuntia Ficus-Indica) were purchased from local market Giza, Egypt.
36 adult male Wister albino rats strain with average body weight of 195 ± 5 g were obtained from the animal house of Food Technology Research Institute, Agriculture Research Centre, Giza, Egypt. Rats were caged individually in wire bottomed stainless steel cages and kept under normal healthy laboratory conditions. Water was consumed ad-libitum at room temperature (22˚C - 24˚C).
2.2. Methods
2.2.1. Preparation of Raw Materials
Fresh vegetables and fruits were washed with tap water. Edible portions of the vegetables were blanched by steam until become soft. Fruits cut into slices and mixed well until waged to juice. Wheat grains cleaned, soaked in tab water then germinated according to the method of Abd El Mageed et al. [25]. Chicken was washed and cut into small pieces and cooked in least amount of water. Red rice grains were soaked in tap water for 3h then cooked for 30 min. All prepared materials for each formula (1 and 2) was mixed well using multi moulinette (Moulinex, France). Honey, oil, dry yeast, curcuma and ascorbic acid were added later with the aforementioned ingredients.
2.2.2. Formulas Preparation
Two formulas (1 and 2) were prepared from the above mentioned ingredients (Table 1). The first formula contained kareish cheese and yoghurt and the second contained chicken as sources of protein. The formulas were dried in an oven air dryer at 100˚C for 1h to evaporate the initial moisture, then the temperature was decreased to 55˚C ± 2˚C for 12 h according to AOAC [26]. The dried formulas were milled into powder (600 - 1400 micron) by using Attenzeove Mill (H250 H: 1, volt 220 Italy) and sieved through 100-mesh sieve, then packed in polyethylene bags at 4˚C till used.
2.2.3. Chemical Analysis
Moisture, protein, crude fiber, fat and ash content of the prepared formulas were determined according to the method described in AOAC [26]. Total carbohydrate was calculated by difference.
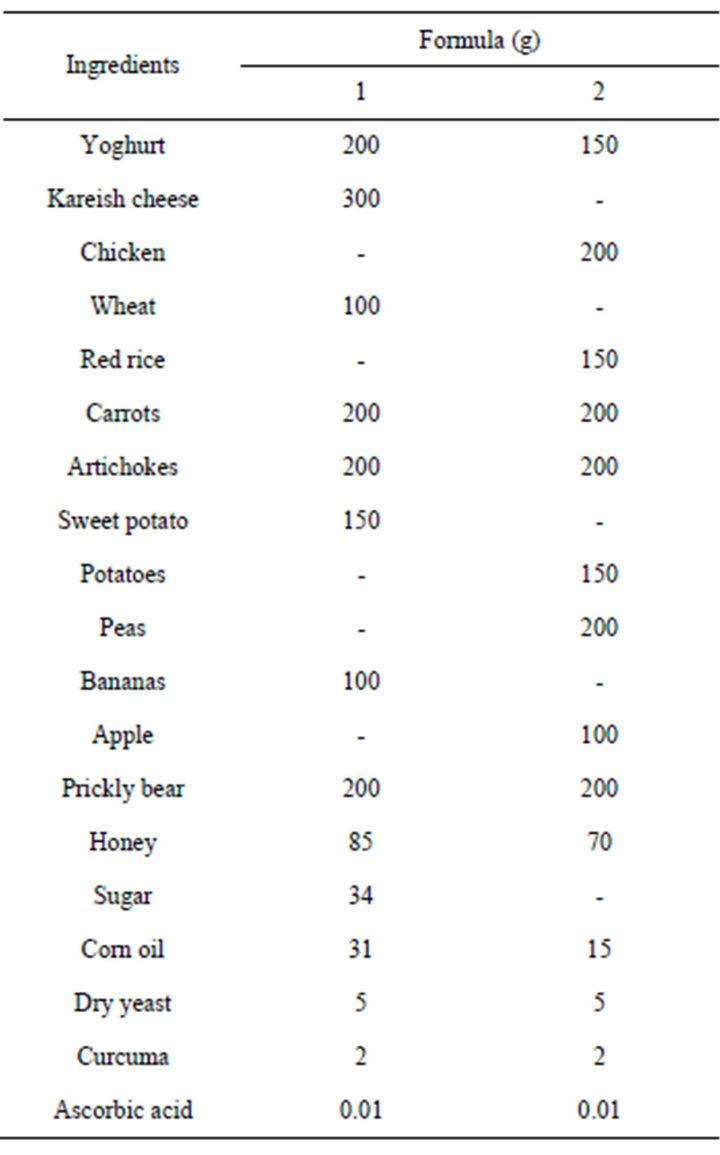
Table 1. The composition of prepared formulas.
Calorific value of the prepared formulas was calculated using factors as described by FAO [27] by using the following equation:

2.2.4. Biological Evaluation of Tested Formulas
36 male rats were fed on a basal diet according to AOAC [28] for one week as adaptation period. Basal diet was consisted of 15% casein, 10% corn oil, 5% fibers, 4% minerals, 1% vitamins mixture and 65% corn starch according to AOAC [26]. Rats were randomly divided into 6 groups, (each comprised of 6 rats). Group 1 served as normal rats where fed on balanced diet containing casein all over the study period (five weeks). Group 2 was normal rats fed on formula 1, group 3 was normal rats fed on formula 2, group 4 was CCl4 treated rats fed on basal diet, group 5 was CCl4 treated rats fed on formula 1 and groups 6 was CCl4 treated rats fed on formula 2. Carbon tetrachloride (CCl4) induced hepatotoxicity by intraperitoneal injection of diluted CCl4 (0.5 ml/kg of body weight) with liquid paraffin (1:9) before administration for 3 consecutive days per week during the experimental period according to Blonde-Cynober et al. [29]. After elapse of experimental period, rats were fasted 12 h, final body weight was recorded and blood samples were withdrawn from eye vein according to Schermer [30]. The blood samples were collected and divided into two portions: the first one was orbital in tubes containing EDTA, to estimate hemoglobin concentration, red blood cell count, white blood cell count and hematocrite value and measured according to the method of Moser et al. [31] The second portion was left to clot and centrifuged for 15 minutes at 5000 rpm to obtain serum samples, and then put into dry clean Wasserman tubes, using a Pasteur pipette and kept at −20˚C in clean glass well-stoppeared vials till analysis.
Serum aspartate transferase (sAST) and serum alanine transferase (sALT) activities were measured colorimetrically according to Young [32] and Murray [33]. Alkaline phosphate (ALP) was measured by colorimetric method of Belfield and Goldberg [34]. Total bilirubin was determined by colorimetric method of Kaplan et al. [35]. Total protein was assayed by colorimetric method according to Henry [36]. Serum albumin was determined by colorimetric method according to Yang [21]. Serum globulin concentration was calculated from total protein and albumin.
2.2.5. Histopathological Changes of Liver
Examinations of livers were performed at the Histology Laboratory, Faculty of Veterinary Medicine, Cairo University according to the method of Suzuki and Suzuki [37]. Liver of tested rat groups were removed and specimens immediately fixed in 10% neutral buffered formalin for 24 h and embedded in paraffin wax. Sections of 4 - 6 micron thickness were stained by hematoxylin eosin according to the method of Bancroft et al. [38] for studying histopathological changes.
2.2.6. Statistical Analysis
Statistical analysis was carried out according to Mohan et al. [39] using PC-STAT Program. LSD used to compare the significant differences between means of treatment at P > 0.05.
3. Results and Discussion
3.1. Chemical Composition of Prepared Formulas
From Table 2, it could be stated that formula 1 had the high percentage of carbohydrates and protein content (67.67% and 17.59%, respectively). Each 100 g formula provides by 20.87% and 17.50% carbohydrate and protein, respectively of liver cirrhotic patients daily needs. Also fat content was 8.46%, which covered 19.05% of fat daily needs. Formula 1 recorded 2.76% ash while it had low amount of crude fibers (1.6%). Regarding formula 2, data in the same Table showed that the content of carbohydrate, protein, fat, ash and crude fiber were 67.58%, 18.04%, 7.72%, 2.63% and 2.51%, respectively. Each 100 g of formula covers 18.04%, 22.52% and 17.38% of daily needs of protein, carbohydrates and fat, respectively. Results indicated that each 100 g of prepared formulas 1 and 2 can provide by about 20% of the daily energy requirements of liver cirrhotic patients.
It could be concluded that the two formulas were formulated to have good amount of protein, carbohydrates and adequate amount of fat to improve malnutrition for
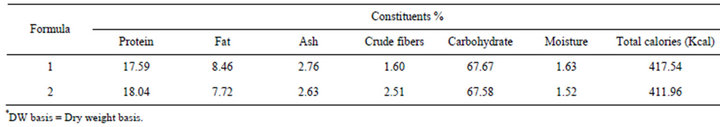
Table 2. Chemical composition of prepared formulas (on DW basis)*.
patients of mild and moderate cases of liver cirrhosis.
The patient would ingest about 500 g formula diet daily for meeting the daily caloric requirement 2000 Kcal/day in form of blenderized liquid diet. Fat restriction may be necessary for reducing the symptoms of fat malabsorption, which often accompanies diseases of the liver. Most patients with cirrhosis develop protein-energy malnutrition Ellie et al. [40].
3.2. Body (BW), Liver Weight (LW) and LW/BW Percentage
The results in Table 3 indicated that the effect of two prepared formulas on CCl4 induced changes in body weight and liver weight of rats. After 5 weeks of CCl4 treatment, the average weight of rats decreased from 231.0 (G1) to 153.0 g (G4). There is a significant decrease in weight in treated rats with CCl4 than those fed on the two prepared formulas (G5 and G6). The average weight of the rats treated with CCl4 and fed on tested formula 1 (G5) was 212.33 g, meanwhile the weight average of G6 CCl4 treated rats fed on formula 2 was 237.0 g. Data revealed that a significant (P < 0.05) increase among the liver weight of all rats treated with CCl4 (G4, G5, and G6), and the normal groups (G1, G2 and G3), was noticed. Group 4 had the highest liver weight (12.55 g) and had significant differences between its values and all the tested groups. No significant difference was observed between liver weight of rats in group 5 and 6.
It is also clear that, the relative weights (LW/BW) of liver were significantly increased in rats treated with CCl4. Group 4 had the highest LW/BW ratio (being in 8.08 g) followed by G5 and G6. G1, G2 and G3 showed the lowest values in LW/BW ratios. Consequently, values of liver’s weight (LW) among 6 groups showed the same trend as that shown in LW/BW. No significant difference was noticed between G5 and G6 of LW/BW ratio. It could be noticed that the toxicity of CCl4 is related to loss in weight and increase in liver weight in rats. At the same time, the two prepared formulas reduced the changes in body weight and liver weight caused by CCl4 in rats.
The results coincide with those of the experiments with Tungstste and Fe-TPEN, both of which are known to counteract the liver-specific toxicity of CCl4 [41,42].
3.3. Hematological Indices
Table 4 presents some hematological indices such as blood hemoglobin (Hb) level, erythrocyte count (RBC’s), leukocytes count (WBC’s) and the percentage of hematocrit (HCT). The obtained data in Table 4 revealed that G4 rats showed a significant decrease (P < 0.05) in all values of hematological parameters (11.56, 6.6, 6.7 and 38.93, respectively) compared with other groups and this is may be due to the bad effect of CCl4 on hematological parameters. The obtained data were matching with those findings reported by Colli and Webster [43] who found that the routine of hematological parameters for patient with liver disease is often abnormal.
Treated rats with CCl4 fed on formulas 1 and 2 showed no significant decrease in their values except RBCs count compared with those of groups 1, 2 and 3 rats. However, the differences between values of RBCs count in G5 and G6 rats and those in groups 1, 2 and 3 were significant.This reduction was not as high as that in G4 rats (6.6 ± 0.6 ´ 106 ml). It could be concluded from the results that formulas 1and 2 could played an important role in improvement of hematological indices in liver cirrhosis rats. This may be ascribed to the effective agents existed in used formulas constituent.
WBCs count strongly significantly decrease in G4, while WBCs count showed no significant increase in G5 and G6 rats. Data in the same Table disclosed the percentage of hematocrit which decreased significantly in G4 compared with the normal groups. While group 5 and 6 showed nonsignificant decrease in HCT amounted being 44.7% and 44.6% compared to normal groups (2 and 3).
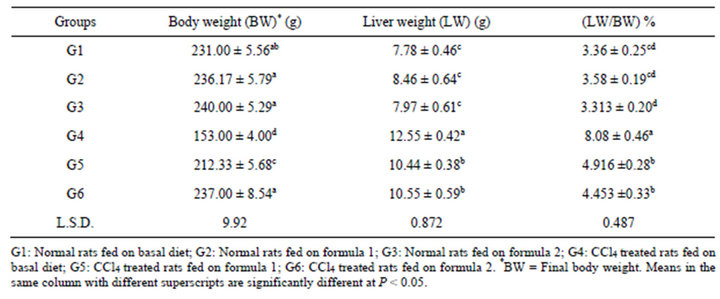
Table 3. Body (BW), liver weight (LW) and LW/BW percentage of rats fed on prepared formulas.

Table 4. Some hematological indices of rats fed on tested formulas.
3.4. Liver Enzyme Activity
Regarding the enzyme activities of alanin aminotransferase (ALT), asprtate aminotransferase (AST), alkaline phosphatase (ALP), as well as total bilirubin, results in Table 5 show significant increase in ALT and AST activities in G4 rats. The increasing percentage was 37.49 and 48.82%, respectively compared with normal control rats (G1). No significant differences were noticed between G5 and G6 for those two enzyme activities. On the other hand, data showed no significant difference between G6 and normal group 3 in ALT and AST activities. These results are in agreement with Mohamed and Al-Okbi [19] who reported that feeding liver cirrhotic rats the special formulas showed significant reduction in activity of AST and ALT and total bilirubin.
Concerning alkaline phosphatase activity (ALP), data in Table 5 showed significant increase in ALP activity in all CCl4 treated rats (G4, G5 and G6) compared with normal control rats (G1, G2 and G3). This result revealed that the toxicity of CCl4 is related to increase in liver enzyme activities in rats. It could be concluded that the enzyme activities of G5 as well as G6 decreased by feeding on formulas 1 and 2 than those in G4. In this respect, Kazeem et al. [44] indicated that the increase in ALT activity lead to liver cells necrosis and the degree of increase is correlated with the extent of necrosis. While, the increase of AST activity is specific for hepatic injury.
Administration of CCl4 produced significant increase in total bilirubin values in G4 rats (0.78 mg/dl) compared with normal control G1 (0.29 mg/dl). Mean while, there was little increase in total bilirubin of G5 compared with normal control rats (G2) being 0.26 and 0.21 mg/dl, respectively and no significant difference between them. G6 showed no significant difference in bilirubin values compared to G3. Moreover, no significant difference was found between G5 and G6 (0.26 and 0.24, respectively). In this concern Kazeem et al. [44] reported that as a matter of fact, the severity of liver synthetic dysfunction is estimated by measuring bilirubin.
Generally, it could be concluded that CCl4 treated rats fed on tested formulas (1 and 2) improved liver function reflected in the significant reduction of the activity of serum ALT, AST, ALP and bilirubin compared to G4 rats. This may be due to the presence of appreciable of branched amino acids (BCAA) found in yoghurt, kareish cheese and red rice which improve plasma amino acids imbalance, protein metabolism, nutritional status and decreased frequency of complications in liver cirrhosis patients as mentioned by Adawi et al. [45]. Furthermore, Adawi et al. [45] reported that BCAA supplementation improves hypoalbuminemia in decompensated cirrhosis.
In addition, Mehmetcik et al. [46] indicate that phytochemicals in grains and fruits have obtained great attention for their potential roles in human disease. Phenolics were considered as a major group of compounds that contribute to that antioxidant activity. Using fruits, vegetables, prickly pear and artichoke extract has been shown to prevent oxidative stress induced hepatotoxicity in rats.
Prickly pear has received considerable attention in the scientific community for its bioactive compounds, which may provide health benefits beyond basic nutrition. A part from antioxidant vitamins C, E and carotenoids, with vit. C being the most important quantitavely [47].
Chen et al. [48] reported that honey used as a sweeter in the formulas considered as a source of antioxidants. Apples are healthy fruit in many historical cultures become they rich in phytochemicals, particularly carotenoids, flavonoids, isoflavonoids and phenolic acids [49, 50].
Cooking caused a further loss of antioxidants, but when there was a full uptake of cooking water by the grains that loss was limited [51].
3.5. Total Protein, Albumin and Globulin
The results presented in Table 6 cleared the other indices of liver function evaluation such as serum total proteins,
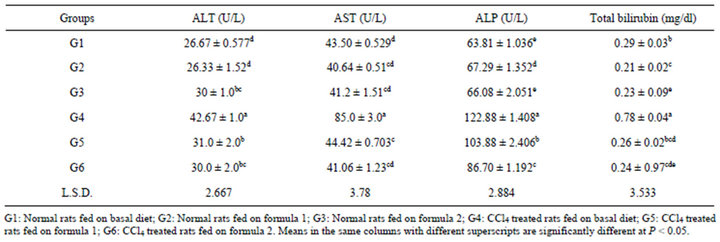
Table 5. Alanin aminotransferase (ALT), asprtate aminotransferase (AST), alkaline phosphatase (ALP) and total bilirubin of serum rats fed on prepared formulas.
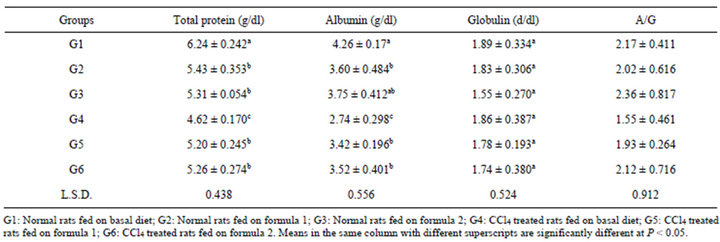
Table 6. Total protein, albumin, globulin and A/G ratio of serum rats fed on the prepared formulas.
albumin, globulins, as well as A/G ratio of rats. Data showed that there was a significant reduction in the total protein for G4 compared to normal control rats (G1), the reduction percentage was 35.06%. Mean while, no significant difference were noticed among G2, G3, G5 and G6. Mohamed and Al-Okbi [19] found an improvement of liver cirrhotic rats fed on special formulas had significant increase of body weight gain together with plasma albumin. This may be due to presence of appreciable percentage of BCAA which improve plasma amino acids imbalance as well as protein metabolism in patients with liver cirrhosis decreased frequency of complications of cirrhosis and improved nutritional status [52,53].
Serum albumin showed significant decrease in G4 compared to G1 (2.74 and 4.26 g/dl, respectively). How ever, no significant difference among G2, G3, G5 and G6.
Data in the same Table revealed that no significant differences were noticed among all groups in globulin. All CCl4 treated rats showed decrease in A/G ratio. The reduction percentages were 40.0%, 4.66%, 11.32% for groups (G4, G5 and G6), in succession.
From the above mentioned data, it could be concluded that CCl4 treated rats fed on the two prepared formulas (1 and 2) showed an improvement in their liver function which reflected in significant reduction in the aforementioned parameters. In the same time these groups (5 and 6) had no significant differences among them and the normal control rats.
3.6. Histopathological Changes
Figures 1-4 show the histopathological changes of rat livers at the end of experiment. Data indicate that rat livers of G1 and G2 revealed no histopathological changes (Figures 1 and 2). Meanwhile, the liver of normal rats (G3) fed on formula 2 showed slight activation of kupffer cells (Figure 3).
Liver of G4 showed congestion of central vein and hepatic sinusoids (Figure 4). Group 5 showed no histopathological changes in liver (Figure 5). Liver of G6 (rats fed on formula 2) showed activation of kupffer cells (Figure 6).
Mehmetcik et al. [46] revealed that the artichoke prevented the oxidative stress induced hepatotoxicity in rats.

Figure 1. Histopathological photograph of liver for normal rats fed on basal diet (H and E ´ 200).
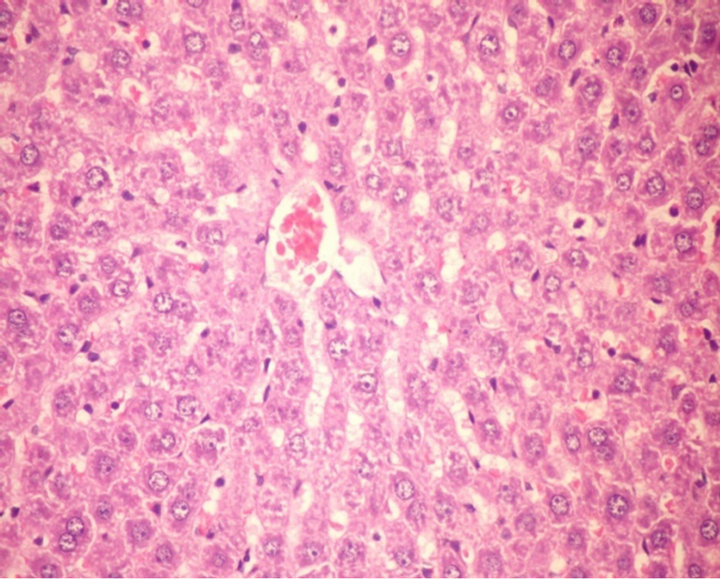
Figure 2. Histopathological photograph of liver for normal rats fed on tested formula 1 (H and E ´ 200).

Figure 3. Histopathological photograph of liver for normal rats fed on tested formula 2 (H and E ´ 200).

Figure 4. Histopathological photograph of liver for CCl4 treated rats fed on basal diet (H and E ´ 200).
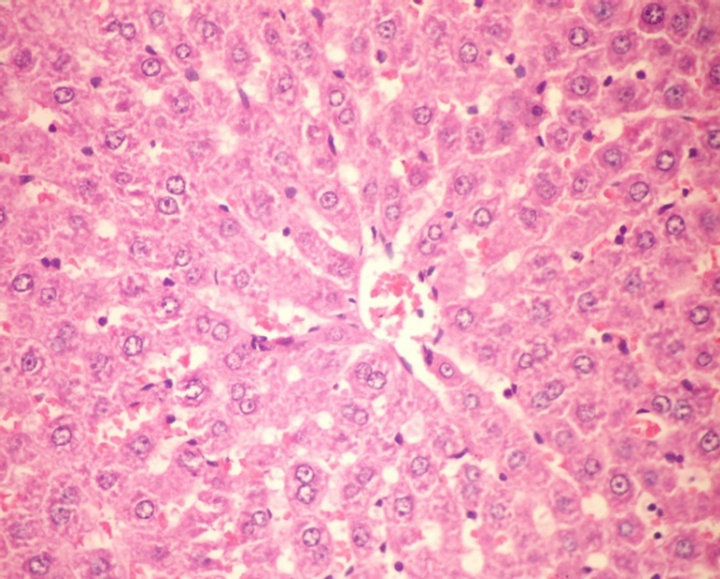
Figure 5. Histopathological photograph of liver for CCl4 treated rats fed on formula 1 (H and E ´ 200).
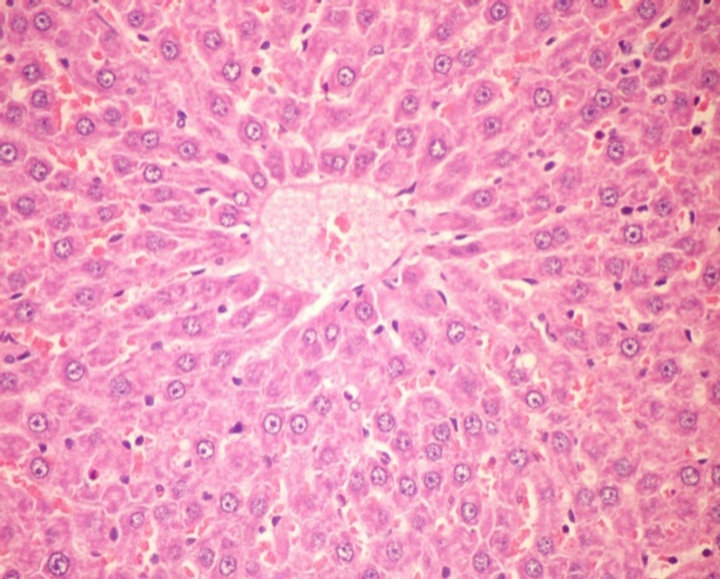
Figure 6. Histopathological photograph of liver for CCl4 treated rats fed on formula 2 (H and E ´ 200).
4. Conclusion
It could be concluded from the results that the two formulas were formulated to have good amount of protein, carbohydrates and adequate amount of fat to improve malnutrition for patients of mild and moderate cases of liver cirrhosis. It is also clear that, the weights ratios (LW/BW) significantly increased in rats treated with CCl4 followed by other groups. It could be noticed that the toxicity of CCl4 is related to loss in weight and increase in liver weight in rats. At the same time, the two prepared formulas reduced the changes in body weight and liver weight caused by CCl4 in rats. Formulas 1 and 2 could play an important role in improvement of hematological indices in liver cirrhosis rats. Both special prepared formulas improved liver function in cirrhotic rats reflecting their potential beneficial use in patients with liver cirrhosis and this may be ascribed to the effective agents and different antioxidant sources existed in used formulas constituent. There was a significant increase in total protein, albumin and globulin in plasma. There are no histopathological changes in all groups under study except group 4 which orally administrated with CCl4.
5. Acknowledgements
Authors would like to thank the Department of Food Science and Technology, Faculty of Agriculture, Cairo University and Food Technology Research Institute, Agricultural Research Center for ongoing cooperation to support research and that provided funds and facilities necessary to achieve the desired goals of research.
NOTES