Study of Human Serum Albumin Adsorption and Conformational Change on DLC and Silicon Doped DLC Using XPS and FTIR Spectroscopy ()
1. Introduction
Analysing the interaction of proteins with the surfaces of materials intended for biomedical applications is fundamental for understanding cellular events and the overall host response. Furthermore, the importance of a variety of molecules in the biomedical field is known for several applications, including drug delivery, biomaterials, extracorporeal therapy and solid-phase diagnostics [1]
Both the nature of the biomaterial and the protein has effects on the adsorption process. The most significant surface properties of biomaterials, including the elemental composition, functional groups and surface energy are very important. All of these parameters play a role in enhancing or decreasing the adsorption of proteins or biological compounds during the implant.
Diamond like carbon (DLC) is an ideal candidate for use as biocompatible coatings on biomedical implants [2] such as coronary artery stents [3], artificial hearts, mechanical heart valves [4], hip and knee replacements [5] and rotary blood pumps [6]. Furthermore DLC possess a unique combination of desirable properties including chemical inertness, high density, heamocompatibility and poor coefficient of friction [7].
Comparative studies improved doped DLC possesses better surface biocompatibility than the undoped counterpart [8]. Thus, to enhance the biocompatibility of DLC, the incorporation of third element dopants like nitrogen [9], fluorine [10], silicon [11] and titanium [12], may be necessary.
Silicon modification has been greatly applied in medical devices and many investigations reported the chemical stability of silicon doped DLC [13]. Silicon incorporation into DLC has been proven to overcome some of the stated drawbacks, including low intrinsic compressive stress, good adhesion, and mechanical resistance which are beneficial for biomedical applications [14,15]. Investigators have found an improvement in blood compatibility with silicon doped DLC film where a decrease of inflammatory reactions was observed as compared to undoped DLC [16].
To improve the understanding of the fundamentals of protein adsorption, many protein adsorption-modelling approaches have been successfully used.
In this contribution, we explore the coating of silicon wafer substrate with DLC and silicon doped DLC thin films using plasma enhanced chemical vapour deposition (PECVD). The adsorption of human serum albumin (HSA) on these films is investigated, since its adsorption onto surgical instruments and medical devices is likely to dominate in vivo due to its abundance in human serum. The physico-chemical properties of adsorption process were evaluated by different techniques using X-ray photoelectron spectroscopy (XPS) and Fourier Transform Infrared (FTIR).
The aim of this study is to illustrate the conformational changes in HSA upon attachment to DLC and Si-DLC surfaces, in order to improve our understanding of the dynamic phenomena in protein adsorption.
2. Experimental and Methods
2.1. Preparation and Modification of DLC
Before deposition of the films, silicon wafers 1.5 × 1.5 cm2 were cleaned gently and sonicated for 5 min in acetone and isopropanol (1:1) followed by washing with distilled water and then dried using nitrogen gas. Doped and undoped diamond like carbon (DLC) were deposited on cleaned substrates by the radio frequency (RF) 13.56 MHz Plasma Enhanced Chemical Vapour Deposition (PECVD) using a Diavac model 320PA (ACM Ltd.), with negative electrode self-bias voltages set at 400 Volt. The experimental equipment had been described previously in details [17]. The clean substrates are placed in the deposition chamber on top of a water-cooled electrode driven by an RF power supply.
When the chamber pressure reached ~5 × 10⁻⁶ Torr an Argon gas flow rate of 60 mL/min was used for substrate surface cleaning. The films were prepared under the following conditions: C2H2 was used as source gas; Argon (Ar) and tetramethylsilane (TMS) (Si(CH3)4 [%99.8 SigmaAldrech]) were used as dopant source. The argonacetylene flow ratio (Ar to C2H2) was fixed at (10:20) standard cubic centimetre (sccm), and the deposition time was fixed for (5) minutes. To prepare the Si-DLC samples, the various doping concentrations of silicon were achieved using TMS, and a detail of the parameters is given in Table 1.
Table 1. The deposition conditions of DLC and Si-DLC samples using rf-PECVD system.
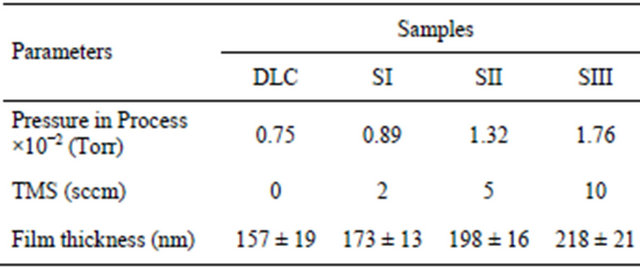
Bias voltage: 400 volt, deposition time: 5 minute, (TMS): Tetramethylsilane, (sccm): standard centimetre cube per minute, Ar: C2H2 ratio: 10:20 (sccm), (nm): nanometre, Initial chamber pressure: ~5 × 10⁻⁶ Torr, (±) is SD for n = 7 samples.
2.2. Adsorption of Human Serum Albumin (HSA) on DLC and Si-DLC Samples
Human serum albumin (HSA) [from Sigma Aldrich] was prepared in phosphate buffer saline (PBS) [from SigmaAldrich] to give solution having concentration of 250 µg/ml and the pH was adjusted at 7.4.
The prepared samples were immersed in the 10 ml of HSA solution (250 µg/ml) separately in sealed jars and incubated for 60 minute at 37˚C ± 1˚C using thermostatic shaker bath. After the period time, the samples were then washed twice with distilled water and dried using nitrogen gas.
2.3. Surface Characterisation
XPS measurements were obtained using a KRATOS XSAM 800 equipped with an energy analyser. The X-ray source employed was Al Kα X-ray source (hv1486 eV) generated from aluminium anode operating at the emission voltage at 15 keV and 5 mA. The base pressure within the spectrometer during examination was ~8 × 10⁻¹⁰ bar. All spectra were referenced by setting the hydrocarbon C1s peak to 285.0 eV to compensate for residual charging effects.
The film thickness of the prepared samples was obtained using a stylus profilometer (Dektak 8 Advanced Stylus Profiler Veeco Instruments Inc., USA). Automatic levelling was selected and system based software performed average step height calculations.
The chemical bonding configurations were characterized by Fourier transform infrared spectroscopy FTIR at room temperature using BIORAD Excalibur (FTS 3000 MX series) instrument, to investigate the various chemical vibrational modes the spectrum was recorded in the region of 4000 - 400 cm−1 and 60 scans were accumulated at a resolution of 4 cm−1. In all of the FTIR experiments the background spectrum was collected before the actual sample analysis using the relevant unattached coated samples with Human serum albumin (HSA) and this signature was subsequently removed from the sample scan. The subsequent analysis of the attached HSA on the DLC and Si-DLC samples was performed.
3. Results and Discussion
3.1. Surface Characterisation of Prepared Samples
The film thicknesses of DLC and Si-DLC samples have been obtained and the values were arranged from ~(157 - 218) nm, the growth rate of film deposition was around (38 ± 6) nm·min−1 (Table 1).
Figure 1 shows the survey scan of XPS spectra of doped and undoped DLC. The main peaks were observed at ~285.1 eV, and ~531.4 eV, corresponding to C1s and O1s, bands, respectively. The addition peak was revealed at 100.7 eV [in case of silicon doped DLC] which attributed to Si2p.
C1s spectrum of DLC has been deconvoluted in to three different peaks. The first band located at 284.7 eV, is related to the sp2 hybridized carbon (C=C). A band at 285.3 eV, is corresponded to a sp3 carbon (C-C), and last peak was obtained at 287.4 eV, can be related to the (CO) bonds (Figure 2). The carbon atom percentage in the DLC is determined as 86.70% (Table 2).
It has been observed that the presence of silicon in the film affected the binding energy by causing a slight lowering in the energy accompanied by a broadening of the C1s peaks with FWHM of 2.5 eV, which increased with increasing silicon concentration in the films. The C1s spectrum of Si-DLC yielded four deconvoluted peaks; at 283.9 eV [Si-C], 284.7 eV [C=C], 285.3 eV [C-C], 287.3 eV [CO] [18]. On the other hand, the intensity of both Si-C and C-C increased with increasing the silicon concentration in the films, the results agree with those obtained by Zhao et al. [19].
The properties of the DLC thin films depend mainly on its structure resulting from combination of sp3 bonding (Diamond form) and sp2 (graphite form). The sp3 to sp2 ratio is dependent on the deposition process and its parameters. The incorporation of silicon into DLC leads to the decrease of C=C (Sp2) bonded with increase of C-Si contribution, while the amount of the C-C bonding (sp3) remained relatively unaltered. The results show that silicon atoms preferentially substitute the sp2 hybridized carbon atoms during film formation. Then one may conclude that silicon content can increase the sp3/sp2 ratio in the film (Figure 3). This tends to improve the compatibility of the implant with blood components [20].
The XPS O1s spectra of DLC and Si-DLC samples were located at ~531 eV (Figure 4). Deconvolution of the O1s band gave two sub peaks around 531 eV and 532 eV, which are attributed to (C=O) and (C-O) bond in the film structure, respectively.
The results of the XPS analysis of the O1s region of the Si-DLC samples showed that the oxygen concentration in the films increases with increasing silicon flow rate, (Table 2). The obtained results are in good agreement with those provided previously determined values [11].
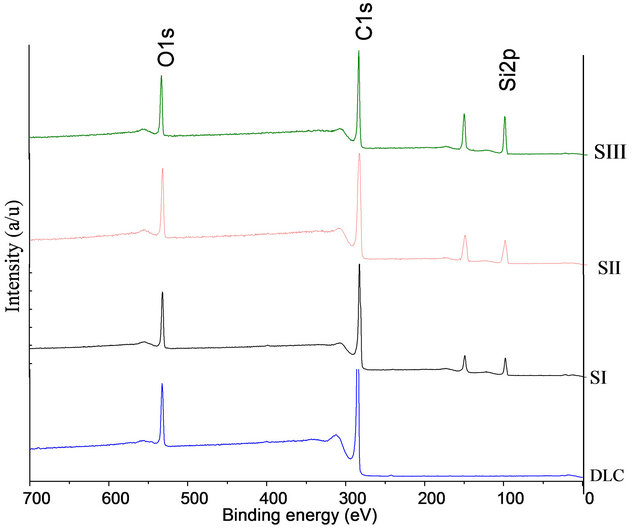
Figure 1. XPS survey scans for DLC and Si-DLC (SI, SIII and SIII) samples.
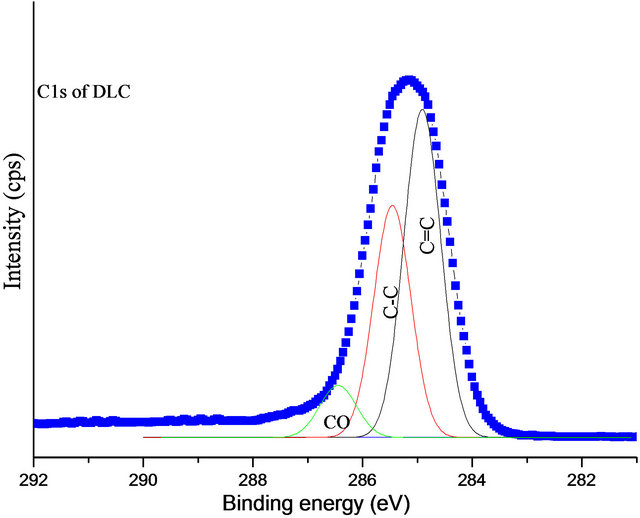

Figure 2. XPS C1s spectra deconvolution of DLC and Si-DLC samples.
Table 2. XPS survey data (atomic percentage) for the elements on to surface of samples before and after adsorption of HAS.

On the other hand, the band related to silicon atom (Si2p) appeared at around 101 eV. The fitted band of Si2p gives two sub-peaks centred at 100.6 eV and 102.3 eV can be assigned to Si-C and Si-O bonds, respectively. The quantitative analysis of atomic percentage of silicon content DLC gives 4.4, 9.6 and 16.8 for SI, SII and SIII, respectively (Table 2).
Figure 5 shows the FTIR spectrum of doped and undoped DLC samples. Bands located at around 1450 cm−1 and 896 cm−1 are assigned to the stretching and bending of C-C sp3 hybridization respectively, and a medium band at 1210 cm−1 can also be assigned to the sp3 bond of carbon hybridisation [21]. This indicates the formation of tetrahedral carbon structures in the DLC films and the inclusion of hydrogen. The peak at ~727 cm−1 belongs to the out of plane bending configuration of the graphite like carbon [22]. A weak peak at 1624 cm−1 is assigned to carbon double bond hybridization. In addition to the
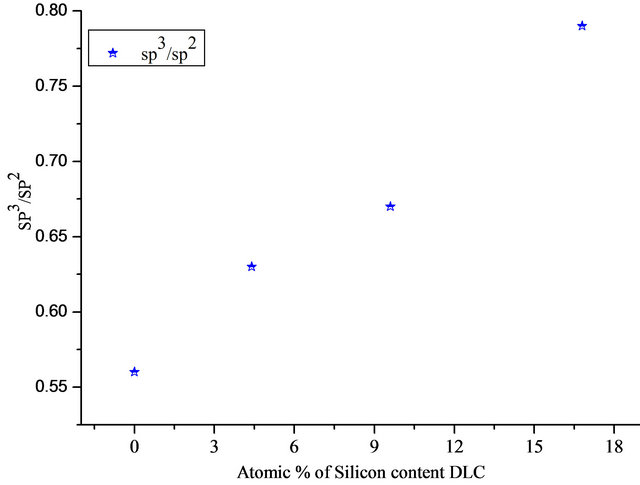
Figure 3. sp3/sp2 ratio in relation to atomic present of silicon content DLC.


Figure 4. The XPS O1s and Si2p spectra of deposited samples.
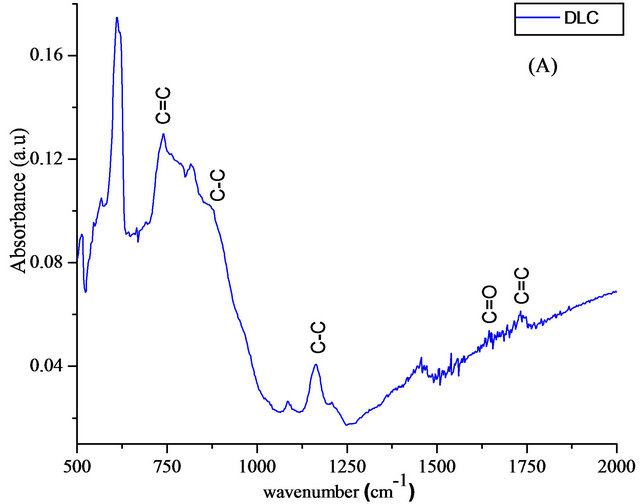

Figure 5. FTIR spectra of DLC (A) and Si-DLC (B).
bands at 905 cm−1 and 1192 cm−1 which is return to the C-C bonds, too. For Si-DLC samples, the bands have been detected at 880 cm−1, attributed to the Si-CH bond [23]. in addition, the deformation vibration of Si-CH3 bond was observed at 1263 cm−1 and a band appeared at around 1359 cm−1 suggested the presence of stretching vibration of Si-CH2-Si bonds. The results are agree with those achieved by Finer et al. [24].
3.2. Characteriztion of Surfaces after HSA Adsorption
XPS was used to investigate the chemical surface composition during the HSA adsorption. The survey scan XPS spectrum of adsorbed HSA on the DLC and Si-DLC surfaces is presented in Figure 6. The results showed that a new signal at 400 eV has observed is assigned to N1s band, and the C1s band intensity was significantly changed, along with a reduction in the Si2p intensity (in case of Si-DLC). Furthermore, a weak band was detected at 164.1 eV in the high-resolution analysis of the S2p which can be attributed to sulphur atoms in cysteine amino acid [25]. These data indicate the presence of the protein on the surfaces [26].
High resolution analysis of the C1s peak after adsorption of protein was quite different from the samples prior to protein adsorption. The deconvolution of the C1s peak gave four different bands. The first component located at ~285.2 eV which assigned to saturated and unsaturated hydrocarbon groups. A peak at 286.7 eV is related to C-NH amine groups and the last peak detected at around 288.4 eV is for the peptide bond HN-C=O, (Figure 7).
After peak fitting of the N1s core-level spectrum, three deconvoluted peaks were observed at 399.7 eV (73%), is attributed to (C-N), a peak showed at 401.7 eV (19%) assigned to N-C=O and N-H bonded [27], and the third band was appeared at 402.8 eV (8%) is returned to positively charged amines ( ). The
  component of N1s spectrum of Si-DLC samples shifts to a higher binding energy with a slight increase in band area, compared to the same band in undoped DLC. This might evidence that the HSA was adsorbed on to surfaces via carboxylic acid group [17].
The O1s band after protein adsorption is similar to that without protein, suggesting that the most of the signal is attributable to carbon oxides and surface OH groups (Figure 7). The amount of protein adsorbed onto a surface, can be related to the intensity of C1s peak. Hence, based on the C1s intensity, the relative amount of adsorbed HSA increases with increasing silicon doped DLC. Therefore, doping of DLC may allow control of protein adsorption to the surface.
Fourier Transform Infrared (FTIR)
FTIR spectroscopy can be used for identification of the functional group and showing different vibrational modes of various bonds which are present in the film. Figure 8 shows the FTIR spectrum of free and bounded HSA on to surface of coated DLC. The bands centred at around 1650 cm−1 and 1550 cm−1, which correspond to amide I and amide II, respectively. The location of both the Amide bond orientation are sensitive to the secondary structure of a protein, because both groups of C=O and the N-H bonds are involved in the hydrogen bonding that takes place between the different elements of secondary
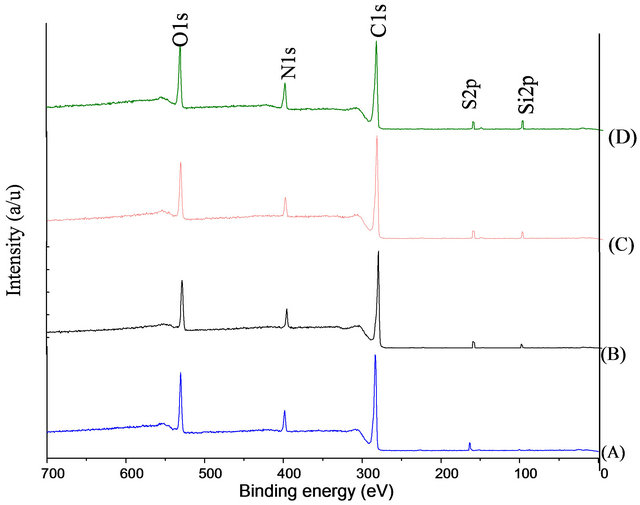
Figure 6. The XPS survey scan for DLC and Si-DLC surfaces.


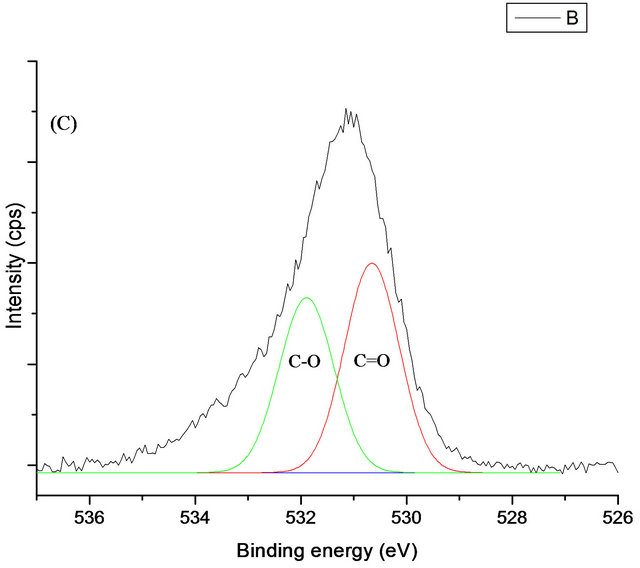
Figure 7. The XPS C1s (A), N1s (B) and O1s (C) spectra for adsorbed HSA onto DLC and Si-DLC.
structure [28]. The Amide I band of free HSA, is located at 1650 cm−1, whilst in case of adsorbed HSA onto doped DLC, the same band observed at around 1641 cm−1. A quantitative analysis of the amide I region can be estimated by curve fitting confirms the gradual evolution in the secondary structure content.
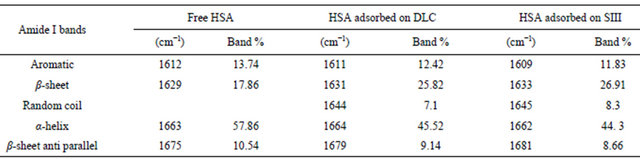
To investigate changes in the secondary structure of HSA after it is conjugated to the coated DLC surface, the deconvulation and second derivative of amide I band has been applied. Spectral deconvolution resolved four peaks for the amide I band for the free HSA, (Figure 9). A band located at 1612 cm−1 which is correlated to aromatic rings. The second component was seen at 1629 cm−1 and can be attributed to β-sheet structure [29]. Band at around 1663 cm−1 is related to α-helix [30], and the last fitted peak detected at 1675 cm−1 which is return to antiparallel β-sheets components [31]. The quantitative analysis of the amide I spectra of free HSA peptide indicates that there is more than 57% of α-helix and ~17% of β- sheet conformation (Table 3). The obtained results are in good agreement with the data reported by Bouhekka et al. [32].
Whilst the deconvulated of the same band after adsorption of HSA on to surface of samples, gives five secondary peaks at ~1611 cm−1 (aromatic ring), ~1630 cm−1 (β-sheet), 1644 cm−1 (random coil), 1664 cm−1 (α-helix) and ~1679 cm−1 (β-sheet anti parallel). The β-sheet is slightly increased from (17% to ~25%). Furthermore, a decrease in α-helical contribution is observed from (57% to 45%) (Figure 9). These could be attributable to the enhancing of HSA aggregation on to surfaces. The results are similar to those obtained by Khan et al. [33].
The amide II is arising from the in-plane N-H bending mode (40 - 60)% of the potential energy, and the rest of

Figure 8. FTIR Spectra of HSA before (A) and after adsorbed on DLC (B), SI (C), SII (D) and SIII (E) surfaces.
the potential energy emerges from the C-N (20 - 40)% and C-C about 10% stretching vibrations [34]. In case of free HSA, the amide II shows a maximum of absorbance that shifts from 1559 cm−1 to lower wavenumbers (1553 cm−1) upon HSA adsorption onto DLC-coated surfaces. This shift can be correlated to the change of protein conformation during the adsorption [35]. In all these processes a hydrogen bond plays a dominant role in deciding the structure of the aggregate [36].
4. Conclusions
The results indicated that DLC films are established to consist of a mixture of tetrahedral (sp3) and trigonal (sp2) bonding. XPS data showed that the sp3/sp2 ratio increases with increasing silicon concentration in the DLC film. Furthermore, FTIR analysis showed that silicon incorporation DLC gives rise to the formation of Si-C bond, which tends to increase in the fraction of sp3 bonded carbon in DLC film.
Followed by exposure to protein, a new band of nitrogen (N1s) appeared at the XPS spectra of the doped and undoped DLC surfaces. As well as a specific broad peak was observed at ~288.4 eV could be assigned to peptide
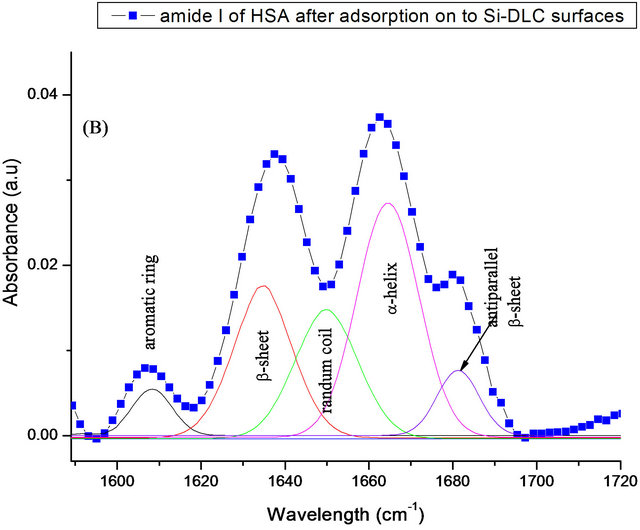

Figure 9. Curve-fitting analysis of the amide I in FTIR; for free HSA (A) and adsorbed on SIII (B).
Table 3. FTIR analysis of the amide I band of free and adsorbed HSA onto DLC and Si-DLC samples.
bond. In addition of, the presence of protonated amino groups ( ) at 402.6 eV, this might suggesting that HSA bounded on the surfaces through the carboxyl group and the amino group has not interact strongly with the surface.
FTIR spectra revealed the presence of amide I and II at 1650 cm−1 and 1559 cm−1 belonging to protein. The results also suggested that relatively the adsorbed amount of HSA increased with increasing of silicon content on the DLC film. The presence studies have revealed that modifying the surface of DLC by incorporation of silicon can improve its biocompatibility of the implant; however, further studies are required to obtain a better understanding of protein adsorption in vivo.
5. Acknowledgements
The authors would like to thank all of the staff at Northern Ireland Bio-Engineering Centre (NIBEC), University of Ulster for their support, and also thanks to Sandra Adamson at LG, for her technical assistance.
NOTES