Estimation of Radiation Dose in CT Chest and Abdomen Examinations Using Size-Specific Dose Estimates ()

1. Introduction
The use of CT scanners is continually increasing [1] , because they provide high-quality images in the MPR and 3D views [2] with very fast acquisition time [3] . The quality of the images is characterized by high spatial resolution, low noise level, and high contrast to differentiate between different tissues densities [4] . CT scan is considered a powerful modality, but unfortunately, it contributes to most of the medical dose experienced by patients. The International Atomic Energy Agency (IAEA) reported that CT scans were used for approximately 25% of all radiological examinations and contributed to approximately 60% to 70% of the total dose from radiological examinations [5] . Bauhs et al. reported that the effective dose from a thoracic CT examination was about 5 - 7 mSv, while the effective dose from a conventional thoracic X-ray examination was only 0.1 - 0.2 mSv [6] . It is well known that the risk of cancer increases with increasing radiation dose, so that the high dose from CT is very concerning [7] . Therefore, it is very important to accurately estimate the patient dose and reduce it as low as possible [6] . CT technology will continue to change at a rapid pace, and radiologists, technologists, physicists, and department administrators will all need to reevaluate existing practice strategies and examination protocols to successfully integrate patient safety with complex CT scanners into their practice. This expected increase in utilization must be accompanied by awareness and understanding of radiation dose issues. In addition, as CT technology develops, the revision or updating of existing definitions, particularly with respect to CT dosimetry, may be required [8] .
The CTDIvol depends on exposure parameters, e.g. tube voltage, tube current, pitch, and so on. However, CTDIvol is considered to be an output dose indicator only and not a patient dose indicator, because the dose to the patient not only depends on the output dose, but also depends on the patient’s characteristics [9] [10] . The patient dose indicator which considers both output dose and patient characteristics is the Size-Specific Dose Estimate (SSDE) [11] .
The most obvious patient characteristic is the effective diameter (Deff) [11] . But this alone is not sufficient to determine the patient’s characteristic because different parts of the patient are composed of different materials [12] [13] [14] [15] . Air (lung) is the biggest contributor in the thoracic region, and soft tissue is the biggest contributor in the abdominal region. Therefore, although the thorax and abdomen may have the same effective diameter, the dose received by each of them will not be the same. The revised descriptor for patient characterization is the water equivalent diameter (DW) [16] .
Recently, the American Association of Physicists in Medicine (AAPM) report 204 [11] has proposed a new method, “Size-Specific Dose Estimate” (SSDE) to represent more accurate estimations of patient doses. SSDE considers patient size in order to enable users to optimize CTDIvol based on patients’ physical dimensions. The look-up tables of this report provide conversion factors that can be applied on CTDIvol to calculate SSDE for appropriate phantom sizes (16 and 32 cm). Conversion factors are based on 4 different measurements of torso or head thickness to represent patient size: the anteroposterior dimension (AP), the lateral dimension (LAT), the sum of the dimensions (AP + LAT), and the effective diameter (square root of the product of AP and LAT), which can be measured from either scout radiograph or transverse CT images [11] .
Finally, SSDE cannot be used for the estimation of organ dose, and thus, it cannot be used to estimate effective dose, which is not intended for individual patient dose estimation. In spite of these limitations, the estimation of patient dose with SSDE from radiation exposure metrics such as CTDIvol is a great step forward in monitoring and controlling the CT imaging radiation dose for each patient scan [10] .
We hypothesize that there may be significant dose differences between CTDIvol and calculated SSDE and then later on the calculations may be significantly affected by the method of obtaining the patient dimensions.
The purposes of this study are to estimate the radiation exposure dose for adult patients undergoing chest and abdomen CT examinations at Khartoum state hospitals using Size-Specific Dose Estimates (SSDEs) and investigate the effect of body dimensions (Deff) on SSDE calculated from transverse or scout images.
2. Material
2.1. Sample Size
The study sample size was consisting of 330 patients (165 chests and 165 abdomens) and used probability random selection sampling technique from monitor of CT machine excluding patients’ age below 15 years old. All the patients came to the Computed Tomography (CT) department with abnormal size and shape of organs and contrast media administration.
2.2. Equipment for Data Collection
Table 1 summarizes the characteristic of the Multi-Slice Computed Tomography (MSCT) systems included in this study. To elaborate, two CT scanners were from Toshiba (16-slice), one was from General Electric (16-slice) and one was from Siemens (32-slice), as shown in Appendices (Figures A1-A5).
2.3. Quality Control Measurements
All the participants machines monitor calipers quality were assessed by any known diameter phantom to correct the taken patient dimension if there any. Table 2 shows the quality measurement test, as shown in Appendices (Figures A6-A8).
![]()
Table 1. Summary of characteristic for the CT systems used in this study.
![]()
Table 2. Monitor calipers quality measurement test.
3. Methods
Data was collected using data collection sheets that designed to include all the variables of the study including age, gender, tube voltage, tube currant, rotation time, organ, volume CT dose index, dose length product, anteroposterior dimension from transverse image, lateral dimension from transverse image and lateral dimension from scout radiograph.
Data Analysis
Dose information and scan parameters of the patients was gradually collected from the Digital Imaging and Communications in Medicine (DICOM) dose report including: Patient information (age, gender), tube voltage, tube current, rotation time(s), organ examined, CTDIvol and DLP and 4 different measurement.
For SSDE calculations, it depends on the conversion factor, Conversion factors are based on 4 different measurements of torso or head thickness (in our case it’s torso) to represent patient size: by using digital calipers on the scanner console the anteroposterior dimension (AP), the lateral dimension (LAT), the sum of the dimensions (AP + LAT), and the effective diameter (Deff) (square root of the product of APTRANS and LAT) [11] :
[11]
which can be measured from the mid-slice location from transverse or scout CT images. The Deff was converted into conversion factors (f) as mentioned in AAPM report 204. Then, the SSDE was calculated by multiplying the console displayed CTDIvol with the size-specific conversion factors (f) [11] , in which SSDE is given in mGy, and then statistics will be analysed to study results.
[11]
Descriptive statistics was used to analyse the study results. SPSS v.21 test was used to evaluate correlations between CTDIVOL, SSDE and patient diameter in chest and abdomen CT. The correlation was considered statistically significant at p-value less than 0.05.
4. Results
4.1. Chest Results
165 CT chest were enrolled in the study. Regarding the gender in the study sample 80 patients were females with 48.5% while the males were 85 patients with 51.5% for a total of 165 patients represented in Table 3.
Regarding patient distribution for CT chest in different hospitals 30 patients (18.2%) were from Hospital A, 45 patients (27.3%) were from Hospital B, 45 patients (27.3%) were from Hospital C and 45 patients (27.3%) were from Hospital D for a total of 165 patients, see above in Table 3.
Regarding the descriptive Statistics for all CT Chest patients, where the results presented as minimum, maximum, mean and standard deviation for age, Kv, mA, rotation time, CTDIvol, DLP, DAP TRANS, D LAT, Deff and SSDE. Where for age the mean was 53.52 ± Std. Deviation 19.03, for Kv and mA were 122.73 ± 4.47 and 128.45 ± 75.67 respectively, for rot.time, CTDIvol and DLP were 0.75 ± 0.07, 11.99 ± 6.94 and 435.45 ± 227.59 respectively, for DAP TRANS and D LAT were 23.31 ± 4.57 and 31.62 ± 5.89 respectively and for Deff and SSDE were 26.72 ± 3.36 and 16.89 ± 9.82 respectively, see in Table 4.
Regarding the analysis of variance between the patients age with the measurement’s parameters for all patients from CT chest, the value showed there is no significant difference between the patients age with the D AP TRANS, D LAT and SSDE, where the value were 0.113, 0.229 and 0.211 respectively. The p-value showed significant difference between the patients age with the Deff, where the p-value was 0.049, see in Table 5.
Regarding the correlation between the SSDE with patients age for CT chest, the rate of change of SSDE was increasing by 0.0342 for each year of patients age, see in Graph 1.
Regarding the correlation between the SSDE with D AP for CT chest patients, the rate of change of SSDE was increasing by 1.4696 for each cm of patient’s
![]()
Table 3. Shows the frequency and the percentage in gender (N = 165) for CT chest different hospitals.
![]()
Table 4. Shows descriptive statistics for all CT chest patients.
![]()
Table 5. Shows analysis of variance between the patients age with the measurement’s parameters for all patients from CT chest.
Diameter, see in Graph 2.
Regarding the correlation between the SSDE with D LAT for CT chest patients, the rate of change of SSDE was decreasing by 0.3591 for each cm of patient’s diameter, see in Graph 3.
4.2. Abdomen Results
165 CT abdomen were enrolled in the study. Regarding the gender in the study sample 81 patients were females with 49.1% while the males were 84 patients with 50.9% for a total of 165 patients represented in Table 6.
Regarding patient distribution for CT abdomen in different hospitals 30
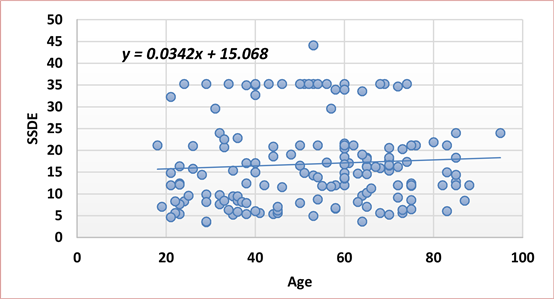
Graph 1. Shows correlation between the SSDE with patients age for CT chest.
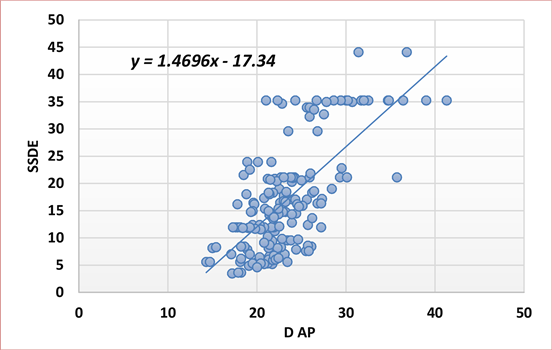
Graph 2. Shows correlation between the SSDE with D AP for patients CT chest.
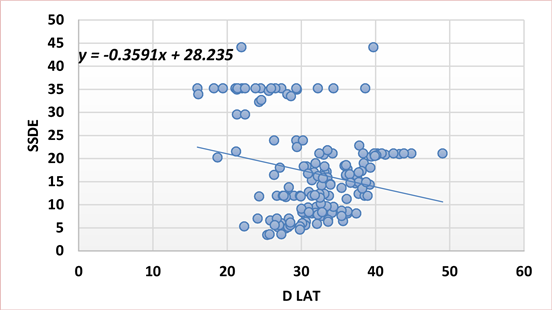
Graph 3. Shows correlation between the SSDE with D LAP for patients CT chest.
patients (18.2%) were from Hospital A, 45 patients (27.3%) were from Hospital B, 45 patients (27.3%) were from Hospital C and 45 patients (27.3%) were from Hospital D for a total of 165 patients, see in Table 6.
Regarding the descriptive Statistics for all CT abdomen patients, where the results presented as minimum, maximum, mean and standard deviation for age, Kv, mA, rotation time, CTDIvol, DLP, DAP TRANS, D LAT, Deff and SSDE. Where for age the mean was 49.06 ± Std. Deviation 18.23, for Kv and mA were 122.73 ± 4.47 and 144.23 ± 80.07 respectively, for rot.time, CTDIvol and DLP were 0.78 ± 0.03, 12.77 ± 8.72 and 641.85 ± 446.35 respectively, for DAP TRANS and D LAT were 24.25 ± 5.60 and 31.11 ± 6.33 respectively and for Deff and SSDE were 27.18 ± 4.45 and 18.01 ± 12.30 respectively, see in Table 7.
Regarding the analysis of variance between the patients age with the measurement’s parameters for all patients from CT abdomen, the value showed there is no significant difference between the patients age with the D AP TRANS, D LAT and SSDE, where the value were 0.153, 0.234 and 0.953, respectively. The p-value showed significant difference between the patients age with the Deff, where the value was 0.018, see in Table 8.
![]()
Table 6. Shows the frequency and the percentage in gender (N = 165) for CT abdomen in different hospitals.
![]()
Table 7. Shows descriptive statistics for all CT abdomen patients.
Regarding the correlation between the SSDE with patients age for CT abdomen, the rate of change of SSDE was increasing by 0.0025 for each year of patients age, see in Graph 4.
Regarding the correlation between the SSDE with D AP for CT abdomen patients, the rate of change of SSDE was increasing by 1.689 for each cm of patient’s diameter, see in Graph 5.
Regarding the correlation between the SSDE with D LAT for CT abdomen patients, the rate of change of SSDE was decreasing by 0.5199 for each cm of patient’s diameter, see in Graph 6.
![]()
Table 8. Shows analysis of variance between the patients age with the measurement’s parameters for all patients from CT abdomen.

Graph 4. Shows correlation between the SSDE with patients age for CT abdomen.
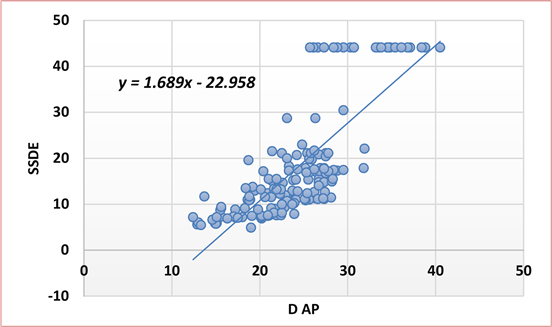
Graph 5. Shows correlation between the SSDE with D AP for patients CT abdomen.
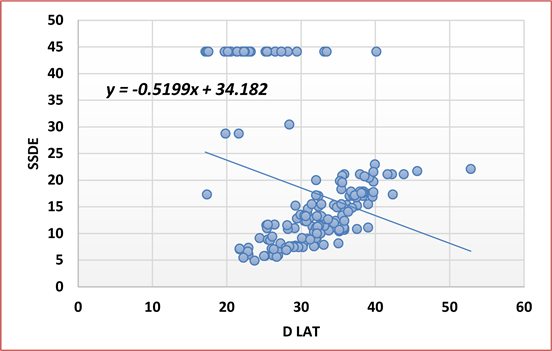
Graph 6. Shows correlation between the SSDE with D LAT for patients abdomen chest.
4.3. Comparison of SSDE
Regarding the comparison of SSDE for male and female to CT chest and abdomen, where for chest the mean value of SSDE for male was 17.08 and for female was 16.68, for CT abdomen male was 17.92 and female was 18.10, see in Figure 1.
Regarding the compression of size-specific dose estimation and effective diameter for all patients, at Hospital A, the chest effective diameter was 26.84 and the size-specific dose estimation was 34.15, while for abdomen Deff was 27.40 and SSDE was 41.76. At Hospital B, the chest Deff was 27.14 and SSDE was 8.68, while for abdomen Deff was 26.92 and SSDE was 10.57. At Hospital C, the chest Deff was 25.76 and SSDE was 14.88, while for abdomen Deff was 26.52 and SSDE was 15.11. At Hospital D, the chest Deff was 25.17 and SSDE was 15.56, while for abdomen Deff was 27.94 and SSDE was 12.50, as shown down in (Figure 2).
![]()
Figure 1. Shows compare of SSDE for male and female to CT chest and abdomen.
![]()
Figure 2. Shows compare of size-specific dose estimation and effective diameter for all patients.
5. Discussion
The study found that the SSDE in CT chest for males 85 patients (51%) and females 80 patients (48.5%) were 17.08 and 16.68 respectively, while for CT abdomen males 84 patients (50.9%) and females 81 patients (49.1%) were 17.92 and 18.10 respectively, the majority were males in chest and abdomen and there was no difference between the genders in the absorbed dose (mGy).
The study found in all CT chest patient scan that the mean CTDIvol and SSDE were 11.99 ± 6.94 and 16.89 ± 9.82 respectively. This finding was in accepted range compared to local study done by Einas Hamed et al., the study found mean CTDIvol and SSDE were 12.75 ± 6.9 and 18.58 ± 10.40 respectively [15] .
For all CT abdomen patients scan the study found that the mean CTDIvol and SSDE were 12.77 ± 8.72 and 18.01 ± 12.30 respectively. The finding was in lower range compared to local study done by Einas Hamed et al. that found mean CTDIvol and SSDE were 16.02 ± 8.85 and 23.92 ± 15.10 respectively [15] .
Significant dose variations presented between these two studies for CT abdomen is clear indication that scan protocols were not standardized at that time and this seen for CTDIvol in this study (12.77) and Einas Hamed et al. (16.02) [15] , which affected the SSDE results variations.
As comparison of international study with ours, a study submitted by Jodie Christner et al. done in Rochester, England. For 545 patients in 11 hospitals found the mean, CTDIvol and SSDE for the torso (both chest and abdomen) were 18.10 ± 3.7 and 21.8 ± 3.4 respectively [15] . In our study for 330 patients in 4 hospitals, we found the mean for CTDIvol and SSDE of both chest and abdomen were 12.38 ± 7.83 and 17.45 ± 11.06 respectively.
The study found in the compression of size-specific dose estimates with effective diameter in all hospitals that in CT chest the Deff was for Hospital A 26.84, B 27.14, C 25.76 and D 27.17 while the SSDE was for A 34.15, B 8.68, C 25.76 and D 15.56, we noticed that the Deff were in close range of (25.75 - 27.17) while the SSDE were in spaced range of (8.68 - 34.15) with Hospital A the highest, Hospital B the lowest and Hospitals C and D in same range.
In CT abdomen the compression of size-specific dose estimates with effective diameter in all hospitals, the Deff was for Hospital A 27.40, B 26.92, C 26.52 and D 27.94 while the SSDE was for A 41.76, B 10.57, C 15.11 and D 12.50, we noticed that the Deff were in same range of (26.52 - 27.94) while the SSDE were in spaced range of (10.57 - 41.76) with Hospital A the highest, B the lowest and C and D in close range.
In most of the examinations, scanners (in all hospitals except for Hospital A) were using fixed tube current (Kv) exposure setting with instate of Tube Current Modulation (TCM). This has implication that thin patients could receive unnecessary high absorbed doses according to their adjusted exposure (mA) by the tube current modulation according to their acquired attention (densities) in the scout radiograph without considering patient size.
In Hospital A, the mean CTDIvol and SSDE for chest were 24.22 ± 3.27 and 34.15 ± 4.61 respectively, for abdomen were 29.62 ± 4.58 and 41.76 ± 6.45 respectively. This high exposure compared with other hospitals participated in this study which had CTDIvol for chest in Hospital B were 6.16 ± 2.84, C 10.56 ± 4.12 and D 11.08 ± 2.81, for abdomen CTDIvol in Hospital B were 7.50 ± 2.49, C 10.72 ± 3.74 and D 8.87 ± 2.77, this had implication on patients taking unnecessary high absorbed doses, and this resulted from the TCM being off and expose patients with high fixed mA and Kv in most of cases.
In Hospital B, the mean CTDIvol and SSDE for chest were 6.16 ± 2.84 and 8.68 ± 4.01 respectively, for abdomen were 7.50 ± 2.49 and 10.54 ± 3.52 respectively. We noticed in this hospital that the scanner uses higher Kv (penetration power) of 130 in both chest and abdomen and reduced the mA to the patients (quantities of X-rays) which is in chest 54 and for abdomen 97.04 ± 3.48, this affected the SSDE to decrease and give the patients lower absorbed dose without effecting the acquisition of high-quality images.
The American College of Radiology (ACR) in the US recommended the Diagnostic Reference Levels (DRLs), which use CTDIvol as dose reference for the DRLs in CT that for adult CT chest with lateral diameter of 35 cm the DRLs be 21 mGy and for adult CT abdomen with lateral diameter of 38 cm to be 25 mGy (37), in our results we found for adult CT chest with lateral diameter of 31.62 ± 5.89 cm the DRLs was 11.99 ± 6.94 and for adult CT abdomen with lateral diameter of 31.11 ± 6.33 cm was 12.77 ± 8.72 mGy. This was very accepted compered the US DRLs.
The study found there is no significant difference between the age and D AP TRANS, D LAT and SSDE for CT chest with value of 0.113, 0.229 and 0.211 respectively, while for Deff the value showed significant difference of 0.049. For abdomen the value showed no significant difference between the age and D AP TRANS, D LAT and SSDE of 0.153, 0.234 and 0.953 respectively, while for Deff the value showed significant difference of 0.018. This means the age of patients was affected mostly by the Deff in both CT chest and abdomen and vice versa.
The study found in CT chest the correlation between SSDE with age and D AP were increasing in rate of 0.0342 for each year of patient age and in rate of 1.4696 for each cm of patient diameter respectively, while decreasing in the D LAT by rate of 0.3591 for each cm of patient diameter.
For CT abdomen, the correlation between SSDE with age and D AP were increasing in rate of 0.0025 for each year of patient age and in rate of 1.689 for each cm of patient diameter respectively, while decreasing in the D LAT by rate of 0.5199 for each cm of patient diameter.
6. Conclusions
This study used SSDE to provide more accurate estimations of patients’ doses according to their AP and lateral diameter, rather than using CTDIvol which just gives scanner output without considering the patient size. The use of SSDE helps convert CTDIvol into more patient size-specific radiation doses by measuring patient doses according to their dimensions from the mid-exam slice, and this metric should be included in CT scanner systems and patient dose reports to help give each patient as low as possible of radiation dose to assist medical physics community and radiologist to choose proper factors for the patient according to their size.
The study found the CT chest mean SSDE was 16.89 mGy ± 9.82 which is found to be lower than a local study (in Sudan) done by Einas Hamed et al., which was 18.58 mGy ± 10.40 (18). And the CTDIvol in our study was 11.99 ± 6.94 found to be accepted and considered lower in value compared to the ACR DRLs which is 21 mGy [16] .
While for CT abdomen the study found the mean SSDE was 18.01 ± 12.30 which is found to be lower than a local study (in Sudan) done by Einas Hamed et al., which was 23.92 ± 15.10 (18). And the CTDIvol in our study was 12.77 ± 8.72 this is also found to be accepted and considered lower in value compared to the ACR DRLs which is 25 mGy [16] .
7. Limitations
The study sought to have more hospitals and populations, but the most limitation faced by this study is finding more than seven computed tomography scan machines malfunctioned and stopped working for a period of time due to the lack of spare parts to replace the damaged ones.
8. Recommendations
Adding SSDE metric to CT systems and patient dose reports to help reduce radiation dose to patient in accordance with their dimension.
Proper staff training to understand and maintain dose reduction techniques in CT scanners.
Regularity in performing quality assessment and control for CT machine to keep dose as low as possible.
This study established the DLP for CT chest and abdomen gave the full patients’ data in the appendices to give other researchers the opportunity to continue a new thesis from this study and correlate between CTDIvol, SSDE, and DLP.
Acknowledgements
Immeasurable appreciation and deepest gratitude for the help and support are extended to the following persons who in one way or another have contributed to making this study possible. Prof. Alnazier Osman Hamza Dean of Faculty, for his support and words of encouragement, and to Mr. Mohammed Hussain Abdullah, supervisor, for his support, advice, guidance, valuable comments, suggestions, and provisions that benefited us much in the completion and success of this study.
Appendices
![]()
Figure A1. Shows CT chest dose report and measurement at hospital C.
![]()
Figure A2. Shows CT abdomen dose report and measurement at hospital C.
![]()
Figure A3. Shows CT chest dose report and measurement at hospital D.
![]()
Figure A4. Shows CT abdomen dose report and measurement at hospital D.
![]()
Figure A5. Shows Computed Tomography (CT) scan machine at hospital C.
![]()
Figure A6. Shows a 16 cm quality measurement phantom used in the study.
![]()
Figure A7. Shows students centering phantom for quality measurement at hospitals Cand D.
![]()
Figure A8. Shows CT digital calipers quality measurement at hospitals C and D.