Landslide Susceptibility Assessment Based on Slope Unit and BP Neural Network ()

1. Introduction
Landslide is a phenomenon of rock or soil sliding along a weak plane or weak zone by gravity and it is one of the most destructive geological disasters. China was one of the hardest hit countries by landslides, which cause heavy casualties and property losses. In western area of Sichuan Province, China, where topography is complex and lithology is mixed and tectonic movement is active. LSA is urgently needed, which can give the scientific, accurate and efficient prediction of landslide in order to prevent the occurrence of landslide and reduce the loss.
Mapping unit is the basic unit in LSA, and the selection of mapping unit is imperative to the establishment of evaluation model. The grid unit was simple and efficient, but it lacked the topographic and geomorphic information in LSA (Dragut and Eisank, 2011) [1] . Topographic units used in LSA can well reflect the comprehensive characteristics in the region, but it is not efficient in large-scale geological hazard evaluation (Tang and Ma, 2015) [2] . Slope units reveal the environment of landslide development and the effect of triggering conditions (Wu et al., 2013) [3] . Qiu et al. evaluated Lushan earthquake landslide based on slope unit and pointed out the slope unit could reflect the integrity of slope with high prediction accuracy and save the memory (Qiu et al., 2015) [4] . Slope unit is consistent with the natural terrain and reflects the actual form and scale of landslide disaster (Ling et al., 2021 [5] ; Xue et al., 2020 [6] ; Zhang et al., 2018 [7] ; Zhao et al., 2021 [8] ). At present, scholars is been a deal of research on landslide susceptibility evaluation method, built a variety of landslide susceptibility evaluation models based on GIS (Chen et al., 2020 [9] ; Dai, 2013 [10] ; Dikshit et al., 2020 [11] ; Hua et al., 2020 [12] ; Sun et al., 2021 [13] ; Wang et al., 2008 [14] ), such as weighted information value, logistic regression, analytic hierarchy process, factor strong correlation analysis, symmetrical factors classification, but most of models semi-quantitative calculation of regional landslide susceptibility, subjective and hard to verify.
Data integrity and assessment scale affect the choice of model to a certain extent. The available database consists of an inventory with 182 fully characterized landslides with known size and the location. However, an effective detailed landslide inventory is critical for LSA. As a training sample for the model, the accuracy of the landslide inventory affects the accuracy of LSA. In this paper, the historical landslides inventory and field study are used to verify the accuracy of landslide inventory.
All these aforementioned studies have one thing in common, that is, how to choose the model of LSA. The evaluation model is selected comprehensively according to the characteristics of the study area, the data of landslide inventory and the mapping unit. In this study, landslide inventory data is abundant and the study area is located in typical deep mountain gorge district, so the combination of slope unit and back propagation neural network (BPNN) is adopted, which is less studied. In this paper, the combination of BPNN and slope unit is an attempt to improve the accuracy of assessment, to provide more accurate data for landslide prevention in the study area.
2. Study Area and Data
2.1. Study Area
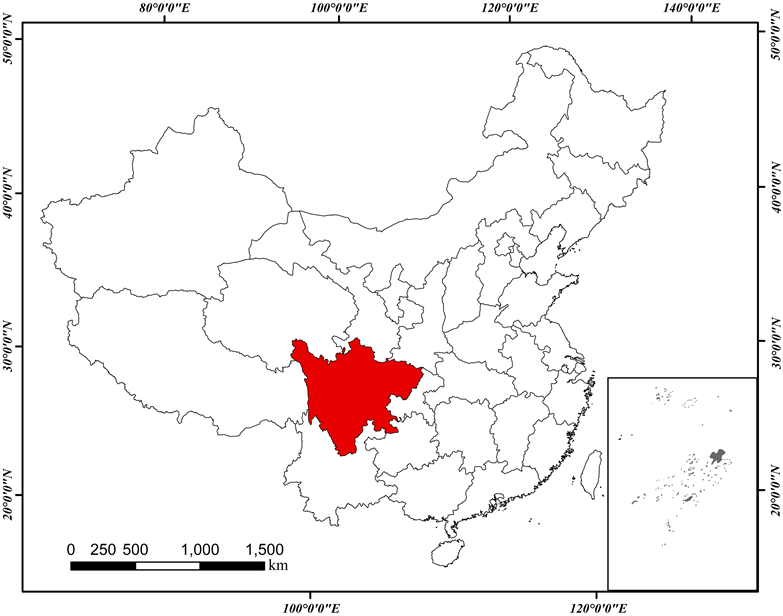
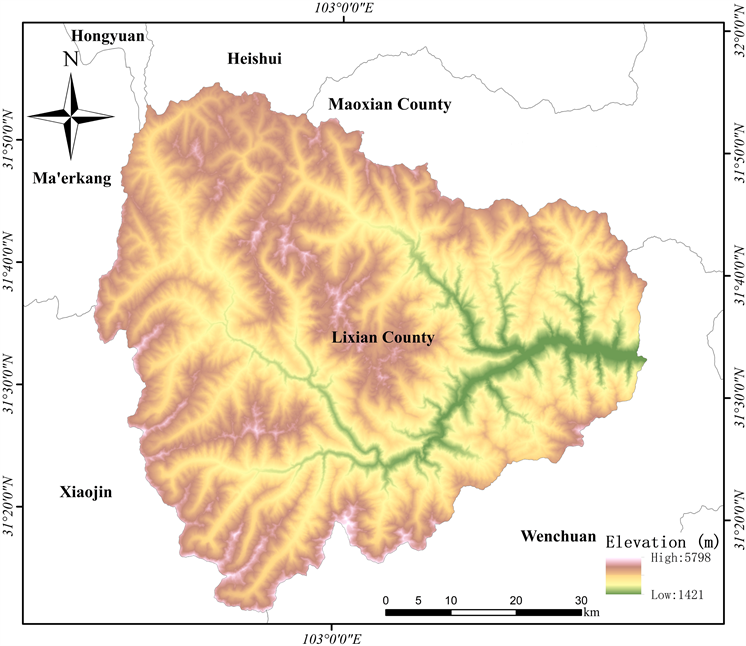
Lixian County is located in the east of the Qinghai-Tibet Plateau, southeast of Aba Tibetan and Qiang Autonomous Prefecture, with the latitude 30˚54'N to 31˚12'N, 102˚32'E to 103˚30'E. It is about 78 km long from north to south and 84 km long from east to west, has 4 towns and 9 villages, covers an area of 4313 km2 (Figure 1). Study area is located in the upper reaches of Minjiang River, where is not only an important part of the ecological barrier in the upper reaches of the Yangtze River, but also a vital water source lifeline for Chengdu plain.
2.1.1. Landform
Lixian County is located in the middle of Longmen mountain where terrain high in the northeast and low in the southwest. The study area located in typical deep mountain gorge district with an altitude range between 1422 m to 5900 m and an average elevation of about 2700 m. The relative elevation of this area is high and the landform is extremely complex, which is liable to the development and occurrence of landslides.
(a)
(b)
Figure 1. Location of study area, the location of Sichuan Province in China (a) and the location of Lixian County in Sichuan province, the topography of Lixian County are also shown in (b).
2.1.2. Geological Setting
The landslide-prone stratums widely distribute in the region. The main stratum of Lixian County is Triassic strata and relatively complex stratigraphic conditions in the east and south. The lithology of the study area is dominated by metamorphic sandstones and sandy SLATE, followed by crystalline limestone and phyllite, with sporadic outcropping of diorite, granite and other metamorphic rocks. The outcropping area of Zhuwo formation accounts for 49% of the total area. Zhagashan formation and Zagunao formation account for 17% of the total area, respectively. The outcropping of Jurassic monzogranite and Triassic quartz syenite accounts for about 7% of the total area respectively. Other lithology of strata is sporadic.
2.2. Data
The landslide inventory map in this study was obtained from historical reports
![]()
Table 1. Details of the dataset used for LSA.
(https://www.cgs.gov.cn/), remote sensing interpretation base on Google Earth, and field investigation. Table 1 shows the data in this paper.
3. Methodology
3.1. Division of Slope Unit
All mapping units in the landslide susceptibility can be classified into five types (Guzzetti et al., 1999) [15] : grid unit, slope unit, terrain unit, topographic unit, and unique condition unit. Conducting slope unit-based landslide susceptibility evaluation can improve the evaluation accuracy, advance the evaluation from a semi-quantitative models to deterministic or quantitative models, and easy to understand the geohazard triggering conditions (Fang et al., 2020) [16] . Huang et al. used the slope median error method to determine the optimal DEM resolution in order to achieve the best division results (Huang et al., 2017) [17] , and Yan et al. used the division method based on surface curvature to divide watershed, and used the principle of hydrologic analysis to divide slope units, avoiding tedious refinement and could divide horizontal surface (Yan et al., 2017) [18] .
In this study, slope unit is taken as the mapping unit of assessment, its division accuracy will affect the assessment results. Slope units are divided by hydrologic analysis for discovering the relations between the assessment unit and terrain, it’s also can increasing the accuracy of the assessment results (Fang et al., 2020) [16] . In this study 1710 slope units were divided in the study area using this method (Figure 2).
3.2. Analysis of Landslide Factors
The preparation and occurrence of landslide disaster are affected by various factors. In landslide susceptibility assessment, the selection of assessment factors and treatment of landslide controlling factors directly affect the establishment and assessment accuracy of the model (Wu and Qiao, 2007) [19] . However, there is no well-defined standard to select the most significant landslide factors. Therefore, the selection and analysis of multiple controlling factors must be based on an accurate and thorough understanding of each factor. According to the summary of previous research and the geoenvironmental characteristics of
Lixian County (Fan et al., 2021 [20] ; Sciarra et al., 2017 [21] ; Zhang et al., 2022 [22] ). In this study, landslide factors consist of altitude, aspect, slope, distance to road, distance to river, normalized difference vegetation index (NDVI), distance to fault (DTF), lithology, slope curvature, slope length. Lithology and distance to fault are the geological conditions of landslide formation (Zhu et al., 2021) [23] , lithology affects the deformation of slope and faults affect slope stability by causing rock crush. Distance to road, distance to river, DNVI and other factors directly or indirectly lead to the occurrence of landslides.
Pearson product-moment correlation coefficient (PCCs) was used to analyze the correlation of 10 controlling factors to ensure the relative independence of controlling factors, reduce the complexity of the model calculation (Table 2). The analysis showed that: The PCCs between elevation and distance to road is 0.686, the PCCs between distance to river and distance to road is 0.752, considering that roads in the high-mountain-and-gorge area are usually built along
![]()
Table 2. Pearson correlation coefficient among factors.
the rivers, the distance to road is eliminated.
As the slope unit is used as the assessment unit in this study, unique values of 9 controlling factors are required in each slope unit, different types of controlling factors need to be treated differently: for the successive factors such as altitude and distance to stream, the average value within slope unit calculated as the unique value; for the discrete factors such as lithology, occupies the largest area in the slope unit is the unique attribute. The slope length is obtained by subtracting the highest elevation from the lowest elevation in the slope diagram.
3.3. Landslide Susceptibility Modeling
The assessment model is based on BP neural network, completed the landslide susceptibility assessment and verification are completed with reference to the landslide inventory in the study area. As the most frequently used algorithm model in artificial neural network, BP neural network has a complete theoretical system and learning mechanism, the multi-layer perceptron model is built by simulating the response process of human brain neurons to external signals, after signal positive propagation and error reverse adjustment, an intelligent network model for nonlinear information processing is built through iterative learning.
3.3.1. BP Arithmetic
The main idea of BP algorithm is to divide the learning process into two stages: signal positive propagation and error back propagation. Taking the landslide susceptibility evaluation of Li County as an example, the calculation steps of the algorithm are as follow steps:
Step 1: Assign initial weights: wij was used to represent the strength of the connection between neuron i and j. wij(0), wjk(0) and wkm(0) are given a group of random non-zero numbers, and the values are guaranteed to be small, generally between −1 and 1.
Step 2: Determine the model parameters of BP neural network: determined the number of hidden layer and hidden node, selective activation function.
Step 3: Define variables: the evaluation factor is the input variable seted as
, (
), where N represents the number of training samples,
represents the sample properties.
represents expected output.
Step 4: Input training sample: input sample is seted as
.
Step 5: Positive communication: the input information is transmitted from the input layer to the output layer through the hidden layer to generate the output signal. In the process of signal positive propagation, the weight of the network is fixed. The features of neurons in the front layer only affect the neurons in the previous layer.
Step 6: Back propagation: in the back propagation phase, error signals that fail to meet the accuracy requirements are propagated from the output layer, layer by layer, and apportioned the error to all the neutrons in the previous layer, according to the error signal, the connection weight of each layer is dynamically adjusted, and then determine the relationship between K and N, if K > N, proceed to the next step; Otherwise, proceed step 4) again.
Step 7: Calculation error: calculate the total error of BP neural network training, stop learning when the accuracy requirements are met; otherwise, proceed to step 4) again for a new learning.
At this point, BP neural network has completed the process of positive propagation and back adjustment, which is called a learning or an iteration. BP algorithm needs several iterations to make the error converge to the preset accuracy. Therefore, the learning time, iteration times and final accuracy of BP neural network are important indicators to measure the performance of BP neural network.
3.3.2. Landslide Susceptibility Assessment
Constructing a scientific and reasonable assessment model is the key to determine the impact of each controlling factor on landslide. Landslide susceptibility was checked according to these environmental factors using BP neural network. The evaluation process is as follows (Figure 4).
The evaluation factors are different in data type, value range, and dimension; therefore, evaluation factors need to be standardized before establishing the model. The evaluation factors are divided into four categories in this study: continuous data (such as altitude, distance to river, distance to fault), discretization to permutation data by natural breakpoint method; Evaluation factors of conventional classification (such as aspect), classify according to general rules; Data with more decimal places (such as NDVI, slope curvature), in order to ensure the accuracy, the three decimal places are uniformly reserved and discretized
![]()
Figure 4. Landslide susceptibility zoning map of Lixian County.
according to the natural breakpoint method, 4) Classified attribute data, such as lithology.
In BP neural network, the number of hidden layers and nodes of each layer have great influence on the performance of the network. In the process of BP neural network processing sample data, if the number of nodes in hidden layer is too small, it means that the network has limited ability to obtain information from the sample, and local minimum may appear; if the number of nodes is too large, irregular information in the sample data will be highlighted, leading to not the best result. Some empirical formulas for estimating hidden nodes are summarized in previous studies (Liu, 2011 [24] ; Zhang, 2006 [25] ), and this study selects one of them:
(1)
where I represents the number of hidden node, M represents the number of input node, P represents the number of input node, and a represents a constant.
The activation function controls the network output. The function is used to complete a nonlinear transformation after linear combination. The Sigmoid function is selected as the activation function in this study, which is characterized by limiting the output results between 0 - 1.
(2)
By comparing the empirical formula and the combination of multiple hidden layers, hidden layer node number and activation function, it is proved that the evaluation result is more accurate when the activation function is “Sigmoid”, hidden layer number is 2 and hidden layer node number is 10.
Before training the landslide susceptibility model, non-historical landslide sample points with the same number of historical landslide sample points are randomly generated, and then 70% of these points are randomly selected as training data, and the remaining 30% as test data. The 9 landslide evaluation factors represent the 9 input nodes, BPNN are also called full connected networks, and each node of the fully connected layer is connected to all the nodes of the previous layer to combine the features extracted from the front layer. At the beginning of training, each input signal randomly outputs a value ranging from −1 to 1 to the hidden layer I. Each neural node of hidden layer I, J and output layer K has an input signal accumulator with spatio-temporal integration and an excitation function that limits the range of output. The accumulator calculates the linear combination of input signals ui (net input of neurons) and the threshold value θi of neurons to get vi, then the output signal of this neuron is:
(3)
where f(・) is represents the excitation function.
After receiving the signal from the previous layer, each neuron calculates the output signal and transmits it to the later layer. The output layer calculates the error or output of the calculated result.
After the positive propagation of the BPNN, the difference between the expected output and the actual output is calculated as the error. Error propagates forward from the output layer, modifying weights layer by layer. After many times of learning, the error converges to the preset precision, and the learning stopped and the weights of each connection are saved.
4. Results and Validation
4.1. Results
Landslide susceptibility index was imported into the attribute table of slope units by ArcGIS, and the index was divided by natural breaks method. The range of index with very low, low, moderate, high, and very high is 0 - 0.12, 0.13 - 0.34, 0.35 - 0.59, 0.60 - 0.85, and 0.86 - 1, respectively.
In research of regional landslide susceptibility map (LSM), the proportion of areas with very high, high, moderate, low, and very low is 25.1%, 19.1%, 8.1%, 22.9%, and 24.8%, respectively. Using this model, the proportion of landslide distributed in moderate, high, and very high area is 90.1%, and the correct percentage of verification dataset prediction is 83.6%, which confirms that models with accuracy.
As designated in figure (Figure 5), about 3.3% and 6.6% of the landslide distributed in very low and low susceptibility classes of the study area, respectively. The remaining 6.1%, 29.8%, and 54.2% of landslides fall into moderate, high, very high landslide susceptibility, respectively. And the landslide density goes up from very low to very high landslide susceptibility zone, which confirms that models with validity (Figure 6).
Selecting some control factors to analyze landslide distribution (Figure 7). The analysis of elevation broken line shows that landslides are more distributed in the low altitude area, less in the high altitude area. The slope curve shows that the higher the slope, the higher the probability of landslide occurrence. High NDVI value is prone to landslide, which may be related to land use in the study area. The very high landslide susceptibility areas are distributed in the low altitude
![]()
Figure 5. Histogram of landslide susceptibility zoning and distribution.
![]()
Figure 6. Histogram of landslide density.
![]()
Figure 7. Distribution percentage of landslide disaster in various controlling factors. The controlling factors classification is based on the natural breakpoint method. The values from A to H are shown in Figure 3.
areas along the Zagunao River and its main tributaries, the lithology of outcrops is mainly Xinduqiao Formation of Triassic, Zhuowei Formation of Triassic and Shangyan Formation of Silurian, for shale, limestone, quartz sandstone and other weak rock formation, and the range is above 180 m. The main roads and towns in the study area are in the middle and high risk areas, and the human engineering activities in the valley area are strong, and there is a great possibility of landslide occurrence. Therefore, attention should be paid to the existence of villages in slope units in very high landslide susceptibility areas.
4.2. Validation
Validation of the precision of landslide susceptibility model using different validation techniques is important (Wang et al., 2007) [26] . In this case, the landslides in the study area classified into 70% (253) training landslide data sets and 30% (109) validation landslide data sets, and ensure randomness.
The development of receiver operating characteristic (ROC) curves comes out of signal detection theory, which arose in part as a method to improve the accuracy of radar detection during the World War II. With early radar technology, radar operators experienced difficulty distinguishing between “noise” (e.g., birds or other environmental objects) and actual enemy aircraft. The ROC curves provided both qualitative and quantitative approaches for improving the sensitivity of uncertain events. When evaluating diagnostic tests, one is concerned with both confirming the presence of landslide and ruling out landslide in stable slope. It is described using a 2-by-2 table.
The area under the curve (AUC) value was used to evaluate the performance of the model, and the AUC value is closer to one, indicating the higher accuracy of the model. As shown, the AUC values for BPNN are 0.953 and 0.950 on validation data set and training data set, respectively.
5. Conclusion and Discussion
5.1. Conclusion
In this study, 10 controlling factors are selected according to the topography and
![]()
Figure 8. Receiver operator characteristic curve.
geomorphology of the study area. The correlation analysis shows that the small correlation index between altitude, slope, aspect, slope curvature, slope length, NDVI, lithology, DTF and DTR, which can be used as evaluation factors of landslide susceptibility.
The controlling factors classification, number of hidden layer, number of hidden node and activation function is tested in multiple groups. It is concluded that when the hidden layer number is 2, the hidden layer node number is 10, and the activation function is Sigmoid type, the accuracy of the result is the best.
The landslide susceptibility model is constructed based on BPNN. The landslide susceptibility map shows that the area with dense distribution of historical landslides is consistent with the area with very high landslide susceptibility class, and the AUC values of the ROC curves are 0.953 and 0.950.
5.2. Discussion
Landslide susceptibility assessment can be used to disaster prevention and hazard mitigation and to reduce the loss of local residents caused by landslide. In recent years, with the development of computer technology, some machine learning algorithms have been used in geological hazard evaluation making the evaluation results more objective and understandable. In this study, BPNN is used to construct the landslide susceptibility model, which avoids the influence of subjectivity. However, the rationality and accuracy of evaluation can only be ensured when the samples are enough and the accuracy is high. At present, the model parameters of BPNN under different circumstances lack sufficient theoretical.
The development and occurrence of landslide is a complicated process, which is affected by various factors. The evaluation system and evaluation model should be considered comprehensively the study area with different geological environments. A large number of spatial data with high accuracy can be extracted by using geographic information system (GIS) combined with remote sensing (RS) data, but the selection of controlling factors and models still need more experiments and studies to verify the rationality.