2D Analytical Model for Direct Ethanol Fuel Cell Performance Prediction ()
1. Introduction
Fuel cells are new power sources which produce electricity without any noise or environmental contamination. Fuel cells are used nowadays for rural, military portable and station applications [1]. Direct methanol fuel cells are one of prominent fuel cells which have high current density. Unfortunately direct methanol fuel cells have some technical problems such as methanol toxicness, expensive Pt-based catalysts, and high methanol cross over, thus, there are trends to substitute methanol with other fuels. Ethanol, acid acetic and acetaldehyde are proposed alternatives [2-5]. Recent ethanol fuel cell activities have been more experimental to date and only 1D analytical model has been proposed for DEFC so far. This model has been proposed by G. Andreadis and his colleagues by considering over potential changes inside catalyst layer [6-9]. In this paper, we try to present a 2D fully analytical model with simple consideration. With regard to Fuel cell coordinates, which have been illustrated in Figure 1, following assumptions have been made
1) Fluid flows in the steady state.
2) Fuel cell temperature is constant in the active area and chemical reaction takes place under constant temperature.
3) Reactants diffusion and transportation in catalyst layer along y direction is not considered.
4) Due to low diffusion layer thickness before its size long channel length, reactants concentration change across diffusion layer is ignored.
5) Reactants diffusion inside diffusion layer along y direction has been ignored because of low diffusion layer thickness before its length.
6) Because the thickness of membrane is so smaller than its thickness, reactants diffusion along y direction is ignored.
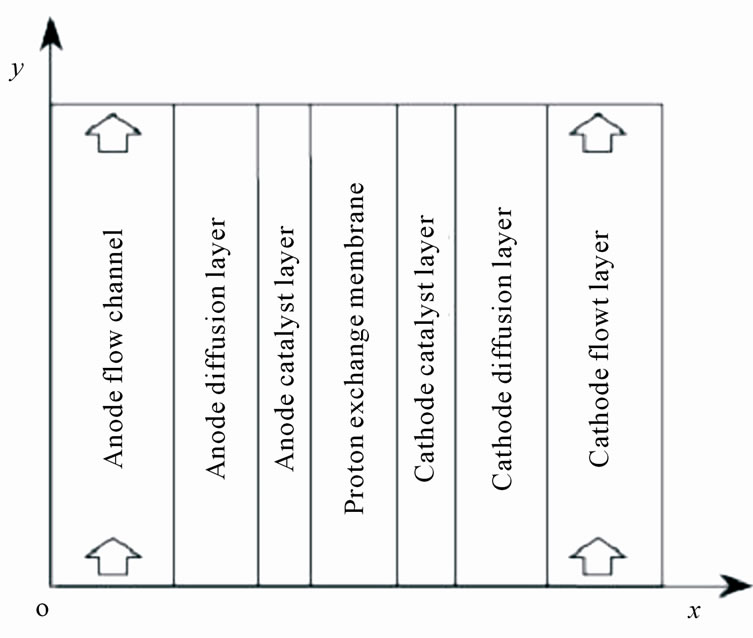
Figure 1. Coordinates of fuel cell for presented model.
7) Due to smaller depth of ethanol and water transporttation channel than its length, reactants concentration change along x direction inside the channel has been neglected.
8) Pressure drop inside channel is neglected.
9) Fluid flows at constant velocity inside the channels.
2. Basic Equations
Anode and cathode overall reaction is as follows
 (1)
(1)
Ethanol concentration inside anodic channel,  could be mentioned as below
 (2)
(2)
Whereas  is mass flux from anodic channel through diffusion layer. Based on Fick’s law, we can write the following equation for mass flux, whereas
  is diffusion coefficient of ethanol through diffusion layer
 (3)
(3)
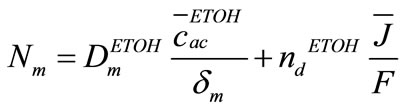
It can be noticed that for 12 M electron production, 1 M ethanol is consumed. Furthermore ethanol crossover lead to a part of ethanol permeate through membrane, so
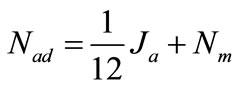 (4)
(4)
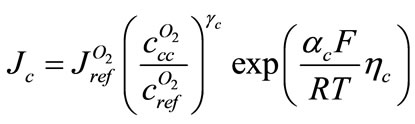
Current density can be written as below
 (5)
(5)
In which  is anodic over potential and
  is crossover from membrane as below
 (6)
(6)
The equations for cathode are similar to those for the anode, so
 (7)
(7)
 , current density is
 (8)
(8)
That  is cathodic over potential. Equations (2) and (3) can be written for cathode, thus
 (9)
(9)
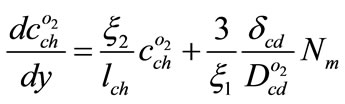
For oxygen concentration variation inside channel
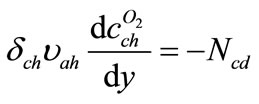 (10)
(10)
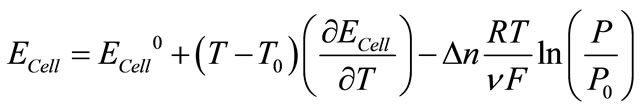
At last, for fuel cell voltage and current density, following equations is determined
 (11)
(11)
 (12)
(12)
That  is current density,
  membrane thickness,
  membrane conductivity,
  ideal electromotive force, and
  is electromotive difference rate.
  (Difference of exchanged gas moles between two sides of reaction in (1)) and
  (number of exchanged electrons) are constants which are –1 and 12 for (DEFC) respectively. Other symbols are listed in Table 1 or Nomenclature.
3. Analytical Solution
In this solution, ethanol concentration in cathode layer in neglected (zero) and ethanol is linearly distributed, thus
 (13)
(13)
 and
and  are substituted with
 ,
,  respectively, and then will be found
 (14)
(14)
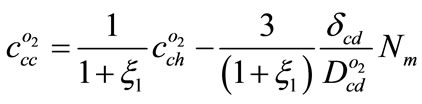
By substituting Equation (7) in Equation (9) and integrating from 0 to , oxygen concentration in catalyst layer is
 (15)
(15)
By assuming  and substituting Equation (8) in Equation (15)
 (16)
(16)
Whereas  is defined as follows
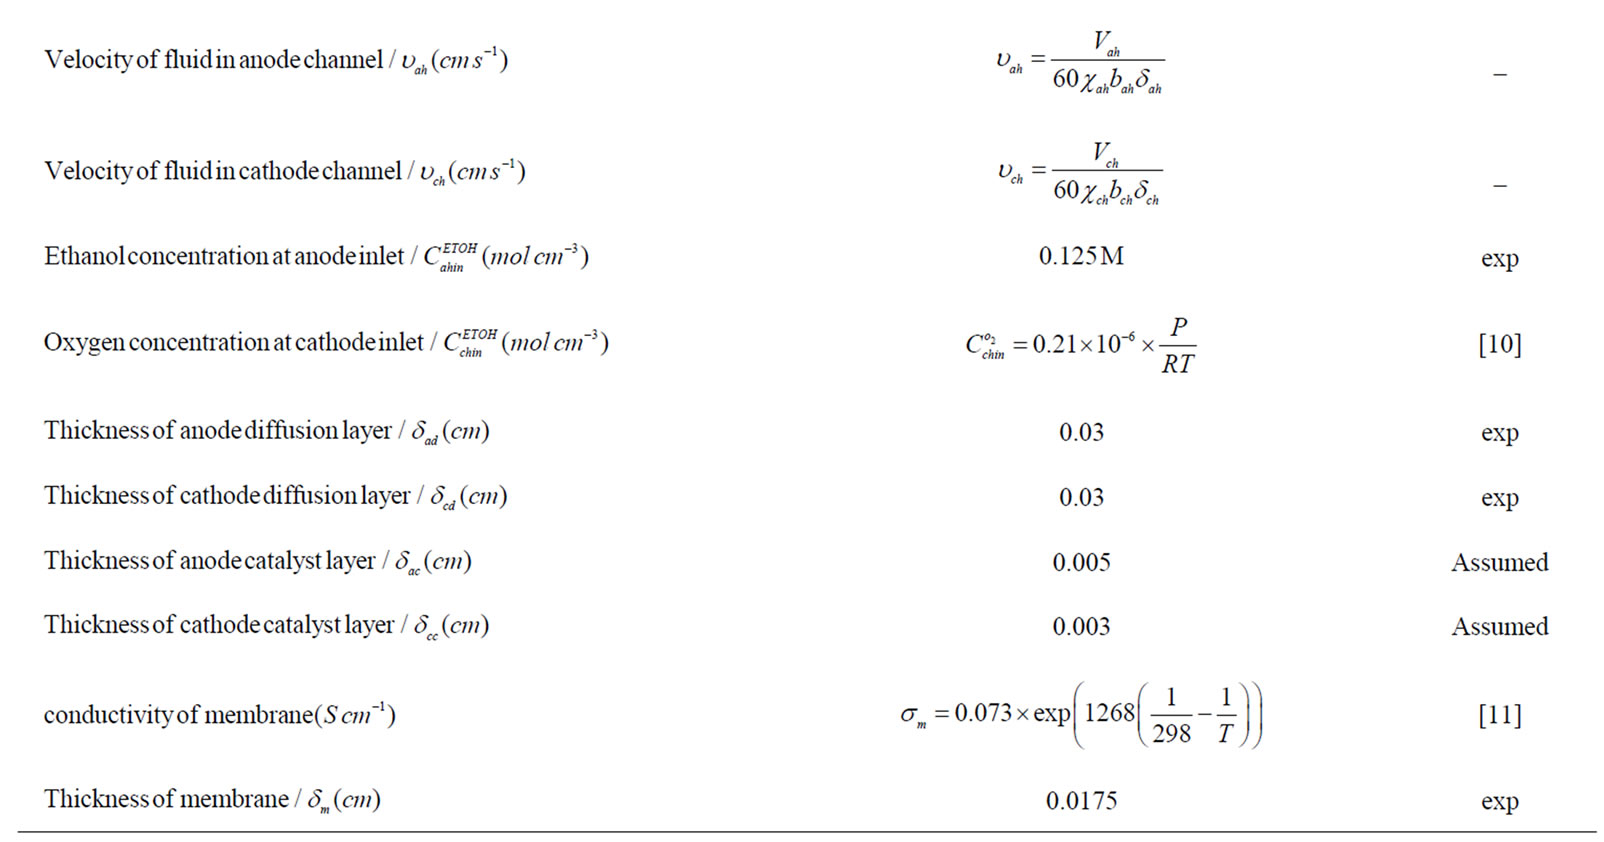

Table 1. Coefficients for analytical model.
 (17)
(17)
With regard to Equations (7), (8), (10) and (16) the below equation is acquired
 (18)
(18)
whereas  is
is
 (19)
(19)
At last, by integrating Equation (18) and assuming , oxygen concentration inside anode channel will be found
 (20)
(20)
Concentration of oxygen in the catalyst layer can be determined by substituting (20) into (16)
 (21)
(21)
Substituting Equation (21) into (8) and integrating
 (22)
(22)
Such trend can be implemented for anode side, thus Ethanol concentration variation inside anode channel could be written as follows
 (23)
(23)
Ethanol concentration distribution in the catalyst layer is
 (24)
(24)
Ethanol concentration average in the catalyst layer, by integrating (24) through  to
to  is
is
 (25)
(25)
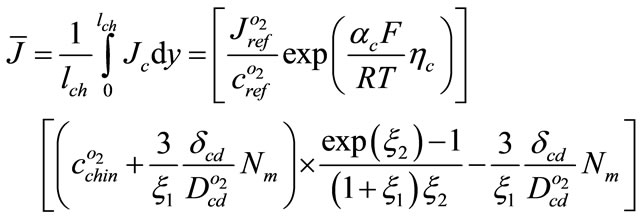
Average current density
 (26)
(26)
 ,
,  ,
,  are variants as below
 (27)
(27)
 (28)
(28)
 (29)
(29)
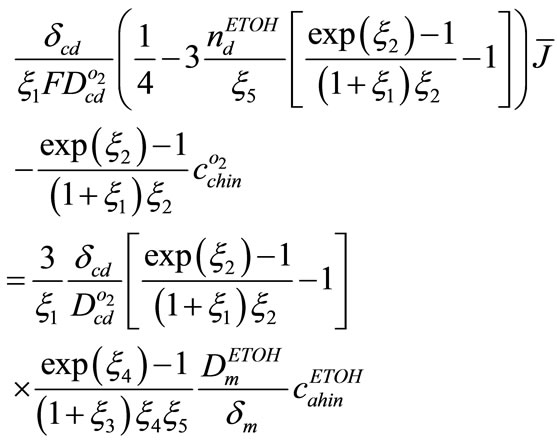
Finally, by using Equations (14), (25), and (26), following equations between anode over potential and cur rent density is attained
 (30)
(30)
Using Equations (14), (22), (25), following equation between cathode over potential and current density could be presented
 (31)
(31)
By using Equations (11) and (12) and combining them with Equations (30) and (31) polarization curves will be obtained. It should be mentioned that these two equations are solved by numerical methods
4. Results and Discussion
4.1. Comparison of Experimental and Analytical Results
After In this section analytical results will be compared with experiments. These experiments are performed under certain condition.
Pt/Ru/C catalyst was used for anode side and Pt/C black for cathode side. Catalyst loading on both sides was 4 mg/cm2. and Nafion 117 was used as membrane and flow channel wide and depth was 1mm. Cathode and anode flow channel pattern was 5 parallel and 2 parallel serpentine respectively. The cell was humidified by hot water for 2hours and activated by 1 M ethanol. Active area was 10 × 10 cm2 and back plates were made of aluminum.
For checking analytical model, because of some undefined coefficients, (assumed parameters in Table 1) first 0.125 M analytical curve is fitted to experimental curve then for other molarities analytical and experimental results will be compared (Figures 2-5). The results of comparison showed that at the first and second region of polarization curve, (Activation loss and Ohmic loss regions [18]) model predicts fuel cell performance well, but in the third zone (concentration loss region [18]) it seems that because of concentration loss negligence, and increase of molarity analytical somewhat model lost its accuracy.
Coefficients of analytical model are gathered in Table 1.
4.2. Ethanol Concentration Distribution Inside the Channel and over Potential Variation
Equation (23) foretells ethanol concentration variation inside anode channel exponentially, but based on Figure 6 ethanol concentration inside anodic channel can be considered almost linearly.
Over potential variation both for anode and for cath-

Figure 2. Comparison of experimental and analytical polarization curves for 0.125 M.

Figure 3. Comparison of experimental and analytical polarization curves for 0.25 M.

Figure 4. Comparison of experimental and analytical polarization curves for 0.375 M.

Figure 5. Comparison of experimental and analytical polarization curves for 0.5 M.

Figure 6. Ethanol concentration distribution inside anodic channel for 0.5 M; thick line 40 mA/cm2 and thin line 20 mA/cm2.
ode can be estimated Based on proposed analytical model. With regard to attained curve for anode over potential versus current density, by increasing current density, anodic over potential will increase, but for cathodic over potential, by increasing current density, cathodic over potential will remain approximately zero (Figures 7 and 8). These results are both for 0.5 M and for 0.25 M and match cathodic over potential results of G. Andreadis.

Figure 7. Anodic and cathodic over potential variation versus current density for 0.25 M.

Figure 8. Anodic and cathodic over potential variation versus current density for 0.5 M.
5. Conclusions
In this paper by an analytical 2D model, (DEFC) performance was predicted. This model is capable of estimating polarization curves up to 0.5 M. This model is precise in the first and second zone (Activation and Ohmic loss region), but in the third zone (Concentration loss region) because of neglecting concentration loss and increasing inlet ethanol concentration, model error will increase and it will have more difference with experimental curves. Based on model, ethanol concentration varies almost linearly inside anodic channel. By increasing current density cathodic over potential remains zero but anodic over potential will increase up to certain value.
Nomenclature


Greek Symble


Superscript


Subscript