Trend of Nitriding on Chromium-Molybdenum Steel via Low Temperature Screen Plasma Technology ()
1. Introduction
In recognition of its eco-friendliness, the demand for the plasma nitriding process has exploded in the area of surface hardening technology for energy efficiency, low distortion and high performance in the past few decades. And the screen plasma technology is used as a method of making low energy assumption for high density plasma and high efficiency in the plasma nitriding process [1] -[4] . At last, advances in the screen plasma technology like active screen plasma nitriding or ATONA process have made it possible for low temperature hardening to low-alloying steel with a simple design and low energy assumption [5] . We took it for granted that the screen plasma process was issued with a high-density plasma species as a neutral nitrogen atom and radical ammonia molecule, example NHx, to supply floating power by remote electrodes [6] -[9] .
Recently, the influence of screen plasma technologies has been applied to the development of a hardening process breaking through the barrier [1] [10] . To understand the principle of resource generation, most researchers were interested in plasma species models to describe the stages of plasma species generation and the movement in chamber including the remote plasma process as well as how it differs from the mass transfer mechanism in the plasma nitriding process and active screen nitriding process, particularly the example sputtering model and the role of dominant plasma species, etc. [11] -[15] .
On the one hand, the commonly used low alloyed mold steel was naturally treated using a quenching-andtempering hardening process at low temperature, and it used the gas oxi-nitriding process for wear test atmosphere. In this research, it will thus be seen that the low-element alloying chromium-molybdenum steel has been approached to enhanced performance without a compound layer and matrix hardness deterioration by the SPN and SPNC process and presented our diagnostics results with some parameters in applying a SPN and SPNC technique to AISI4140 which satisfies the above-mentioned requirements.
In particular, the screen plasma process in a mixed gases atmosphere holds the key in the plasma reaction of the nitriding, nitro-carburizing, and carburizing process. However, if the activated gas species will be analyzed by optical spectroscopic equipment, understanding the nitrogen diffusion mechanism would be deeper and could attribute to optimizing the process condition.
In our research, we mainly investigated the behavior of the neutral ionized gas species with variations of temperature and the composition ratio of gas species (N2, H2, CH4) by Optical Emission Spectroscopy (OES) during the screen plasma process in the chamber which has a double-folded screen. From the surface analysis by OM and SEM, and Glow-Discharge Optical Emission Spectroscopy (GDOES), we could find out how to dissociate to a neutral and an ionic nitrogen and to contribute to diffuse in matrix material. And it has shown a high concentration of nitrogen with the same hardness profiles without a compound layer and the low hardness deterioration of Quenching-and-Tempering treated AISI4140.
2. Experimental Details
2.1. Materials
The used AISI4140 of chemical composition (wt%) is showed as: 0.38% - 0.43% C; 0.15% - 0.35% Si; 0.6% - 0.9% Mn; 0.03% P; 0.03% S; 0.9% - 1.2% Cr; 0.15% - 0.3% Mo; Fe balance (Table 1). The samples to be treated were machined in the form of 30 mm diameter and 15 mm thick discs. The chromium-molybdenum steel sample had 1123 K quenching 1 hour, the 473 K tempering preserving time was about 2 hours. The sample surfaces were mechanically polished sequentially by 220, 400, 600, 800, 1500 and 2000 grit wet SiC emery paper, finely polished with 0.03 μm alumina suspension, further degreased ultrasonically in acetone, cleaned in ethylalcohol, and dried in air blowing before being placed in the screen plasma process chamber.
2.2. Experimental Apparatus
The SPN and SPNC process was carried out using by plasma equipment in Figure 1. It contains a cylindrical stainless-steel vacuum chamber with the dimensions of 1300 mm diameter and a length of 2600 mm. The samples were placed in a double screen set-up where it was directly put on the electrically insulated stage (cathode) of the plasma nitriding unit (the chamber wall served as anode). The double screen was a mesh cylinder with a diameter of 900 mm and a height of 1800 mm, and it was made of 1.0 mm. The double-folded screen insulated with a power supply has been laid inside the chamber and a sample of SPN or SPNC was laid on a Jig with a floating power supply.
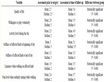
Table 1. Chemical composition of AISI4140.

Figure 1. Experimental concept and screen plasma equipment.
2.3. Screen Plasma Nitriding (SPN) and Screen Plasma Nitro-Carburizing (SPNC) Processing
Table 2 shows the details of each plasma treatment with specimen symbols. After an evacuation of up to 1.33 Pa, the process pressure of the mixed gas for each specimen was adjusted to 20 Pa.
Figure 2 has showed an experimental procedure of a gas flow rate and the process temperature included by soaking the steps of uniformity for about two hours.
We mainly investigated the behavior of the plasma nitriding and nitro-carburizing process at a low temperature with variations of time conditions and a continuous ratio of gas composition (N2, H2, CH4).
The SPN specimen was screen plasma treated at 653 K and 715 K with a mixture of 30% nitrogen gas and 70% hydrogen gas for 4, 10, 20 hr and The SPNC specimen was treated using a screen plasma nitro-carburizing process for 4, 10, 20 hr at 653 K and 713 K with a mixture of nitrogen, hydrogen, and methane gas.
2.4. Analytical Methods
We have traced plasma species in more detail by optical emission spectroscopy (OES, AVANTE AvaSpec-3648) during the screen plasma process. The microstructure analysis was carried out using both optical microscopy (OM: Olympus-BX51TRF) and scanning electron microscopy (SEM: JEOL FE-SEM/EDS JSM-7001F). It was analyzed by glow discharge emission spectrometry (GD-OES: GDA750/SPECTRUMA ANALYTIK GmbH) a composition of hardening layers as functions of time and temperature. The surface hardness and the case depth profiles were determined using a micro-vickers hardness tester (Future Tech FM-7).
3. Results and Discussion
OES analysis is a powerful diagnostic tool for the identification of atomic and molecular species present in the plasma used for surface treatment. We have observed especially radiative transitions of prominent band systems of nitrogen, hydrogen, methane and sputtered Fe as depicted in Table3 The relative emission intensities vs. the nitrogen concentrations are shown in Figure 8. After a low-pressure discharge (0.1 torr) in N2-H2 plasma, in which the screen, and the gas mixture are introduced into the vacuum chamber and the potential, is applied to the cathode. The spectral line intensities are taken when they have reached a stable value. The most intense spectral

Figure 2. The experimental cycle of SPN and SPNC.
Table 2. Processing parameters for SPN and SPNC.
Table 3. Prominent spectral lines of N2-H2-(CH4) plasma [6] -[9] [15] .
lines are measured from the excited ions at a wavelength of  (391.4/427.8 nm) and Hγ (434.1 nm).
Figure 3 and Figure 4, intensities of the two measured Balmer lines H and various plasma species of hydrogen atoms were shown at a high intensity. The analysis of plasma species generated under the SPN and SPNC conditions detected various nitrogen active species.
Figure 3(a) and Figure 4(a) confirm the generation of species with very intense and high peak, and the fact that Hγ which is only in high energy plasma, was observed in relative high intensity in addition to Hα and Hβ shows that the process can create high energy although it is in the very low energy state. As shown in Figure 3(b), Figure 3(c), and Figure 3(d), the N and N+ peaks in the atomic form were generated in significant intensity. On the other hand, (Figure 4(a)), the addition of small quantities of methane (less than 5 sccm) leads to a significant increase in intensity. The increase in emission intensity of nitrogen with the addition of small quantities of methane can be explained due to an increase  (427.8 nm) in the secondary electron emission coefficient.
Figure 4(b) and Figure 4(c) show CH and CN peaks observed in various wavelengths although CH (388.9 nm) is observed only in the SPNC process. Large amount of high intensity neutral nitrogen species along with  and
and  species, which are the active nitrogen species, and NHx plasma species were observed in both SPN and SPNC processes.
In the SPNC process particularly, increasing intensities of plasma generating species were observed by injection mixing of small amount of methane gas, Although C2 was observed in both SPN and SPNC processes, the CH plasma was observed only in the SPNC process.
It is because C2 remaining on the reactor wall was sputtered as the effect of plasma through the several processes while the CH plasma specifies were observed only in the SPNC process.
Figure 5 depicts the result of surface condition observation by SEM in SPN. It shows coating of spherical grains after sputtering on screens in sizes of dozens nm to hundreds nm. As indicated by the result of OES observation shown in Figure 3(a) and Figure 4(a), Fe and Cr are sputtered on the surface of the double-folded screen electrode, and the sputtered Fe and Cr metals react with high density ionized species as they move inside the plasma then form the spherical grains on the surface of the nitriding layer.

Figure 5. SEM surface image of SPN treated specimen.
After the specimen, both screen plasma nitriding and nitro-carburizing had been cut and mounted for microscopic analysis, at Figure 6 have shown images of SPN with a treating time for (a) 4 hr, (b) 10 hr, (c) 20 hr at 653 K. It has clearly shown a tempered martensite structure without a compound layer on the low-temperature SPN conditions with time of Figure 7(a), Figure 7(b), and Figure 7(c). Though according to the process conditions, the screen nitriding process can cause a chemical compound layer (also known as white layer) to occur on the surface of the steel.
Figure 7 shows the pictures of specimen SPN treated at 713 K. (b) and (c) confirm the formation of nitrogen compound layer of 1 μm or less on the surface for 10 hours or longer.
Figure 8 shows the pictures of micro structures at each hour of SPNC treatment at 653 K as well as the cross section in the SPNC process.
Figure 9 shows the pictures of organization under the SPNC 713 K condition. It indicates the hardening depth and degree of etching by expansion of nitrogen are not much different.
Figure 10 shows the micro-hardness profiles an obtained of the SPN as functions of temperature at 653 K and 713 K. Somewhat low measurement of internal hardness at 653 K for 10 hours and at 713 K for 4 hours in Figure 10 can be attributed to somewhat low measurement of hardness of material inside due to the uneven heat treatment during the Q-T process because of the properties of AISI4140 material and overall low hardness of test samples. Still, it shows the trend of 30% - 40% hardness increase over the original material.
Figure 11 depicts the hardness profile of SPNC. It shows the effective hardened layer of hardness of 550 Hv or more and the depth of 25 μm for 4 hours and 90 μm for 10 hours and 20 hours at 713 K. It confirms hardening of surface only without hardness deterioration of core. The surface hardness was 700 Hv and effective hardened layer depth was 30 μm. The surface hardness was 760 Hv and depth was 7 μm in the case of 10 hours, and they were 770 Hv and 100 μm in the case of 20 hours.
 (a)
(a) (b)
(b) (c)
(c)
Figure 6. Structure at different hours of SPN (653 K). (a) 4 hr; (b) 10 hr; (c) 20 hr.
 (a)
(a) (b)
(b) (c)
(c)
Figure 7. Structure at different hours of SPN (713 K). (a) 4 hr; (b) 10 hr; (c) 20 hr.
 (a)
(a) (b)
(b) (c)
(c)
Figure 8. Structure at different hours of SPNC (653 K). (a) 4 hr; (b) 10 hr; (c) 20 hr.
 (a)
(a) (b)
(b) (c)
(c)
Figure 9. Structure at different hours of SPNC (713 K). (a) 4 hr; (b) 10 hr; (c) 20 hr.

Figure 10. Hardness profile at different hours of SPN process.

Figure 11. Hardness profile at different hours of SPNC process.
It was also important to achieve a surface structure with deep diffusion and even without a compound layer and which is characterized by a high nitrided diffusion layer occurring at a depth of about 90 μm with the SPN process and about 100 μm with the PNC process. The analysis has revealed that these granular diffusions consist of a nitrided layer.
Figure 12 depicts the result of nitrogen and carbon chemical composition analysis by GDOES for SPN treatment of (a) 4 hr, (b) 10 hr and (c) 20 hr at 653 K.
Figure 12(a) shows the maximum nitrogen concentration of 4.8 (at%) and carbon concentration of 7 (at%) for 4 hours of SPN treatment; (b) shows the maximum nitrogen concentration of 9.4 (at%) and carbon concentration of 7.5 (at%) for 10 hours of SPN treatment; and (c) shows the maximum nitrogen concentration of 11.7 (at%) and carbon concentration of 6.5 (at%) for 20 hours of SPN treatment.
Figure 13 depicts the result of chemical composition analysis of SPN treated at 713 K. It shows the very high nitrogen and carbon concentrations of (a) 34.1 (at%) and 6 (at%), respectively for 4 hours, (b) 47 (at%) and 10 (at%), respectively for 10 hours, and (c) 32.4 (at%) and 13 (at%), respectively for 20 hours.
Comparison with the hardness profile of the case of SPN process at 653 K and 713 K shown in Figure 10 indicates that the change of nitrogen concentration + carbon concentration and surface hardness almost coincide. Figure 12 and Figure 13 depict total nitrogen and carbon contents and show the hardness increase to significant depth even with small amount of nitrogen and carbon.
Figure 14 depicts the result of SPNC 653 K. It shows the maximum nitrogen concentration and carbon concentration of (a) 7.5 (at%) and 6 (at%), respectively for 4 hours, (b) 5.1 (at%) and 8 (at%), respectively for 10 hours, and (c) 16.8 (at%) and 6 (at%), respectively for 20 hours. Figure 15 depicts the result of SPNC 713 K. It shows the nitrogen concentration and carbon concentration at different hours of treatment (a) 38.9 (at%) and 12.5 (at%), respectively for 4 hours, (b) 36.4 (at%) and 17 (at%), respectively for 10 hours, and (c) 44.8 (at%) and 18 (at%), respectively for 20 hours. Compared to Figure 13 which depicts the result of SPN process at the temperature, they show very high nitrogen and carbon concentrations.
The results of SPNC hardened layer depths in Figure 11 and SPN hardened layer depths in Figure 10 SPNC indicate that the change of surface hardness is more dominated by nitrogen concentration than the carbon concentration.
However, in the SPNC process where the carbon is additionally supplied, the hardness of the lower level layer did not deteriorate greatly and thus the deeper effective hardened layer was obtained.
As shown by Figure 12 to Figure 14, GDOES result indicates that the 1 micron deep layer formed by the grain shape objects formed by sputtering shown in Figure 5, is the nitrides with high nitrogen concentration.
The GDOES result shows that the nitrogen and carbon, which increase the hardening depth, can maintain the high hardness even with a low concentration of a few %.
4. Conclusions
1) Low temperature tempered chromium-molybdenum steel was treated in screen plasma nitriding (SPN) and nitro-carburizing (SPNC) process at temperatures of 653 K and 713 K for 4 hr, 10 hr and 20 hr.
2) The analysis of plasma species generated under the SPN and SPNC conditions indicated various nitrogen
active species in both SPN and SPNC. Particularly the fact that Hγ which is only in high energy plasma, was observed in relative high intensity in addition to the fact that Hα and Hβ shows that the process can create high energy although it is in the very low energy state.
3) Large amount of high intensity neutral nitrogen species along with  and
and  species, which are the active nitrogen species, and NHx plasma species were observed in both SPN and SPNC processes.
4) SNPC is particularly affected by the mixed methane gas to increase the intensity of overall plasma species. That is proven by observation of C2 in both SPN and SPNC processes while CH plasma species were observed only in the SPNC process. As the process is executed several times, C2 remaining in the reactor appears because of the impact by the plasma, but the CH plasma species appear in the SPNC process only.
5) At the treatment temperature of 713 K for 20 hours by such low temperature screen plasma technology, the SPN surface hardness was 850 Hv and 900 Hv in the case of plasma nitro-carburizing. In terms of depth of the hardened layer, the maximum hardness depth of SPNC was around twice deeper than SPN. That was proportional to the increased amount of nitrogen and carbon in the GDOES analysis.
NOTES
*Corresponding author.