Template Matching for Profile Measurement Based on Levenberg-Marquardt Algorithm ()
1. Introduction
At present, one of the common methods about template matching has been used neural network to classify the training to finish matching [1] . Another method is depending on the information of the area overlapping rate and the center relative movement rate from image sequences, to complete the matching for object recognition [2] [3] . These methods have their own characters. To get a more effective method, Levenberg-Marquardt algorithm is presented. This algorithm has both fast convergence properties of Gauss Newton method and global search properties of the gradient search method. The L-M algorithm optimizes the parameters of the initial contour transformation matrix, which can reduce the error between the measurement contour and the template contour, achieving more accurate matching. Transformation matrix is the matrix of changing the coordinate system of the original profile image into that of the template profile image.
Fast and accurate template matching method has a great significance in many areas.
2. The Principle of L-M Algorithm
Now, the principle of L-M algorithm is introduced simply.
Error function is showed in Equation (1):
 (1)
(1)
where  denotes the current error.
 is variable value of
  after iterating k times,
  is the next step of iteration.
 (2)
(2)
The equation of the improved Gauss-Newton method:
 (3)
(3)
where  is Jacobi matrix of
 ,
,  is unit matrix,
  is known as the proportional factor and
 .
.
When  is true, Equation (3) is called Gauss-Newton method; when the value of
  is large, Equation (3) is similar to the gradient descent method. Iterating step by step, if it is closer to the optimization goal,
  is gradually decreased, with the rapid convergence of Gauss Newton method. On the contrary, if it is away from the optimization goal,
  is increasing gradually with the gradient descent method. Therefore, the L-M algorithm is a combination of Gauss Newton method and gradient descent method, with the advantages of both.
3. Optimization of Parameters [4] [5]
The contour matching is a process to obtain the best matching, using the same object obtained from different camera contour to transform into the same coordinate system. There is overlap part in two profile images, with the measurement contour image as the optimal image and the template contour image as the target image. The coordinate of optimal image can obtain the coordinate of target image through a transformation matrix. As usual, the transformation matrix has three rows and three columns, containing the rotation variables and the translation variables. The transformation matrix is denoted H:
 (4)
(4)
where h1, h2, h4 and h5 represent the rotation variables, h3, h6 represent the translation variables. h7, h8 is very small usually, so they could be equal 0. h9 is the normalized constant, so h9 is considered to be 1.Thus, there are six parameters to be optimized.
The key issue of template matching is how to reduce the matching error, and the paper utilizes the L-M algorithm to solve this problem. At first, a certain number of corresponding feature points is determined, feature points from calibration. Then, the initial transformation matrix is obtained by calibration method.
Assuming the number of feature points is n.  denotes the coordinate of original contour image.
  is the coordinate after transforming by
 , or known as measurement contour image.
  represents he coordinate of template contour image. Because there are six parameters to optimize, the condition should be met in theory that
  is true. However,
  is required to be much bigger than 3 for a better transformation matrix.
The relationship of  and
and  is showed below:
 (5)
(5)
Error function is expressed concretely as:
 (6)
(6)
The differential on  in Equation (6):
 (7)
(7)
With the addition, the deformation Equation of Equation (5):
 (8)
(8)
Combine Equation (7) with Equation (8), Jacobi matrix can be solved.
 (9)
(9)
The calculation steps of L-M algorithm, as follows:
1) Given several conditions, one is , another is
 .
.  denotes the control constant for iterations being stopped . The initial vector
  can be worked out by feature points.
2) The measurement contour image would be calculated out by the transformation matrix , and also error function.
3) According to the former introduction, the next goal is to calculate Jacobi matrix.
4) Structure equation:

where .
.
5) Work out  according to the equation of the last step. If
  is true, stops iterating and puts out the results. Or, assume that
  and calculate
 , and then make the following judgments:
a) If , then
  and
and , turn to (2).
b) If , then
 , turn to (4).
4. Experimental Results and Analysis
The first step of the experiment is to obtain the rail profile. Figure 1 shows the experiment principle diagram. There are two cameras to be used, one is over the rail, and another is on the left. The images from the two cameras are cross, because there is the same part in the range of camera’s vision. For the errors, intersection part does not fully coincide. The L-M algorithm is to reduce the error and make the coincidence degree of intersection part better. While each camera is on different coordinate system, the two coordinate system need to unify, Camera 1 and Camera 2 take pictures respectively, and the pictures are shown in Figure 2.
To unify the two coordinate systems is not hard, and it can be come true that rail change into calibration block. The initial matrix H has been worked out by feature points. Once coordinate systems are unified, rail measurement profile is shown in Figure 3. In Figure 2, the red line represents the template contour image, and the blue line represents the measured profile image to be optimized. The overlap of the template contour and profile measurement is magnified, as shown in Figure 4, which can clearly reflect the error is large, so using optimization algorithms to reduce the matching error is necessary. Figure 5 shows the experimental results.
Two groups’ coordinate have been obtained, and then the error of the two groups’ coordinate also can be solved. Original results are compared with results by using L-M algorithm in four aspects, including mean, standard deviation, maximum, and the numbers of value larger than 0.2. The results are listed in Table1
From Table 1, it is intuitively showed that the results of the L-M algorithm in the four indexes are better than the initial ones, so this method works.
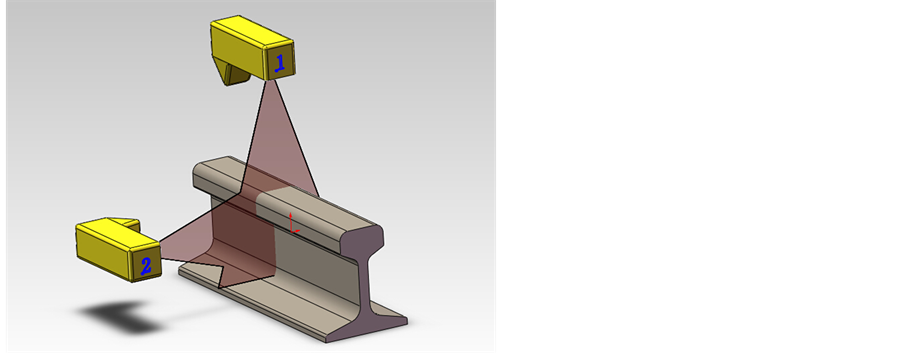
Figure 1. The experiment principle diagram.
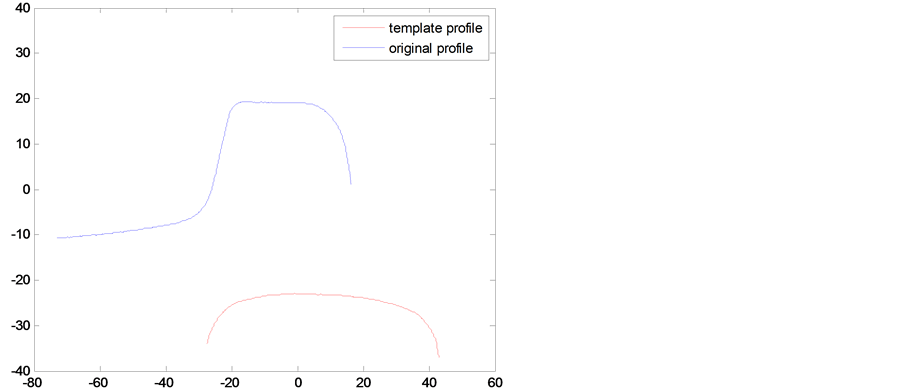
Figure 2. The picture from two cameras. (The red line from camera 1, the blue from camera 2).
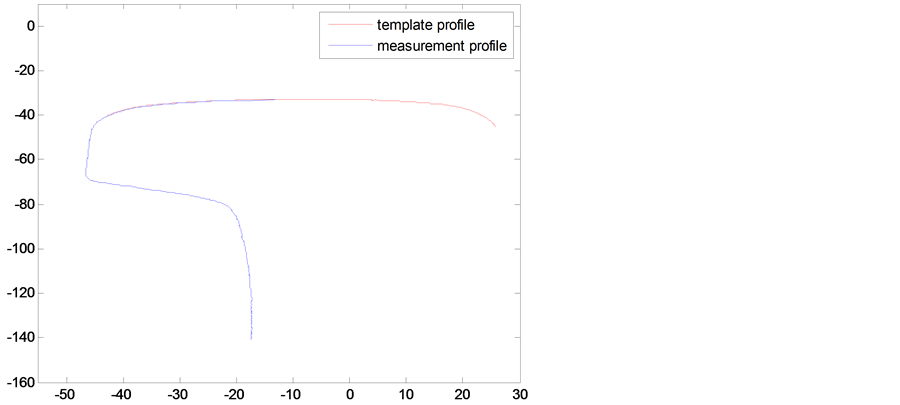
Figure 3. Rail profile unified on the same coordinate systems.
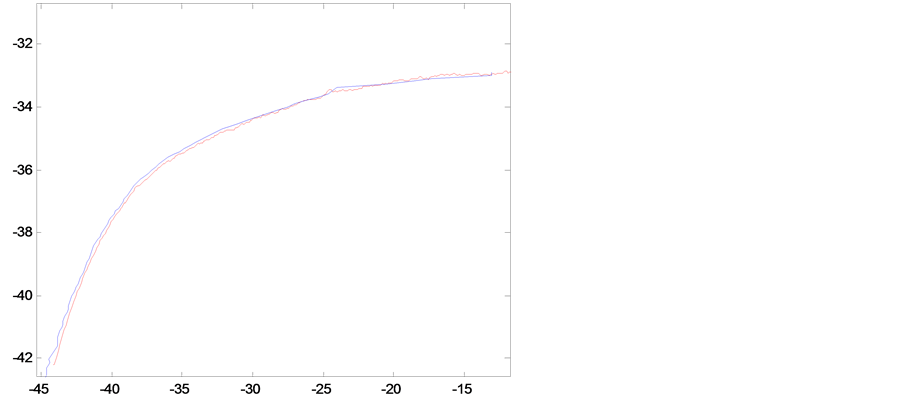
Figure 5. Matching result diagram by L-M algorithm.
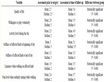
Table 1. The comparison between Original results and results by using L-M algorithm.
5. Conclusion
This paper proposes the L-M algorithm to optimize the parameters of the transformation matrix. This method can reduce the error between the measurement contour and the template contour. Experimental results show that the L-M algorithm can effectively solve the problem of the contour template matching.
Acknowledgements
Authors are grateful for the support of Scientific Research Innovation Project of Shanghai Education Commission (Granted No. 12YZ149, No. 12ZZ184) and Discipline Construction Project for Transportation Engineering (Granted No.: 13SC002), as well as Postgraduate Research Innovation Project (Granted No.: A-0903-13-01124).