Finite Element Analysis of the Groove Pressing of Aluminum Alloy ()
1. Introduction
During last decade, severe plastic deformation has received a great attention among researchers as an effective method of producing ultrafine grain nanostructured materials [1-3]. Several methods have been proposed, developed and evaluated [4-7]. These methods include equal channel angular pressing (ECAP) [8], high pressure torsion (HPT) [9], cyclic extrusion and compression (CEC) [10]. However, previously mentioned methods are not suitable for processing plate-shaped samples. Recently, accumulative roll bonding has been proposed by saito et al. [11] to produce plate-shaped nanostructured samples. In this method repetitive perfect bonding between two plates must be achieved, otherwise mechanical properties of produced sample can be degraded by bonding surface. Another severe plastic method with great potential to produce ultrafine grained plates is constrained groove pressing (CGP) [12,13]. Mechanical properties of processed materials with this method are the same as those with other methods because no bonding is necessary. Figure 1 shows the principals of CGP process. As can be seen, at first deformation step, a plateshaped sample is pressed between two grooved dies (Figure 1(b)). At second step, the deformed sample is flattened by using two flat dies (Figure1(c)). At third step, plastic deformation is imposed on previously flattened sample using the same grooved dies as first deformation step. But before imposing third step, the flattened sample is shifted one groove length (t in Figure1(a)) to left or right and consequently the unreformed regions of sample after first deformation step are placed between inclined parts of die and deformed by shearing (Figure 1(d)). At forth step, the deformed sample is flattened between two flat dies the same as second step (Figure 1(e)). Although several experimental investigations have been conducted using different materials such as commercial pure aluminum [14,15], copper [16] and tow phase alloys [17], there is little information in literature about numerical investigation of this method. In the present paper, the severe deformation of Al-1%Mg alloy is studied using FEM analysis with emphasis on inhomogeneity in imposed plastic strain.

Figure 1. Schematic representation of CGP process.
2. Finite Element Analysis
The simulation were carried out using the commercial FEM code ABAQUS. Since the CGP process is a plain strain problem the two dimensional plain strain models were used. The Al-1%Mg alloy was chosen as a model material. To obtain correct simulation results it is necessary to use an appropriate material constitutive model. This model must consider the effects of strain, strain rateand temperature on flow stress. Thereby the Johnsoncook model was used in the simulations. In this model the flow stress is expressed as follows [18]:
 (1)
(1)
where σ is the flow stress,  is the strain rate, T is a temperature,
 and Tr are reference strain rate and temperature respectively, Tm is melting temperature and A, B, n, m and C are material constants. These material properties for Al-1%Mg alloy are listed in Table 1.
In the simulation the plate with geometry of 5 (width) × 80 (length) mm2 was modeled with total number of 1600 temperature coupled displacement (CPE4RT) elements. The pressing speed and coefficient of friction between the die and specimen were taken to be 1 mm/s and 0.1 respectively. Average equivalent plastic strain across the section of plate was calculated by following equation [20]:
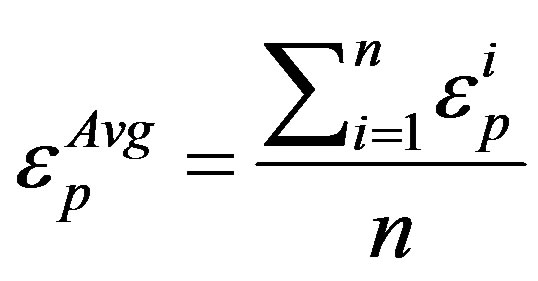 (2)
(2)
where 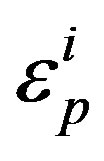 an equivalent plastic is strain at node i and n is the total number of nodes in the cross section of specimen. Degree of inhomogeneity at imposed plastic strain can be calculated by coefficient of variance of εp as follows [20]:
 (3)
(3)
where, Stdev (εp) is the standard deviation of imposed
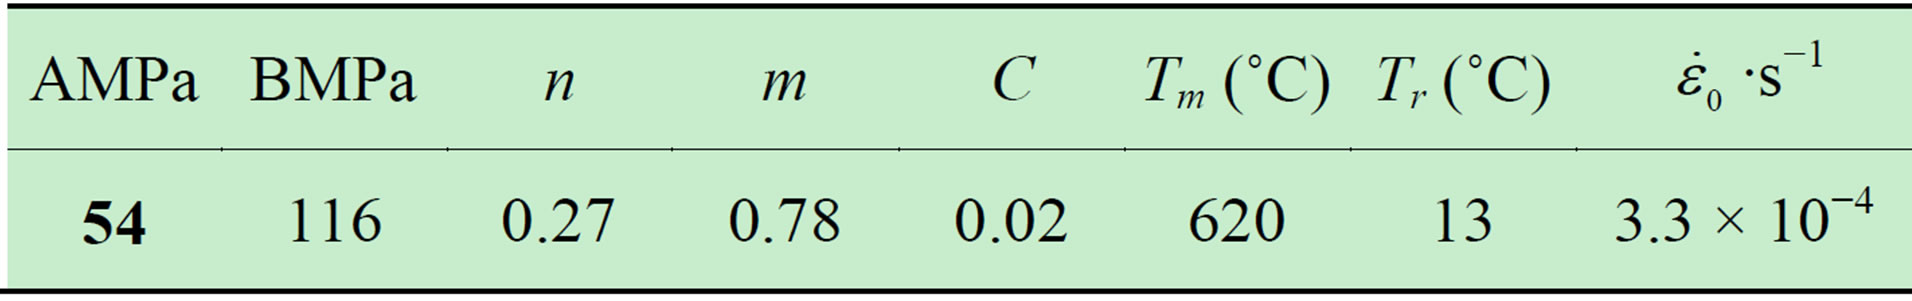
Table 1. Material constants of Al-1%Mg alloy [19].
equivalent plastic strain in cross section of sample.
3. Results and Discussions
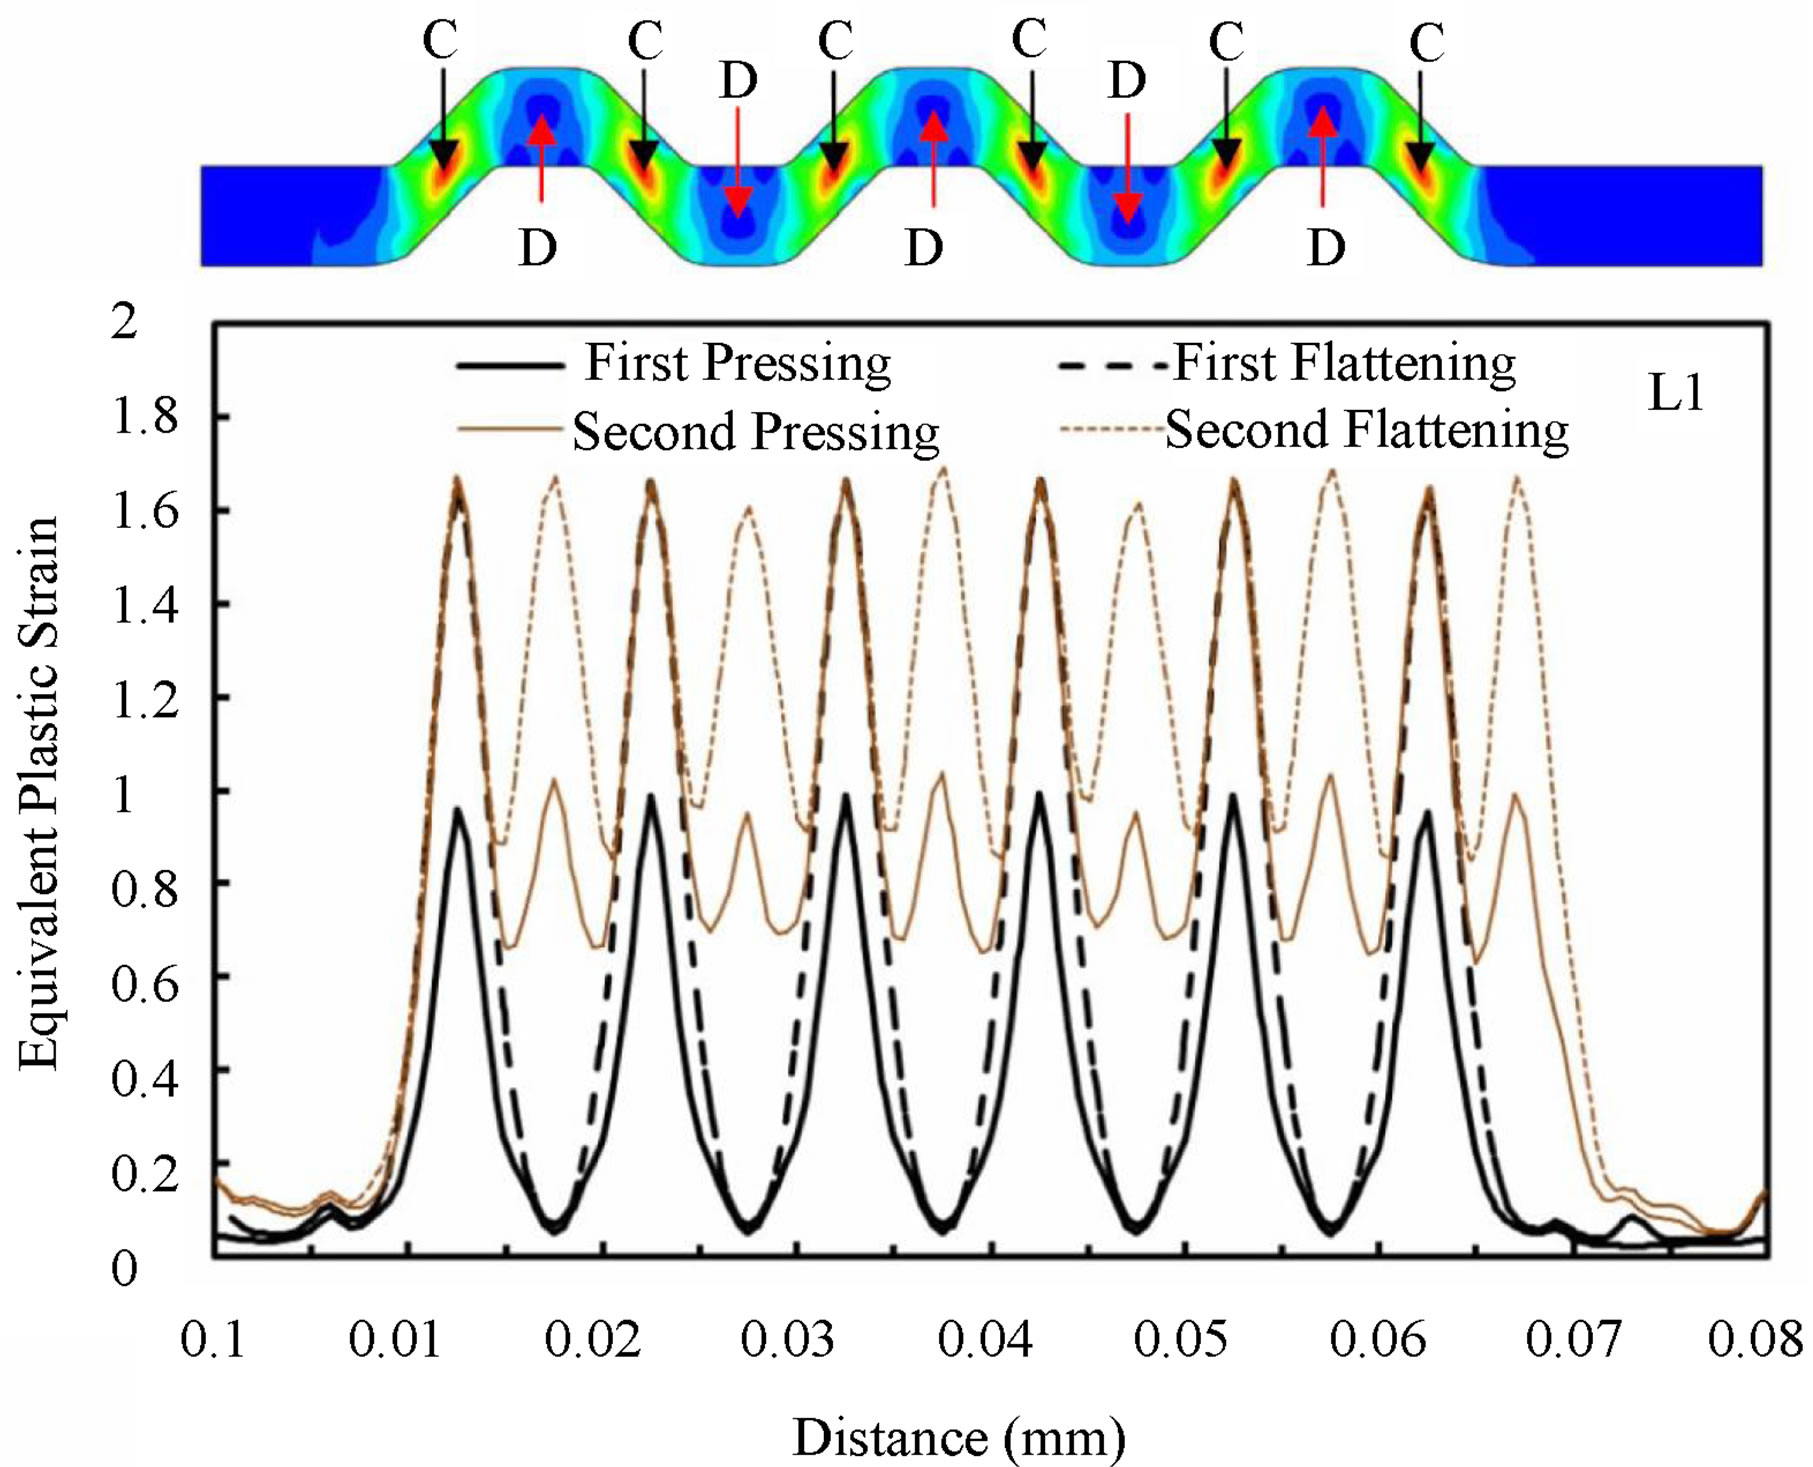
In the previous experimental works, it was assumed that deformation occurring in the inclined regions is a simple shear and uniform. In this regard, the plastic strain introduced by shearing was calculated simply by equation γ = tg(θ), where θ is a inclination angle as shown in Figure 1. This assumption leads to uniform plastic strain distribution after each 4n (n = 1, 2,…) deformation step [21]. Figure 2 shows the simulated distribution of equivalent plastic strain in sample after pressing and flattening steps.
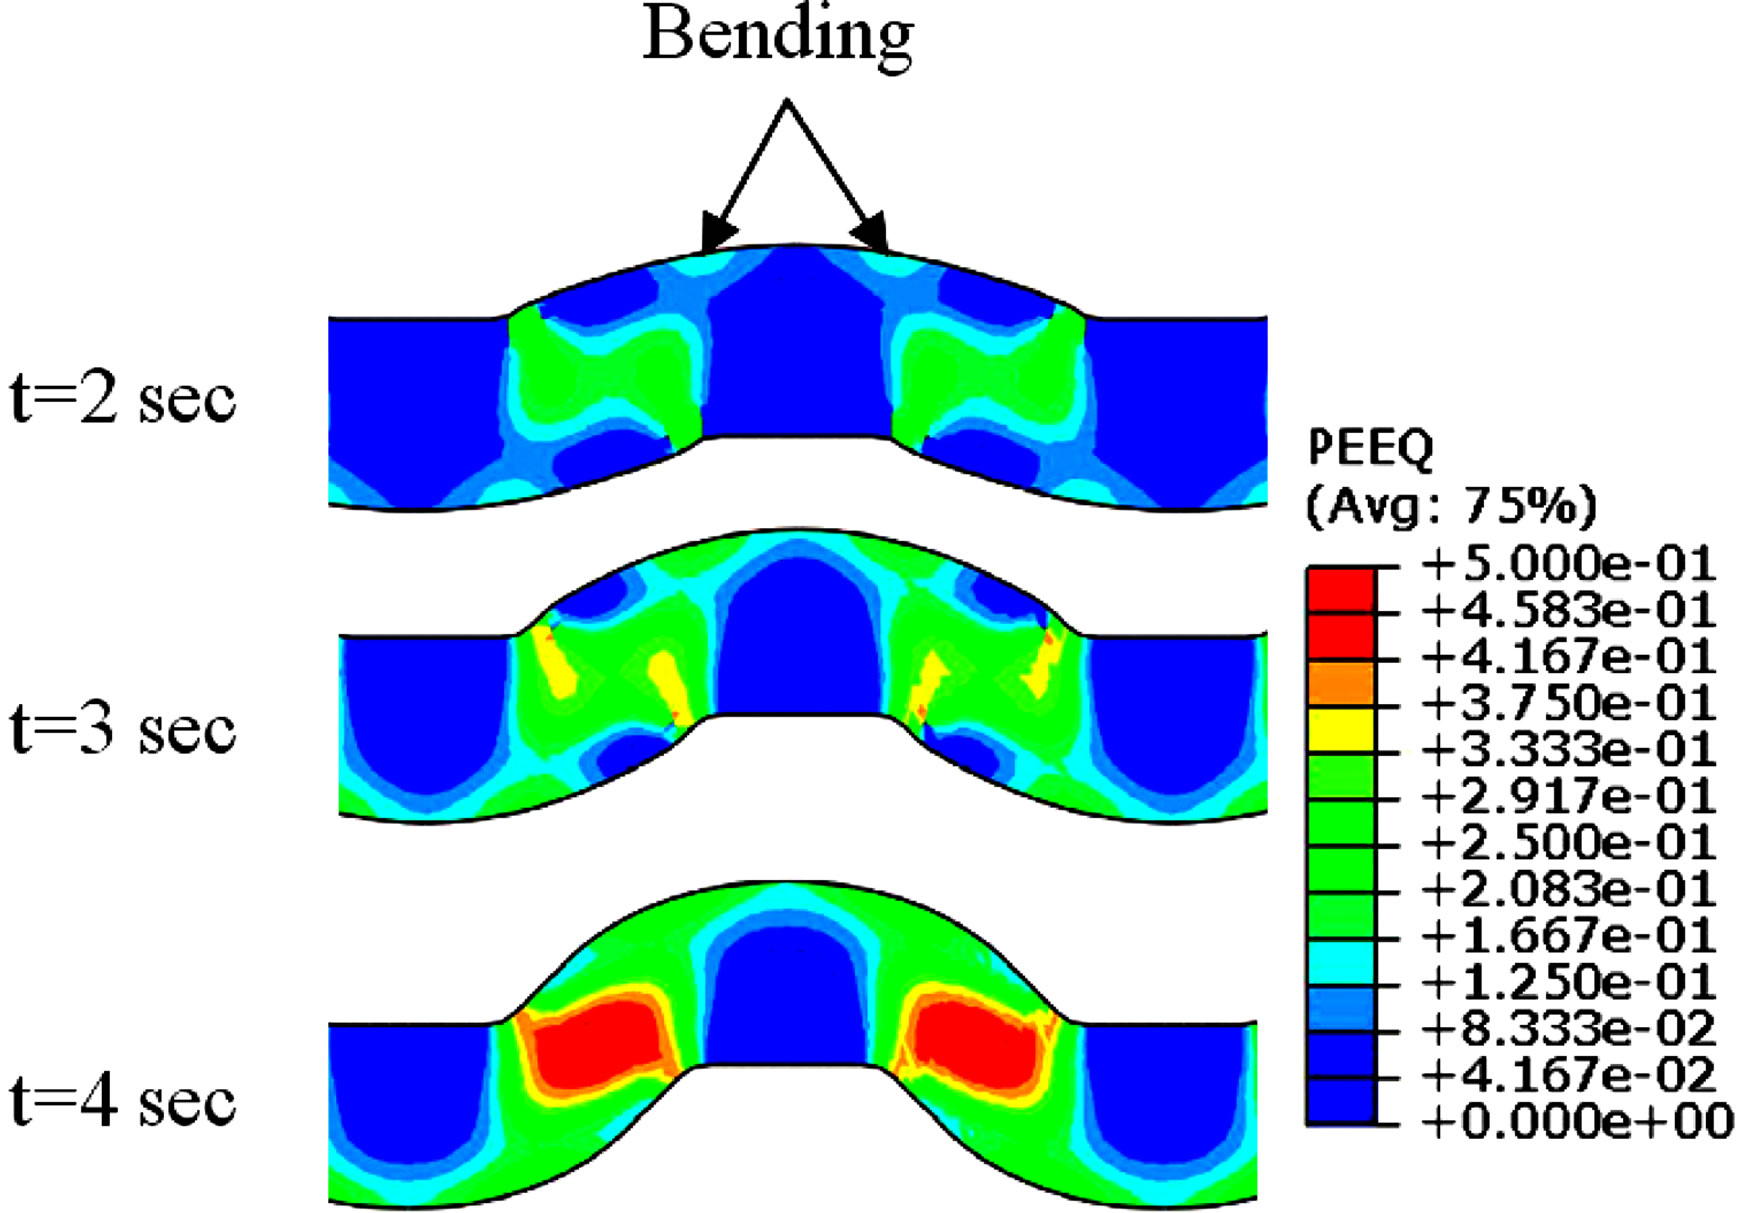
Inspection of this figure reveals that after 4n pass, the imposed plastic strain on material is not uniform. Also the material between inclined parts of grooved die is deformed by shearing during pressing (1st Step) and material between flat parts of die remains almost unreformed. As can be seen in this figure, the plastic strain distribution at inclined regions (1st Step) is not uniform. This inhomogeneous distribution of strain at these regions finally (after every 4n step) leads to an inhomogeneity in imposed plastic strain. The equivalent plastic strain distributions on L1 and L2 lines from Point A to B (as depicted in Figure 2) are shown in Figure 3. Oscillations in plastic strain distribution on L1 line is due to the fact that during every deformation step the central points of inclined regions (shown in Figure 3 by C letter) are subjected to maximum shear deformation but central points of flat regions (D in Figure 3) receive no deformation. Regions between C and D are subjected to shear deformation less than point D and with moving from point D toward C, the imposed strain increases. Profile of strain on L2 line is similar to L1 line but with one important difference. Comparing strain distribution on these two lines after first pressing, it’s inferred that peak strains on L2 line are twice the peaks on L1 line. Minor peaks (six peaks shown by arrows in Figure 3) are due to maximum shear deformation similar to L1 line. To explain the origin of major peaks, it’s necessary to inspect the deformation of plate during pressing step. Figure 4 shows the equivalent plastic strain and shear stress distributions at different times during first pressing. It is shown that the shear component of stress is higher at inclined regions but at near surface regions corresponding to major peaks (shown by arrows), its value is very low. Therefore these regions on L1 line are deformed by bending before the completion of pressing.

Figure 2. Equivalent plastic strain distribution in sample deformed up to ten steps.
 (a)
(a)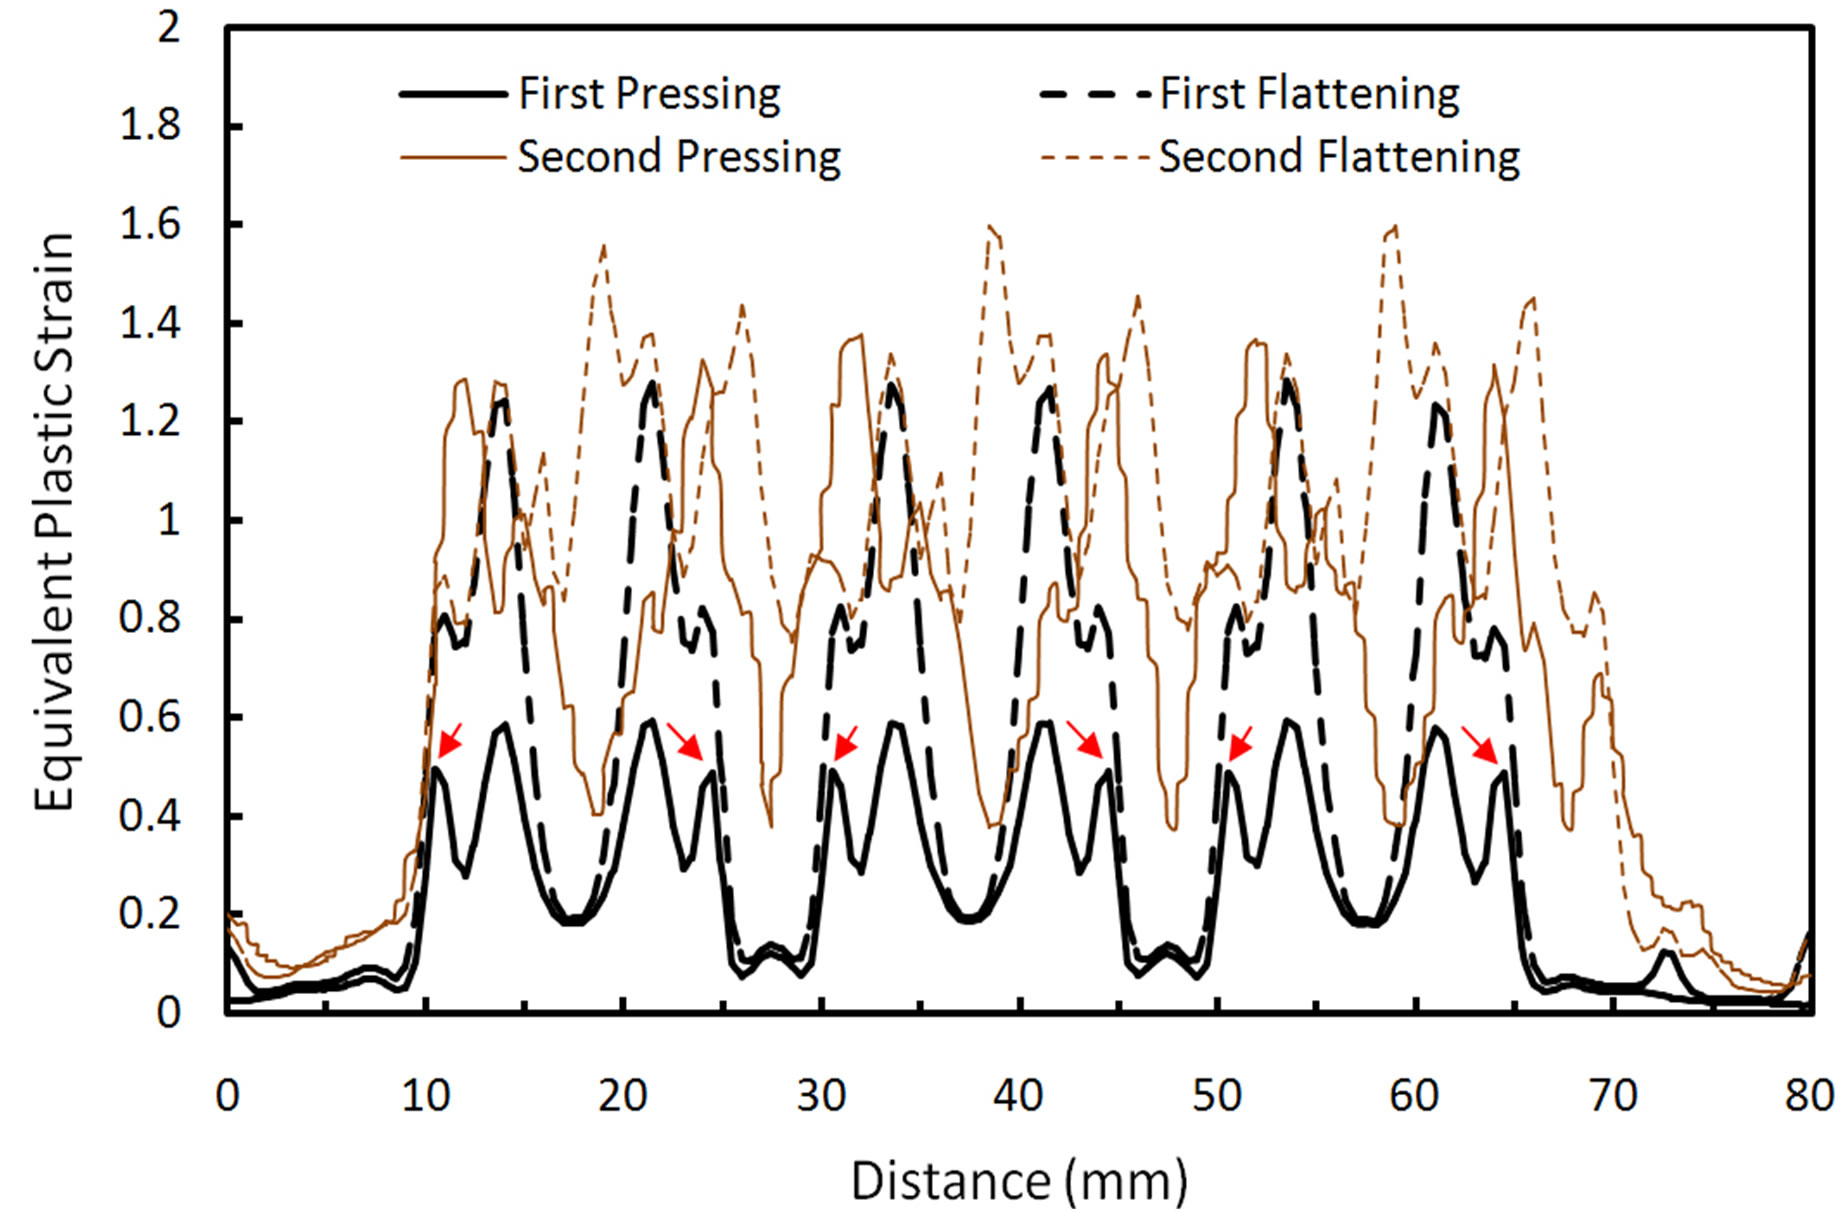 (b)
(b)
Figure 3. Equivalent plastic strain distribution on L1 and L2 lines from point (a) to (b) after different deformation steps.
 (a)
(a) (b)
(b)
Figure 4. Equivalent plastic strain and shear stress distributions at different times during first pressing.
It’s deduced that imposed plastic strain on sample is not a pure shear. Shearing occurs mostly at inclined regions and bending occurs mainly at near surface regions. Therefore the strain at every point is due to interaction between shearing and bending. It’s worth noting that the amount of shearing and bending varies from point to point. Figure 5 shows the average strain and inhomogeneity factor of imposed plastic strain across the section of deformed plate after each deformation step. As can be seen, the average plastic strain increases monotonically with deformation step. After first pressing (1st step) the imposed strain is inhomogeneous because only materials at inclined regions are subjected to severe deformation but regions between flat parts of die receive low plastic deformation. After 2nd step the inhomogeneity increases because the same regions are deformed during flattening. Before imposing 3rd step the plate is shifted one groove length to left or right and consequently during 3rd and 4th step the unreformed regions (during 1st and 2nd steps) are subjected to severe deformation. This leads to improvement of plastic strain distribution in sample. Hence at every deformation cycle (each cycle comprises 4 steps), first pressing and flattening increase the inhomogeneity but second pressing and flattening improve the strain distribution. As shown in Figure 5, after 4th and 8th steps the inhomogeneity factors (0.55 and 0.54 respectively) are still high and never reach to zero (theoretical value) with more deformation. As previously mentioned, this is due to the fact that regions between C and D (shown in Figure 3) receive less deformation during every step. Figure 6 shows the evolution of plastic strain with time at three nodes selected on center line of plate. Node 1 and Node 3 are in the center of flat and inclined regions (at first pressing) respectively and Node 2 is between them. As can be seen after every 4 steps, the plastic strain at Node 1 and Node 3 reaches the same value but at Node 2 the

Figure 5. Average strain and inhomogeneity factor of imposed plastic strain across the section of plate after each deformation step.

Figure 6. The evolutions of plastic strain with time at three nodes selected on the center line of deformed plate.
plastic strain is less than strain at Node 1 and Node 3.
NOTES