Determination and Analysis of Structural and Optical Properties for Thermally Evaporated ZnO Thin Films ()
1. Introduction
Zinc oxide is an interesting direct and native n-type semiconductor with a large bandgap energy of 3.37 eV and free excitation energy of 60 meV at room temperature. Thin films of ZnO are being used or excellent candidates for ultraviolet (UV) and visible (green) light optoelectronics, photoconducting, piezoelectric and optical waveguide materials. Zinc oxide (ZnO) has a hexagonal close-packed structure (wurtzite type) exhibiting very excellent piezoelectric and optical properties [1-3]. Deposition of ZnO thin films can be performed using sputter deposition, chemical vapor deposition (CVD), spray pyrolysis, pulsed laser deposition, metal-organic chemical vapor deposition (MOCVD), sol-gel and reactive evaporation [4].
The optical properties of thin films have been investigated by various analytical and numerical methods [5-8]. In these methods for calculation of optical constant of thin film such as the refractive index n(λ), extinction coefficient k(λ) and the thickness of film, the transmittance data can be used. ZnO films have been deposited on glass slide substrates at room temperature by thermal evaporation technique. In this study, the transmittance data and the Swanepoel-Heavens’s method in the frame of point-wise unconstrained minimization approach (PUMA) have been utilized for optical characterization of the as-deposited and annealed ZnO film.
2. Experiments and Methods
Thin films of ZnO were deposited onto ultrasonically pre-cleaned glass slide substrates by thermal evaporation technique at background pressure of 5 × 10⁻⁴ mbar. Tungsten boat was used for evaporating ZnO powder (99.99% purity) and the distance between the boat and samples was about 20 cm. Deposition process was done at room temperature. The prepared samples were annealed at temperature of 300˚C and 400˚C.
Optical studies were performed by measuring transmittance in the wavelength region 350 - 800 nm using spectrophotometer (Cary-100, UV-Visible) at room temperature. Optical constant of thin film such as the refractive index n(λ), extinction coefficient k(λ) and the thickness of film are calculated using spectral fitting or reverse engineering method.
Structural characterization was done ex-situ by X-ray diffractometer (XRD, D8 Advance Bruker) with a  radiation source in
  scan mode. Lattice constant was extracted from peak position of XRD reflection. The mean size of nano-crystallites and microstrain was estimated from peak broadening.
3. Result and Discussion
3.1. Optical Properties
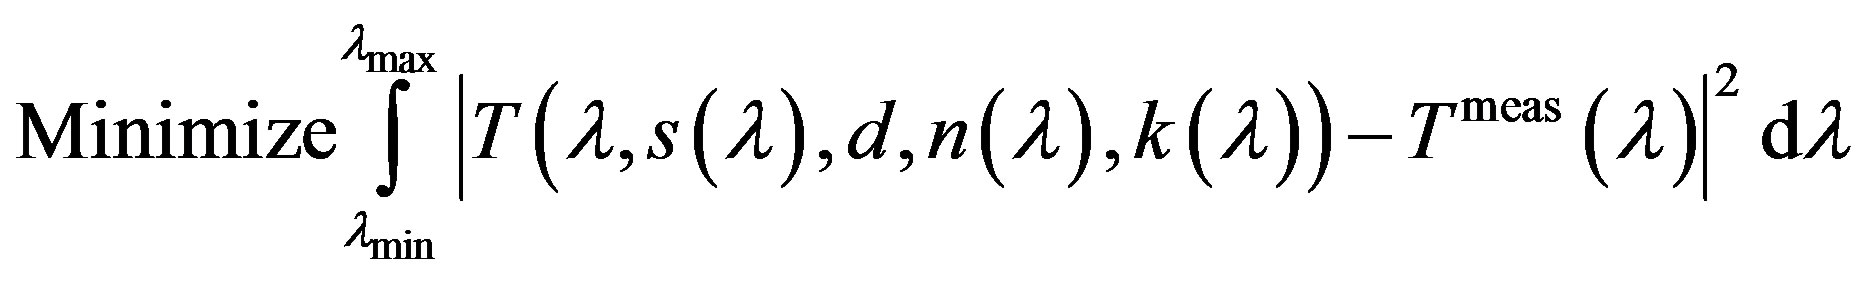
Figure 1 depicts normal (perpendicular) transmittance of the ZnO film deposited on the glass slide by thermal evaporation. There is an easy approach for determination of optical constants, which depends on single transmittance measurement. The refractive index n and the extinction coefficient k as well as the thickness d of polycrystalline ZnO thin films studied here were determined from transmittance data by only using PUMA approach and code described by Birgin et al. [5]. This method implements the complex optical equations, shown below derived and formulated by Heavens [6] and Swanepoel [7]. The transmittance T of a thin absorbing film deposited on a thick transparent substrate is given by:
 (1)
(1)
where
where s is the refractive index of the substrate, n and k are respectively the real and imaginary parts of the refractive index of the film. d is the film thickness,  is the wavelength of the incident light and
  is the absorption coefficient of the film. Birgin et al. [5] presented that the continuous least square solution of the estimation problem is the solution (d, n and k) of
 (2)
(2)
subject to some physical constraints.
Glass slide substrate is sufficiently thick such that the addition of interference effects resulting from multiple reflections in the substrate is eliminated. The experimental transmittance data are compared with theoretical values, in PUMA code. The difference between the two values is minimized until a best solution is achieved for the refractive index n, the extinction coefficient k and the film thickness d. Poelman et al. [8] have reviewed and tested PUMA approach and shown it to produce excellent estimate of optical constants of thin films.
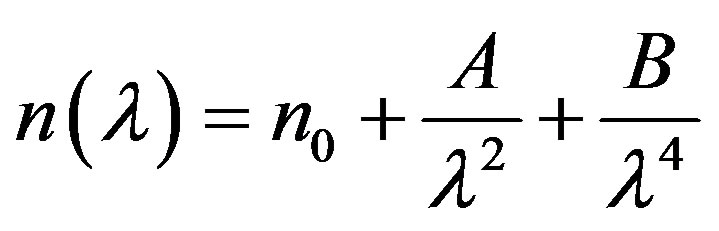
The variation of the refractive index n with the wavelengths is shown in Figure 2. For the as-deposited sample, the refractive index is found to decrease with increase in wavelength of the incident photon and then at higher wavelength of the incident photon, the refractive index tends to be constant. For the sample annealed at temperature of 300˚C and 400˚C, the values of refractive index can be fitted to the Cauchy dispersion relation [9].
 (3)
(3)
where n0 is static refractive index and A and B are the fitting parameters.
These parameters are listed in Table 1 to determine the film thickness, d, a number of thicknesses are extracted from fitting process and then mean of d is calculated. The maximal deviation from mean value of thickness can be considered as a well estimation of film’s roughness.
Figure 3 shows dispersion of the calculated extinction coefficient k as a function of wavelength in the 350 - 800 nm range. The absorption coefficient of ZnO films is related to extinction coefficient through  (Figure 4). For the sample annealed at temperature of

Figure 2. Dispersion of refractive index (n) of the as-deposited and annealed samples.

Table 1. static refractive index (n0) and other fitting parameters (A, B) with Cauchy relation, films’ thickness (d) and roughness, lattice parameters (a, c), mean crystallite size (D) and microstrain  of the as-deposited and annealed samples.
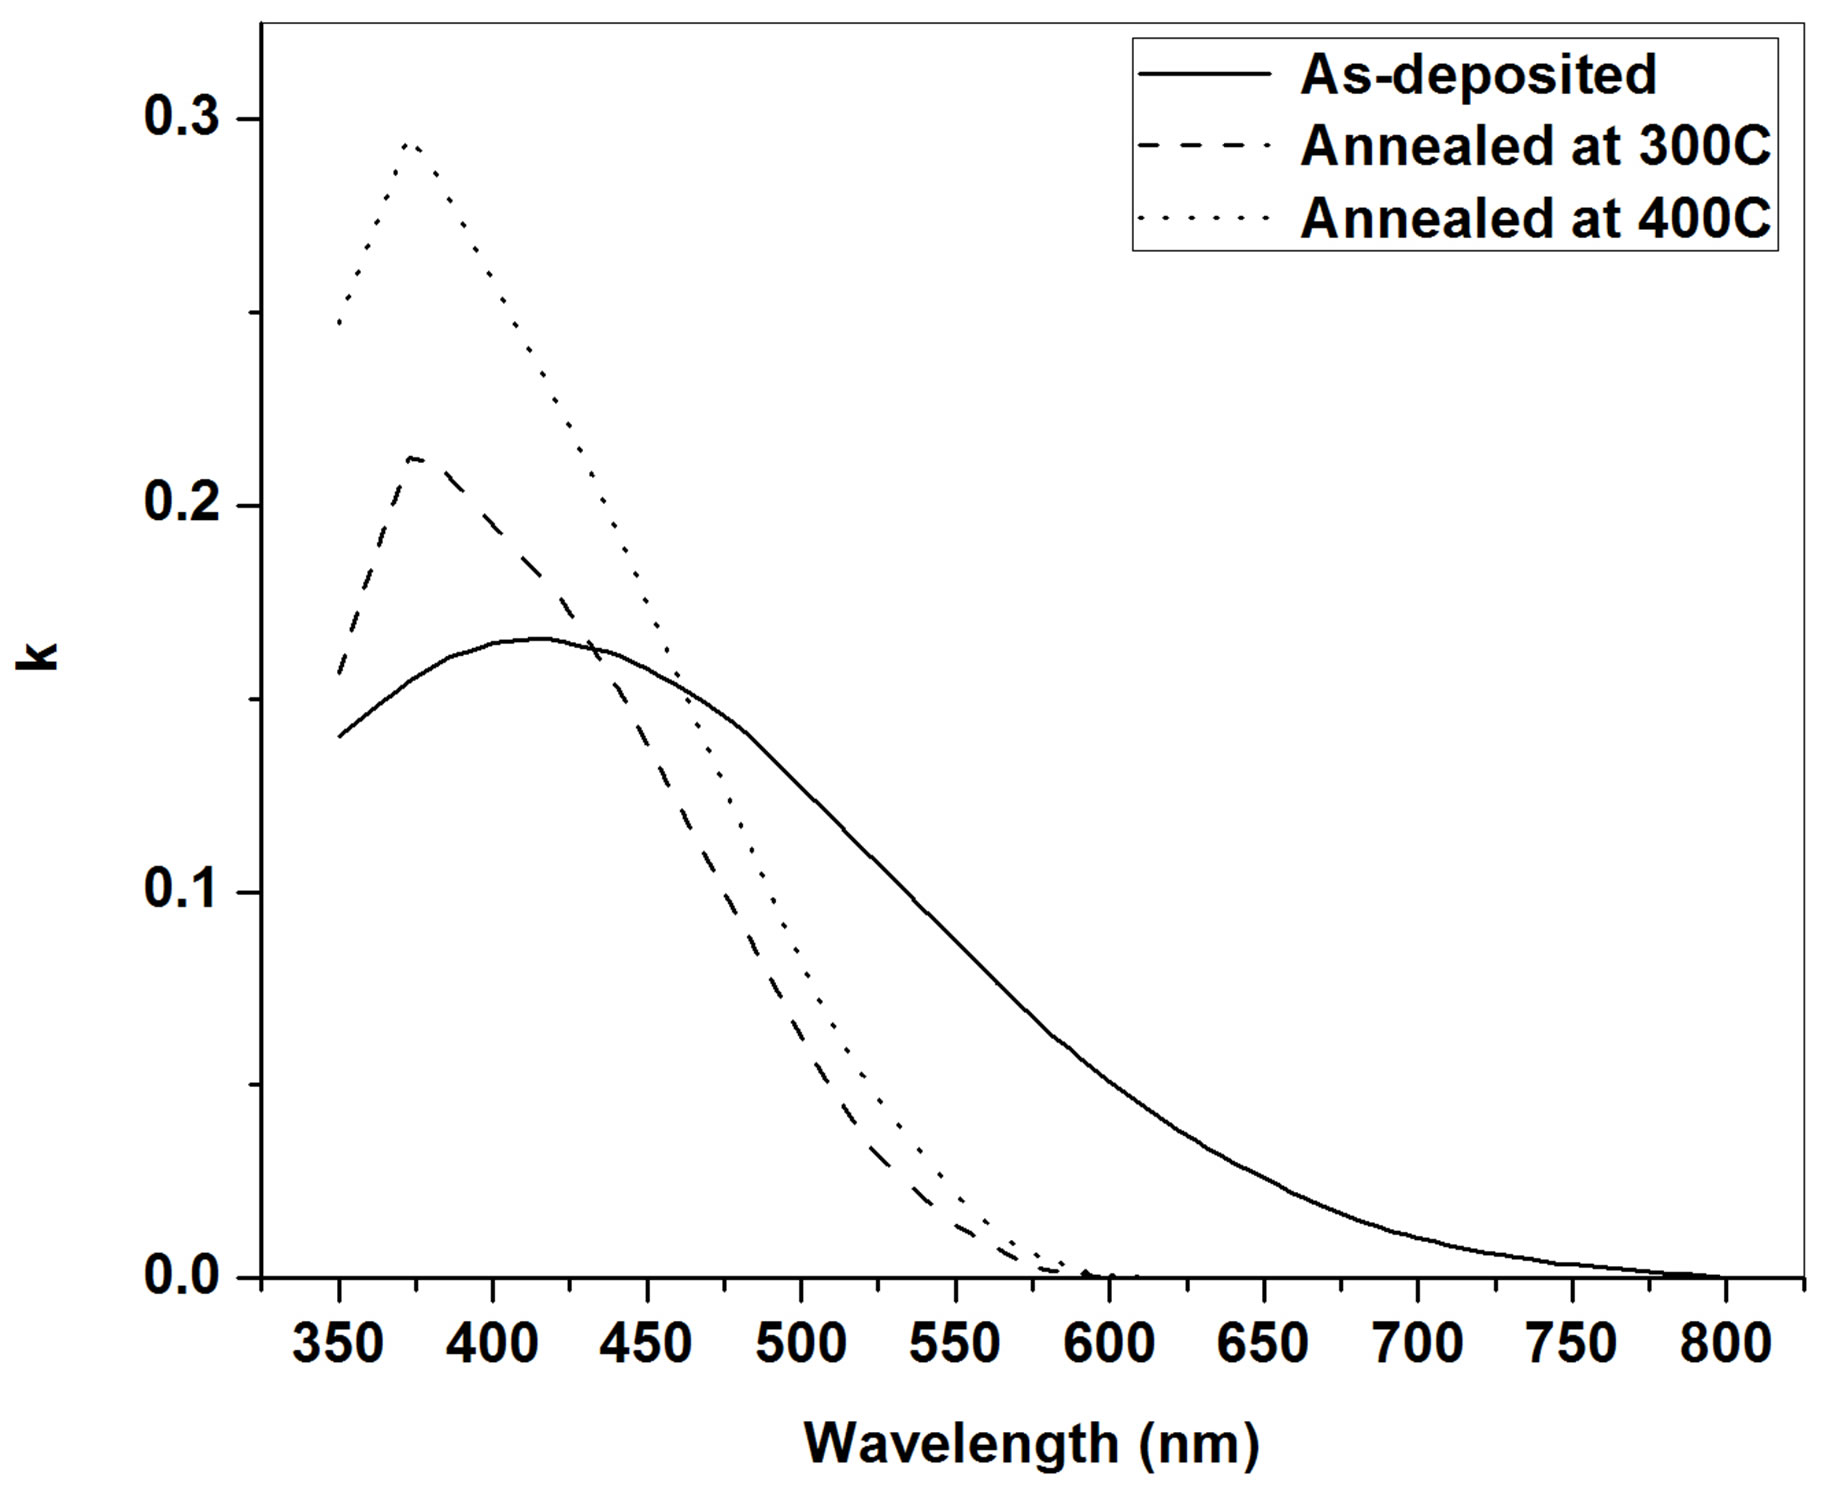
Figure 3. Dispersion of extinction coefficient (k) of the asdeposited and annealed samples.
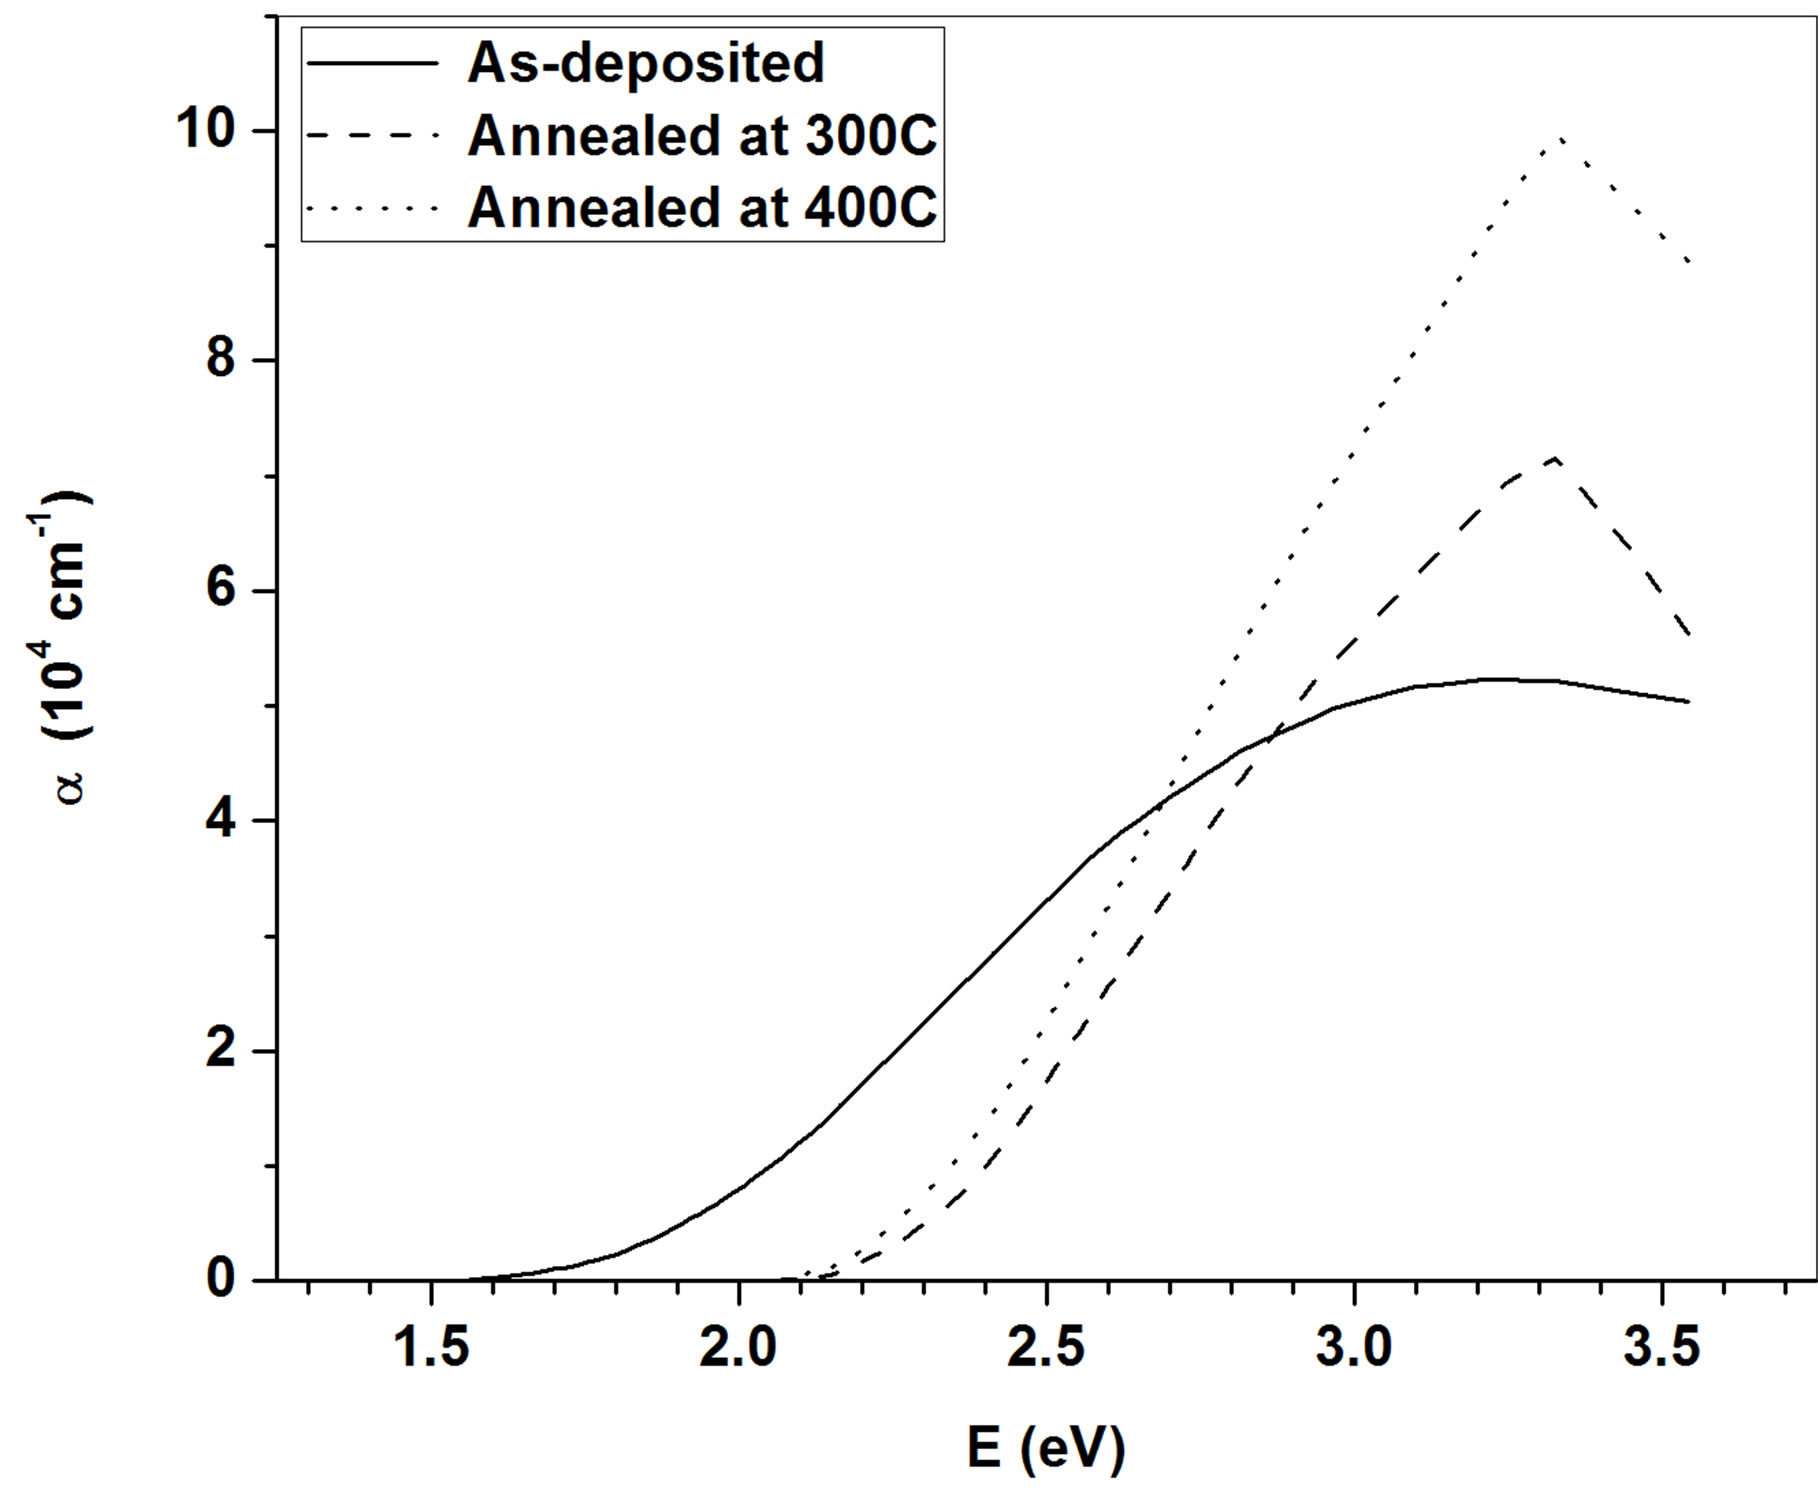
Figure 4. Absorption coefficient of of the as-deposited and annealed samples.
300˚C and 400˚C, absorption coefficient has a peak around 3.33 eV.
3.2. Structural Properties
Figure 5 depicts XRD pattern of the annealed ZnO thin film at temperature of 400˚C and related (100) and (101) reflection correspond to hexagonal closed packed structure (wurtzite type). The film is single phase and polycrystalline.
The lattice parameters (a and c) of the ZnO was calculated from the X-ray peak position of lattice plane reflex (hkl). In hexagonal crystal structure, for each lattice plane distance, the corresponding lattice parameter ahkl value was determined from [10]
 (4)
(4)
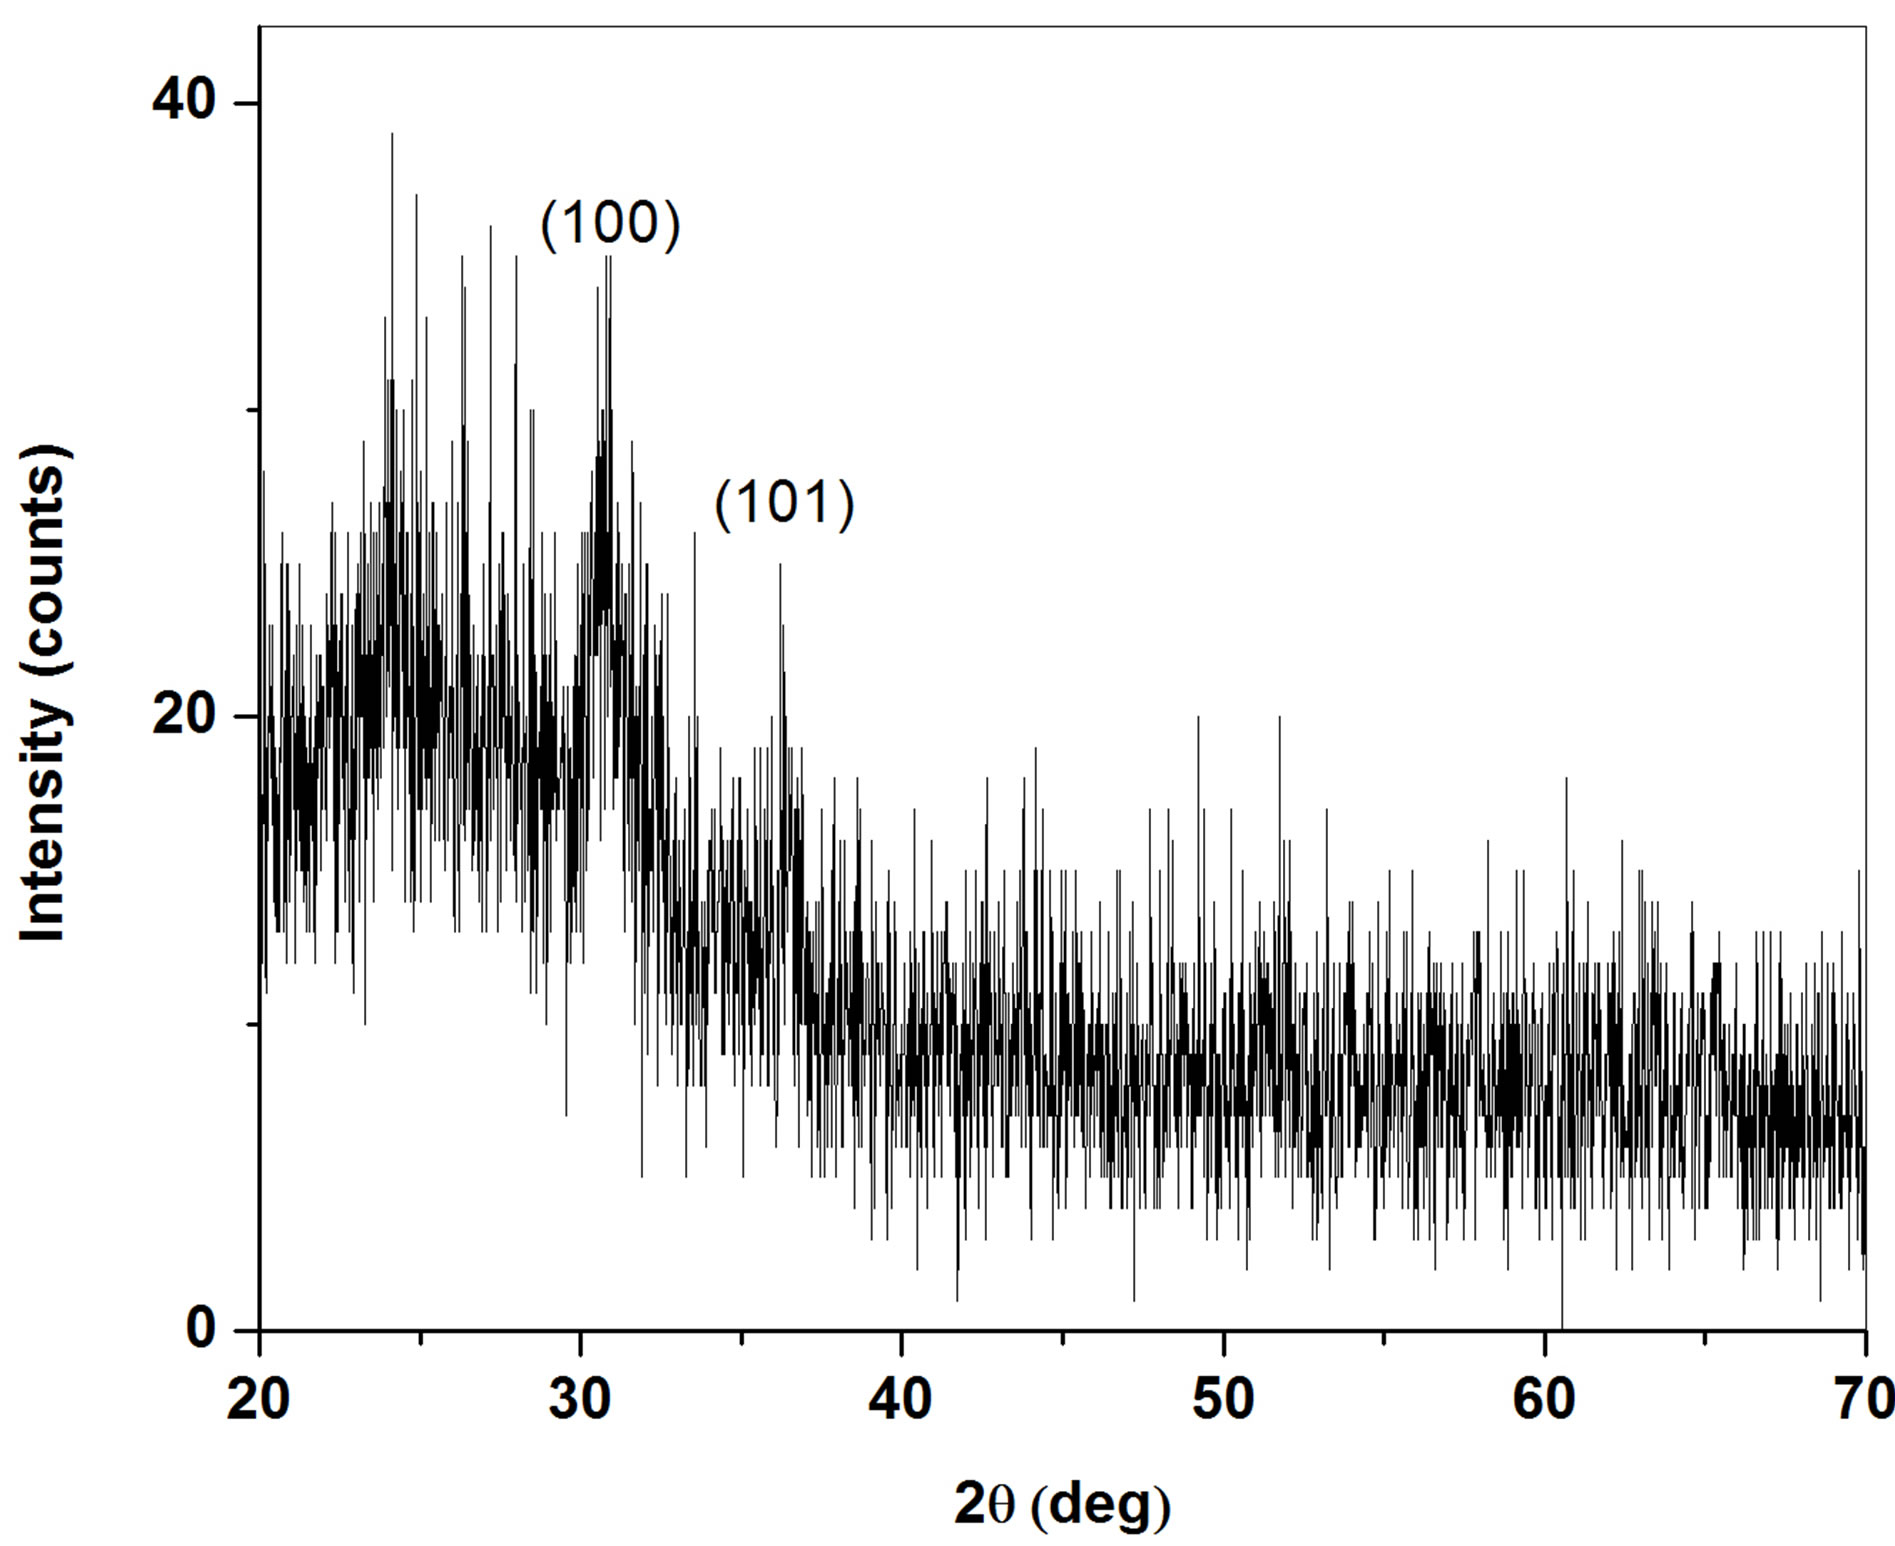
Figure 5. XRD pattern of the annealed samples at temperature of 400˚C.
Table 1 indicates ZnO lattice parameters for the annealed sample at temperature of 400˚C. Using the broadening of the peaks, it is possible to determine the mean crystallite size (D) and microstrain  from Williamson-Hall plot [11]
 (5)
(5)
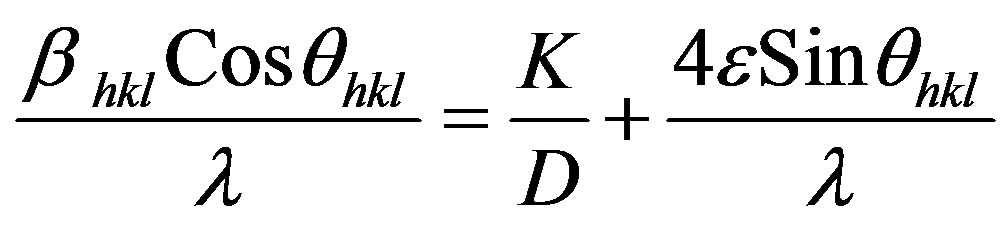
where  is the instrumental corrected peak broadening of Bragg reflection (hkl) originating from the small crystallite size and the strain induced broadening. K is the shape factor and is equal 0.94 for spherical crystallite.
  is the X-ray wavelength. Here, the microstrain
  is assumed to be uniform in all crystallographic direction. The calculated mean crystallite size and microstrain are given in Table 1.
3.3. Estimating the Temperature of Resistance Heaters
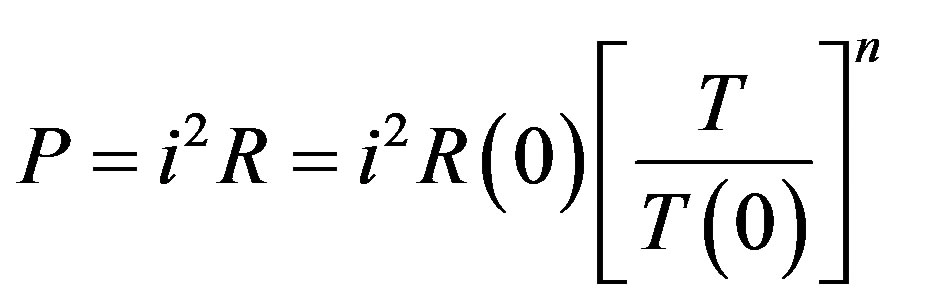
In the design of electrical heaters for evaporation systems it is important to estimate the temperature of heated furnaces. Under simplifying assumption it is possible to draw connections between the electrical power (P) supplied and the furnaces temperature reached. By noting that P is simply given by i2R where i and R are current and resistance, respectively for a metallic furnace [12]
 (6)
(6)
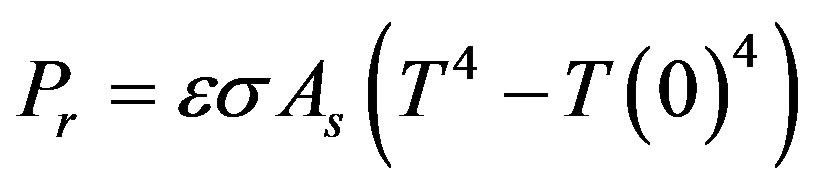
This equation assumes that the electrical resistance, R(T), of metals can be approximated over abroad high temperature (T) rang by the relation  , where R(0) is the value at reference temperature T(0) (i.e. room temperature, RT), and n is a constant generally close to1.In tungsten, n is selected to be 1.20 [12]. In a complementary approach may be estimated assuming that all of the input electrical power dissipated is thermally radiated from the furnace surface. In this case the Stefan-Boltzmann law yields the defining equation for the radiated power
 , [12]
 (7)
(7)
where  is the emissivity,
  sslefans constant
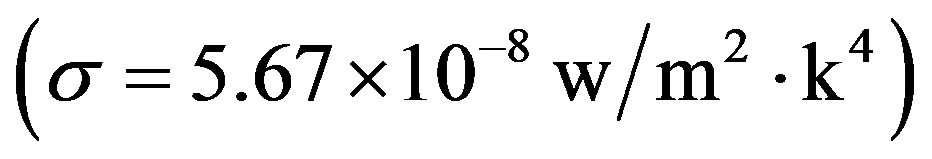 , and
, and  is the furnace surface area.
  for tungsten plate is 0.04 [13]. The tungsten furnace is considered to be rectangle for eliminating the effect of complex geometries.
3.4. Evaporation Rate and Vapor Pressure of the Materials
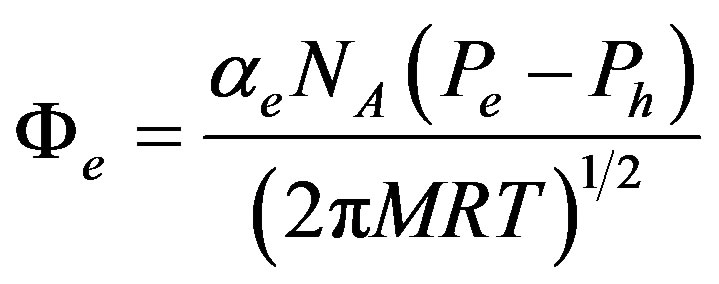
According to Hertz, Knudsen and Langmuir experiments, the evaporation rate condensed from (both liquid and solid) surface [12]
 (8)
(8)
where  is the evaporation flux in number of atoms (or molecules) per unit area, per unit area,
  and
and  are equilibrium vapor pressure at temperature and hydrostatic pressure acting on the evaporant, respectively.
  is the coefficient of evaporation, which has a value between 0 and 1. When
  and
and  is zero, the maximum evaporation rate is realized. An expression for the maximum value of
  is [12]
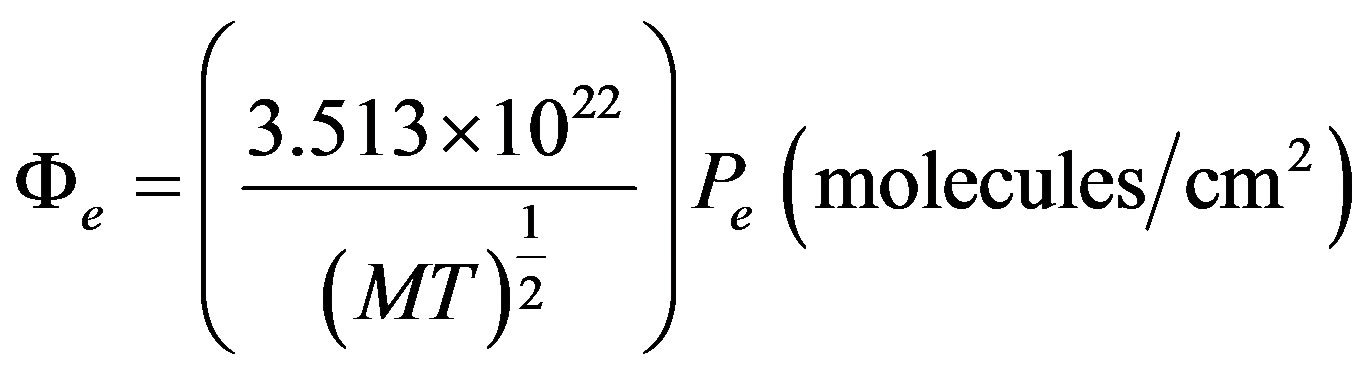 (9)
(9)
where Pe is expressed in torr, a useful variant of this formula is
 (10)
(10)
where  is the mass evaporation rate.
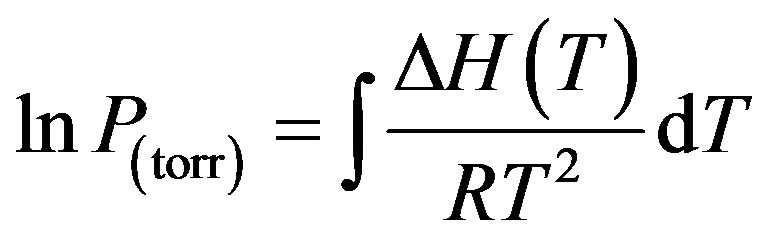
The connection between temperature and vapor pressure is the Clausius-Clapyeron equation, which for condensed phases (both liquid and solid)-vapor equilibria can be written as [12]
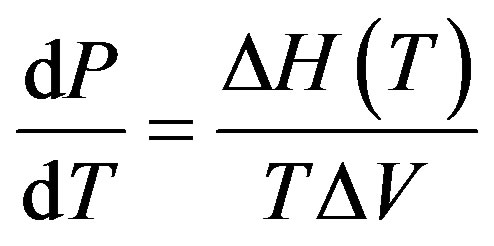 (11)
(11)
The change in enthalpy, ∆H(T), and volume, ∆V, refer to differences between the vapor (v) and the particular condensed phase (c) from which it originates, while T is the transformation temperature in question. Since ∆V = Vv - Vc, and the volume of vapor normally considerably exceeds that of the condensed solid or liquid phase, ∆V ≈ Vv. If the gas is assumed to be perfect, Vv = RT/P, and Equation (11) may be rewritten as [12]
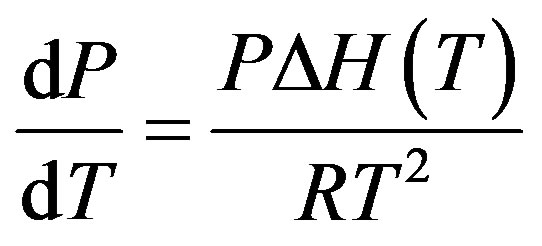 (12)
(12)
Hence
 (13)
(13)
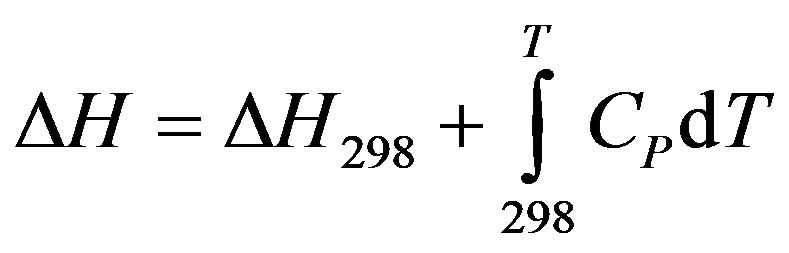
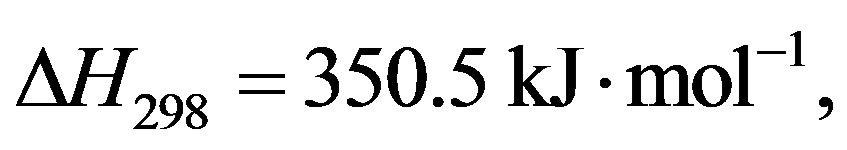
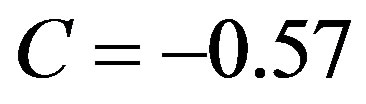
The enthalpy ∆H and heat capacity Cp of each species were calculated using the following relation [14]
 (14)
(14)
 (15)
(15)
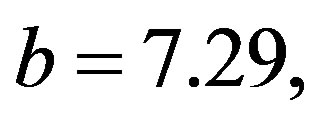
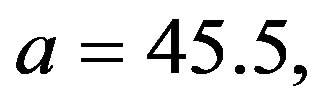
where for ZnO
 and
and 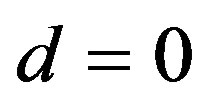
4. Conclusions
ZnO films have been grown on glass slide substrates at room temperature by thermal evaporation technique. Optical and structural properties of as-deposited films were compared with those of the annealed samples.
The annealed samples have polycrystalline and exhibit wurtzite structure. The mean crystallite size and microstrain were discussed from XRD peak broadening. The optical constants such as the refractive index n, extinction coefficient k as well as films’ thickness were calculated in the spectral range of 350 - 800 nm from transmittance data using point-wise unconstrained minimization approach. Dispersion of refractive index shows similar trend as Cauchy relation. Absorption coefficient depicts a maximal value around 3.33 eV for annealed samples.
The temperature of tungsten furnace was calculated using balance between electrical power and emissive power under deposition condition. The Clausius-Clapyeron equation and thermochemical data were used to connect temperature and vapor pressure of ZnO.
Acknowledgements
This work has been granted by Vali-e-Asr University of Rafsanjan, Rafsanjan, Iran.