Realization of Potassium Chloride Sensor Using Photonic Crystal Fiber ()
1. Introduction
In the last decade, a great deal of work has been focused on the field of photonic crystal fiber (PCF) technology due to their optical properties. An interesting characteristics display by such structure is the selectivity of the electromagnetic field that can propagate along them, in other words the propagation of certain frequency is prohibited [1]. The operational principle of PCF is based on the photonic band gap. Photonic band gap of the fiber depends on the periodic variation of permittivity as a function of position. This periodic variation can occur in one, two or three dimensions and can be manipulated by controlling the magnitude, shape and period of permittivity. Apart from these parameters, photonic band gap of the same fiber also depends on the defect available in the PCF. The photonic band gap of PCF having defect, controls the electric field distribution in the same fiber. As far as the application of PCF is concerned, it is used almost in all fields including ultra low pass transmission sensor, power deliveries and nonlinear optics [2-4]. Recently, an optical sensor using 2D photonic crystal structure is theoretically designed for measurement of sugar, salt, alcohol and Cygel concentration [5,6]. In this paper, we have theoretically designed a photonic crystal fiber which is used to measure the concentration of potassium chloride by knowing transmitted intensities. In this case, the principle of concentration measurement is based on linear variation of electric field with concentration. The simulation for electric field distribution is obtained using plane wave expansion method (PWE).
Potassium chloride is a natural compound in the mineral sylite food and seawater. It is necessary for various body functions especially for the proper functioning of heart [7]. Potassium chloride is used in the prevention or treatment of low blood levels of potassium [8]. It is also used in the treatment of hypokalemia [9]. Potassium chloride is used in everyday life as a water softener instead of sodium chloride [10]. The other major use of potassium chloride is the manufacture of fertilizer [11].
The schematic diagram of the PCF is shown in Figure 1.
Figure 1 represents a square lattice PCF having defect at centre and silicon is taken as background material. The air holes in this fiber contain solution having different percentage of potassium chloride. The lattice constants and diameter of air holes are 1 μm and 0.4 μm respectively.
2. Mathematical Approach
The electric field distribution in photonic crystal fiber is computed using, Helmoltz equation, which is given by [11].
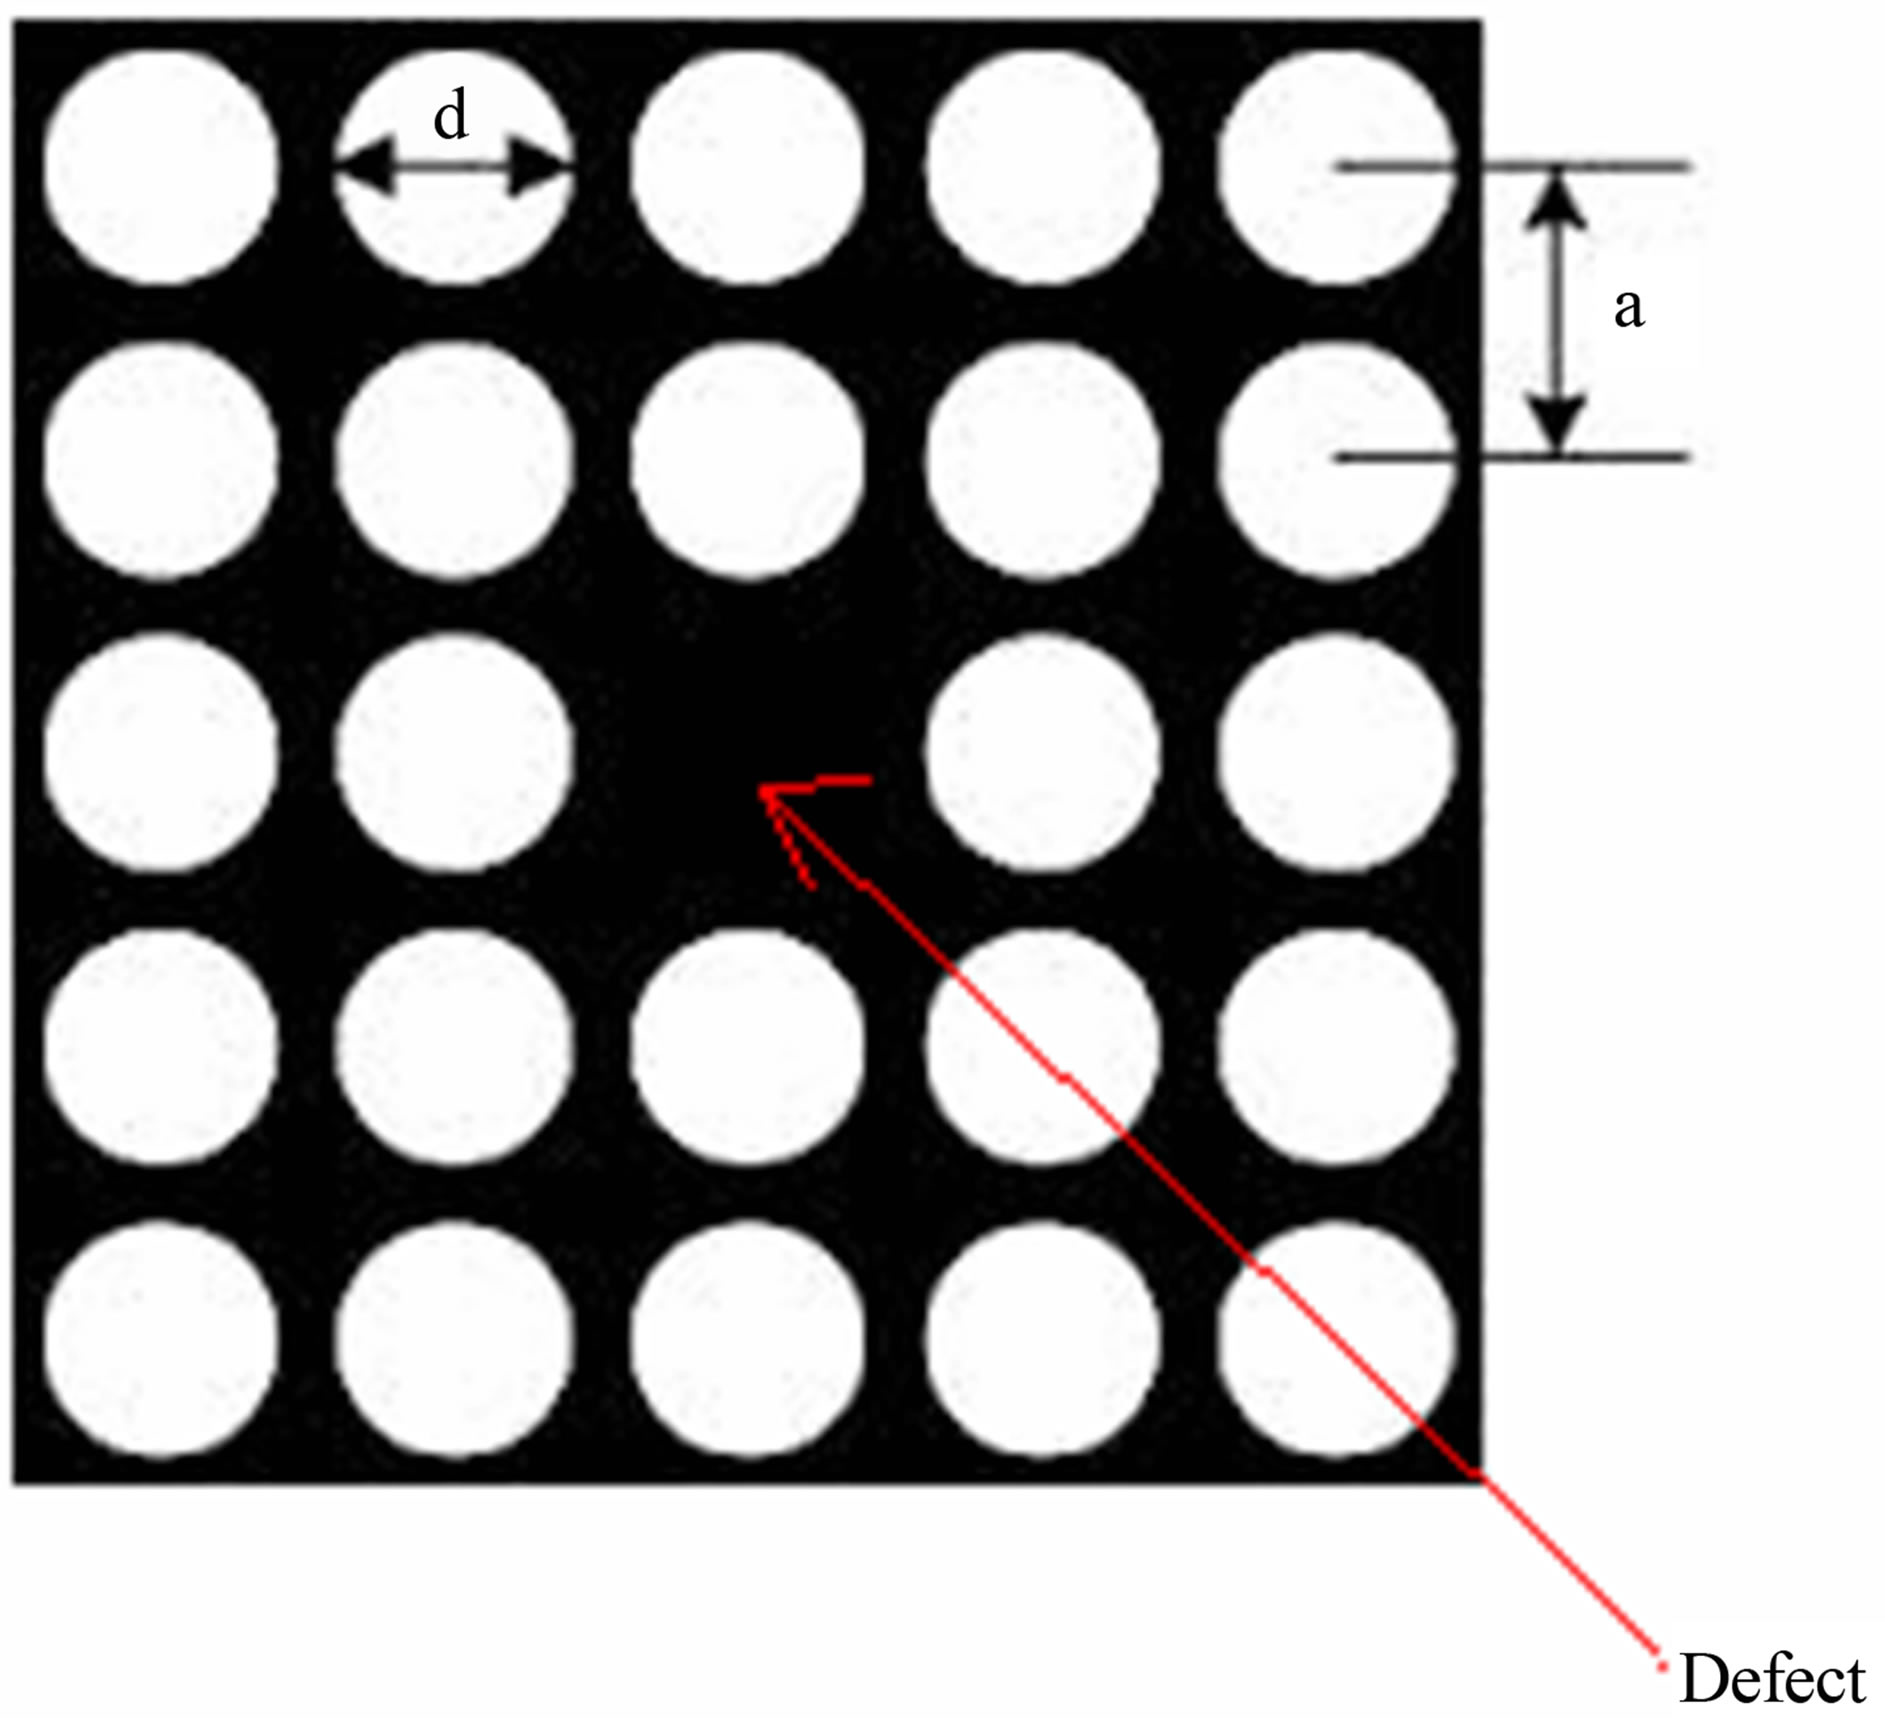
Figure 1. Schematic diagram of photonic crystal fiber.
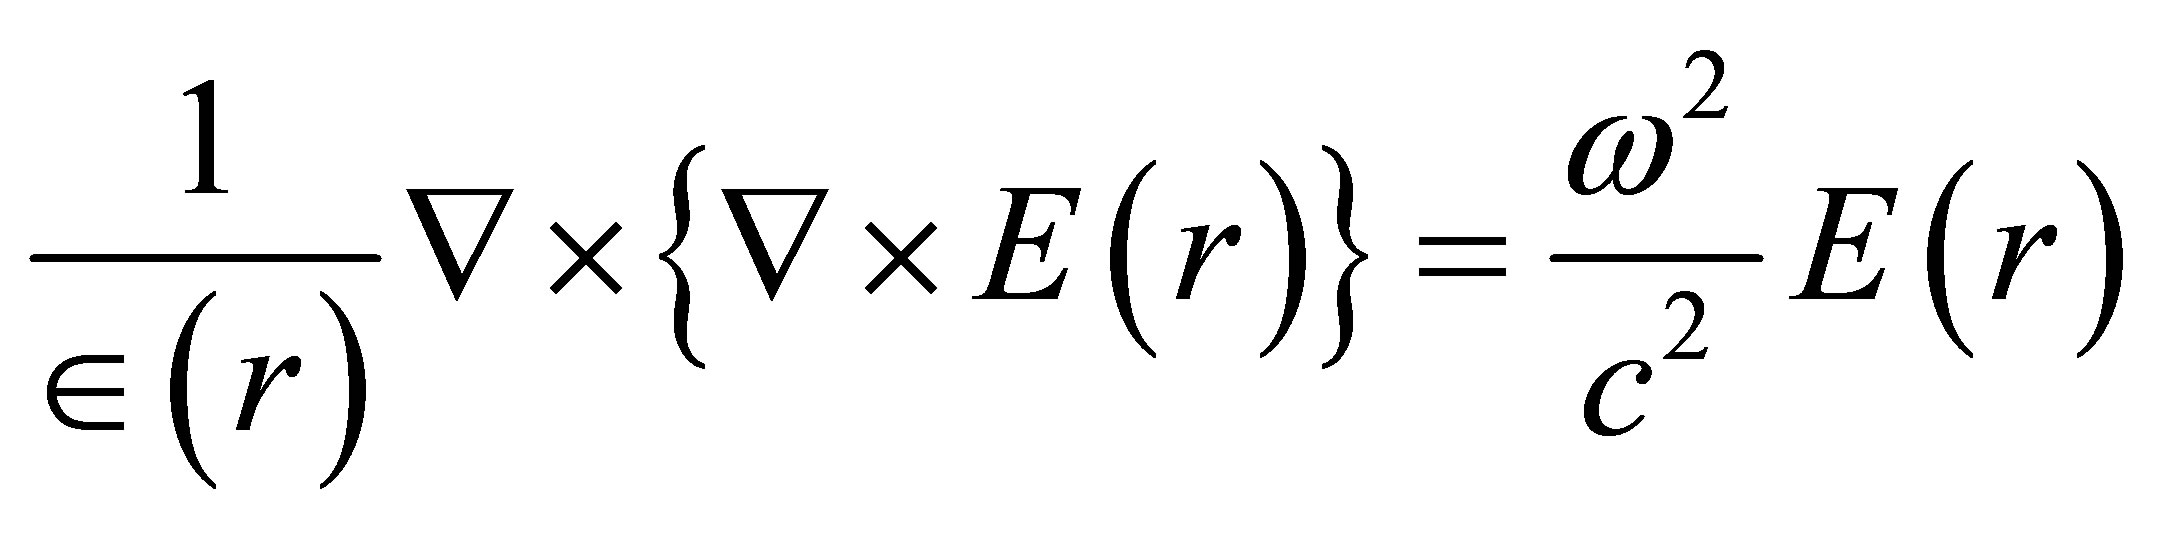 (1)
(1)
The solution of Equation (1) is expressed as
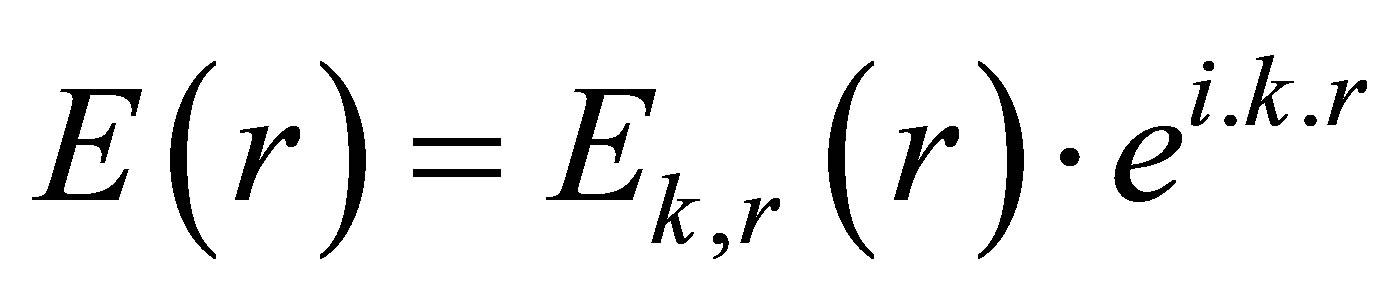 (2)
(2)
where Ek,r is the periodic function with periodicity of lattice. The wave functions are represented interms of Bloch wave and expanded in to fourier series over lattice vector, which is expressed as
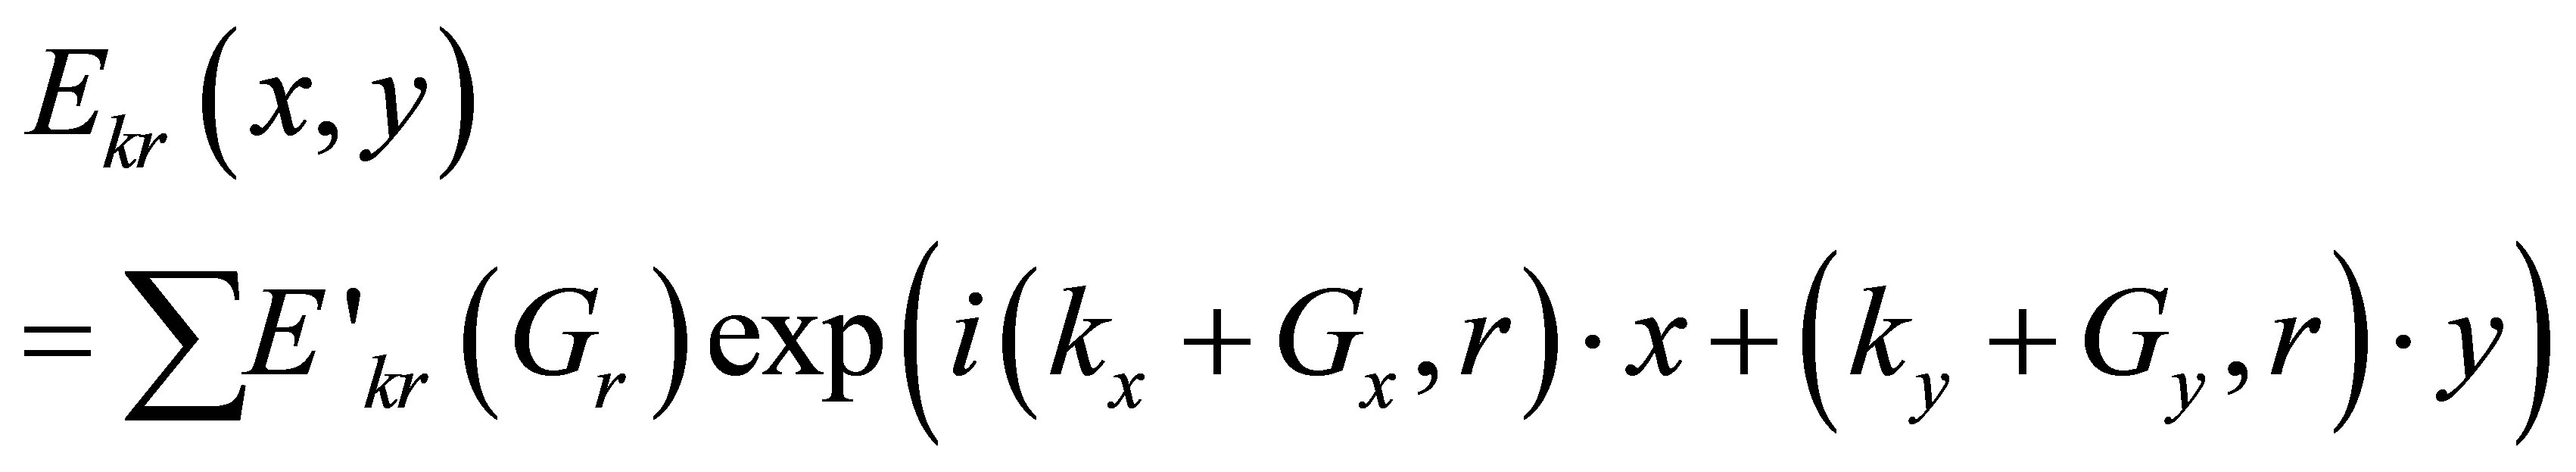 (3)
(3)
Here E’kr(Gr) are eigen vectors to be found during the eigen problem solution. Gx and Gy are called Fourier coefficients for harmonics. Using above equations, we solved eigen value problem and compute the field distribution in the photonic crystal fiber. The transmitted intensity is expressed in terms of electric field as [12].
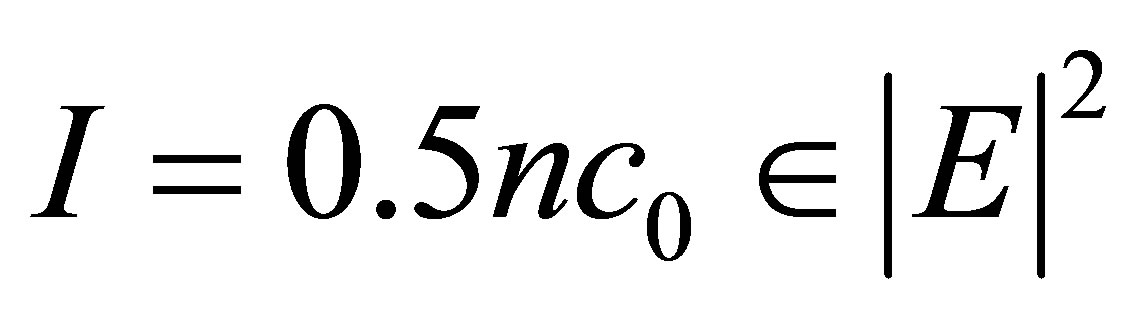 (4)
(4)
where “n” is refractive index modulation, 0 is the permittivity of free space, “c” is the velocity of light, E is the peak electric field at coordinate [2,5].
3. Result and Analysis
Table 1 shows the variation of dielectric constant with concentration of potassium chloride as [13].
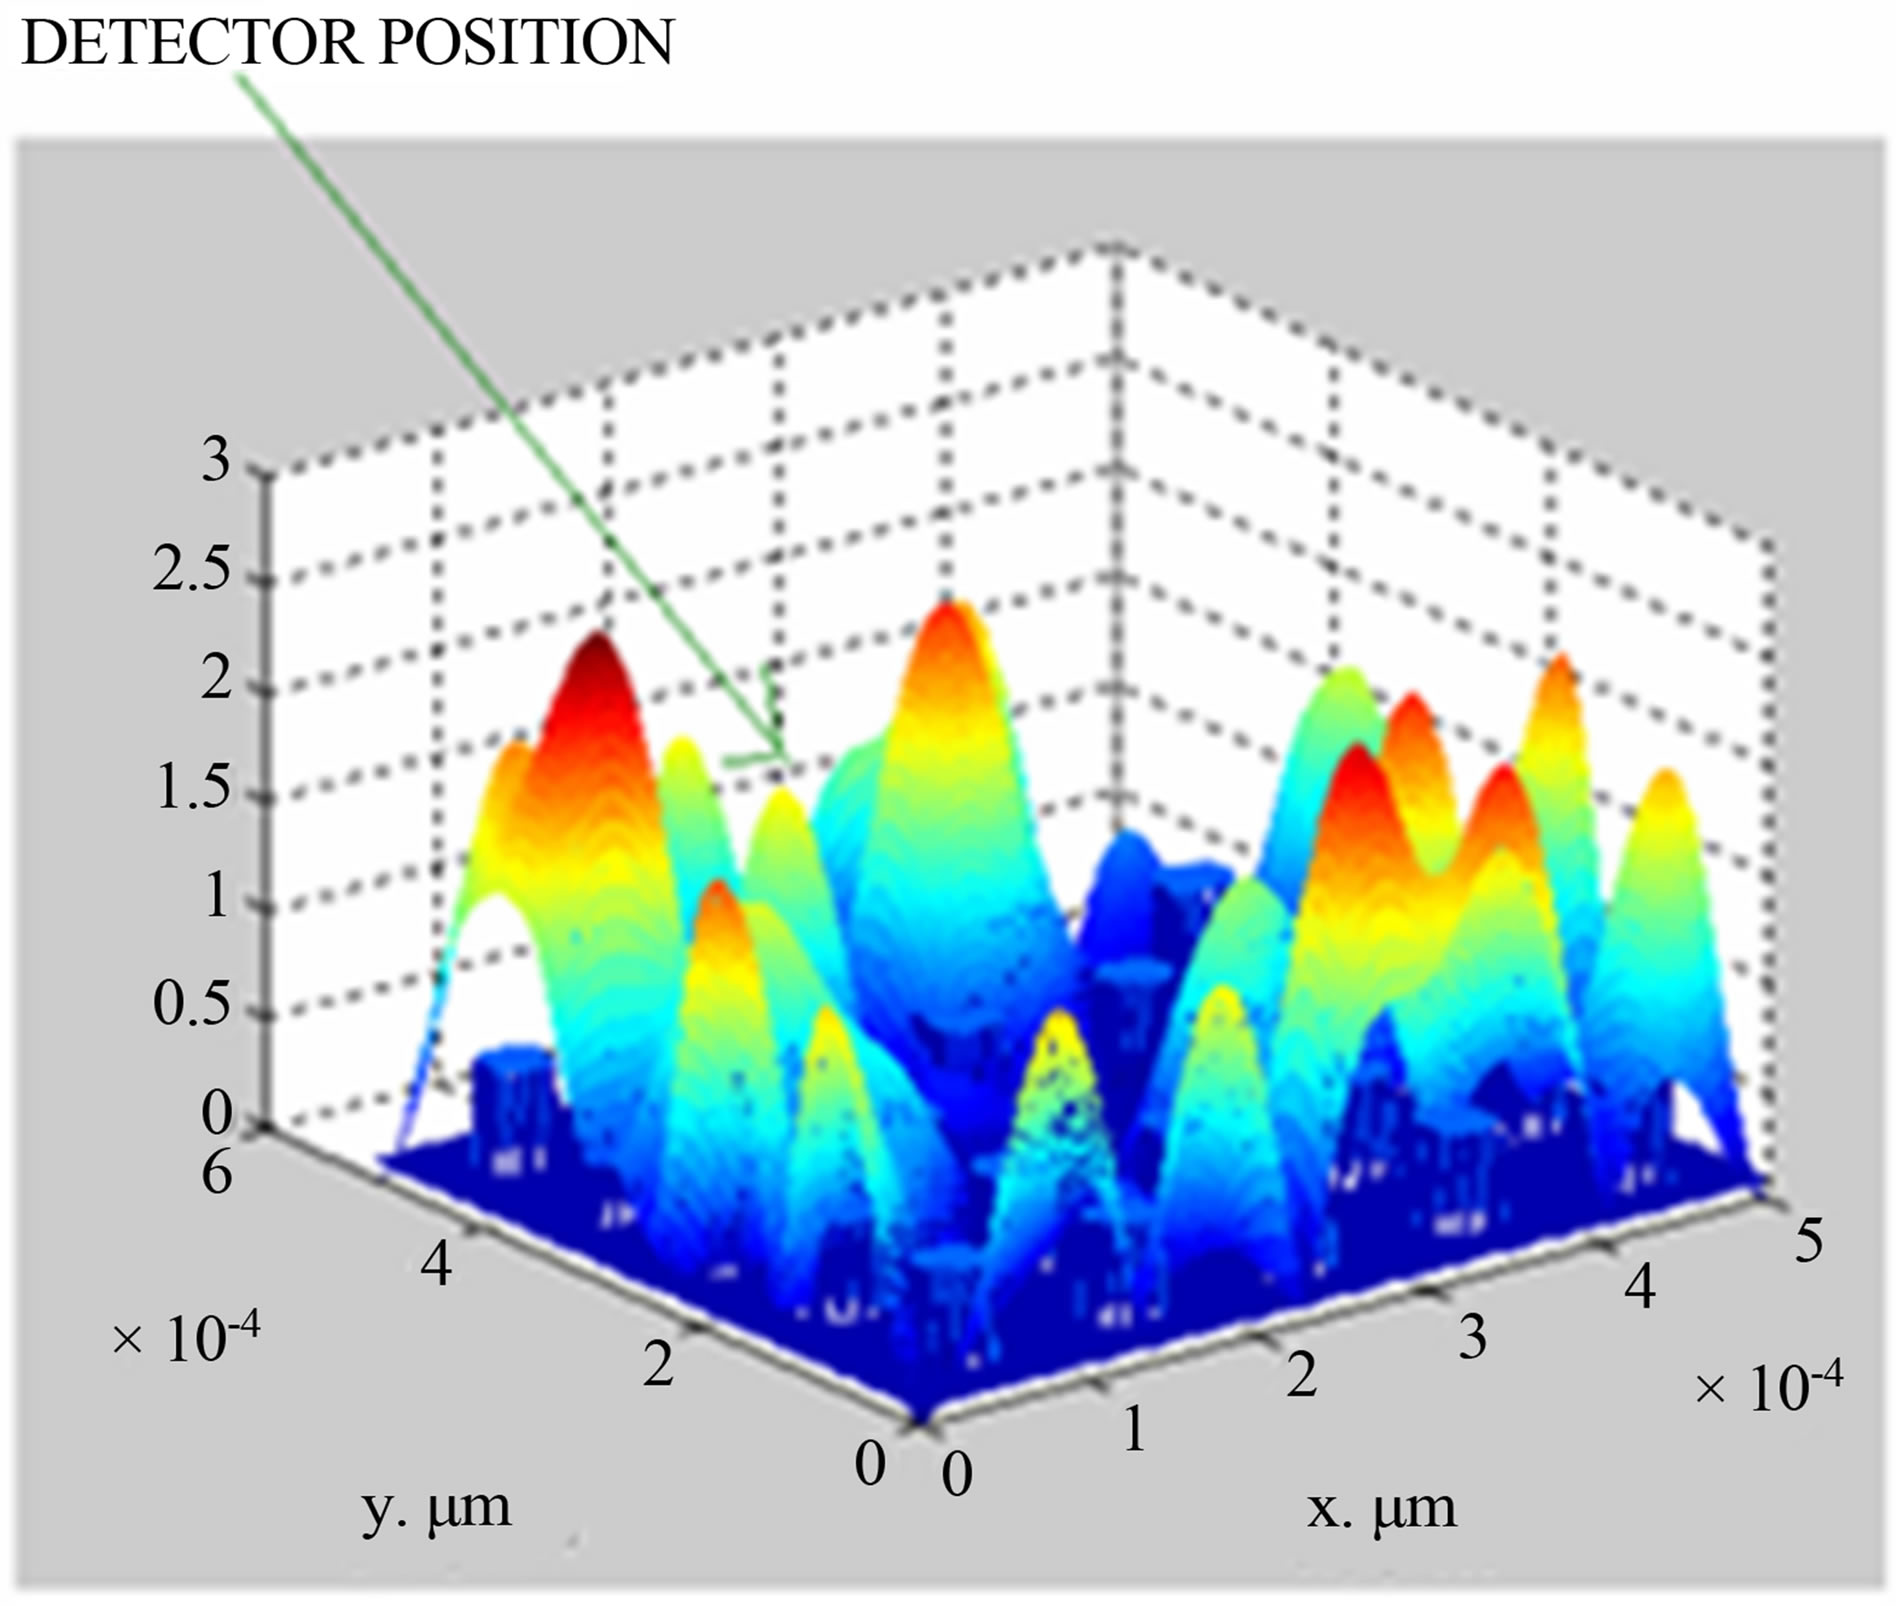
Taking data from Table 1 and using PWE method, simulation is made to compute the electric field distribution in photonic crystal fiber having different concentrations of potassium chloride in solutions. The simulation results for KCl concentration of 2.5% and 20%, are shown in Figures 2(a) and (b) respectively, simulations for other concentrations (5%, 7%, 10%) are done but not shown here.
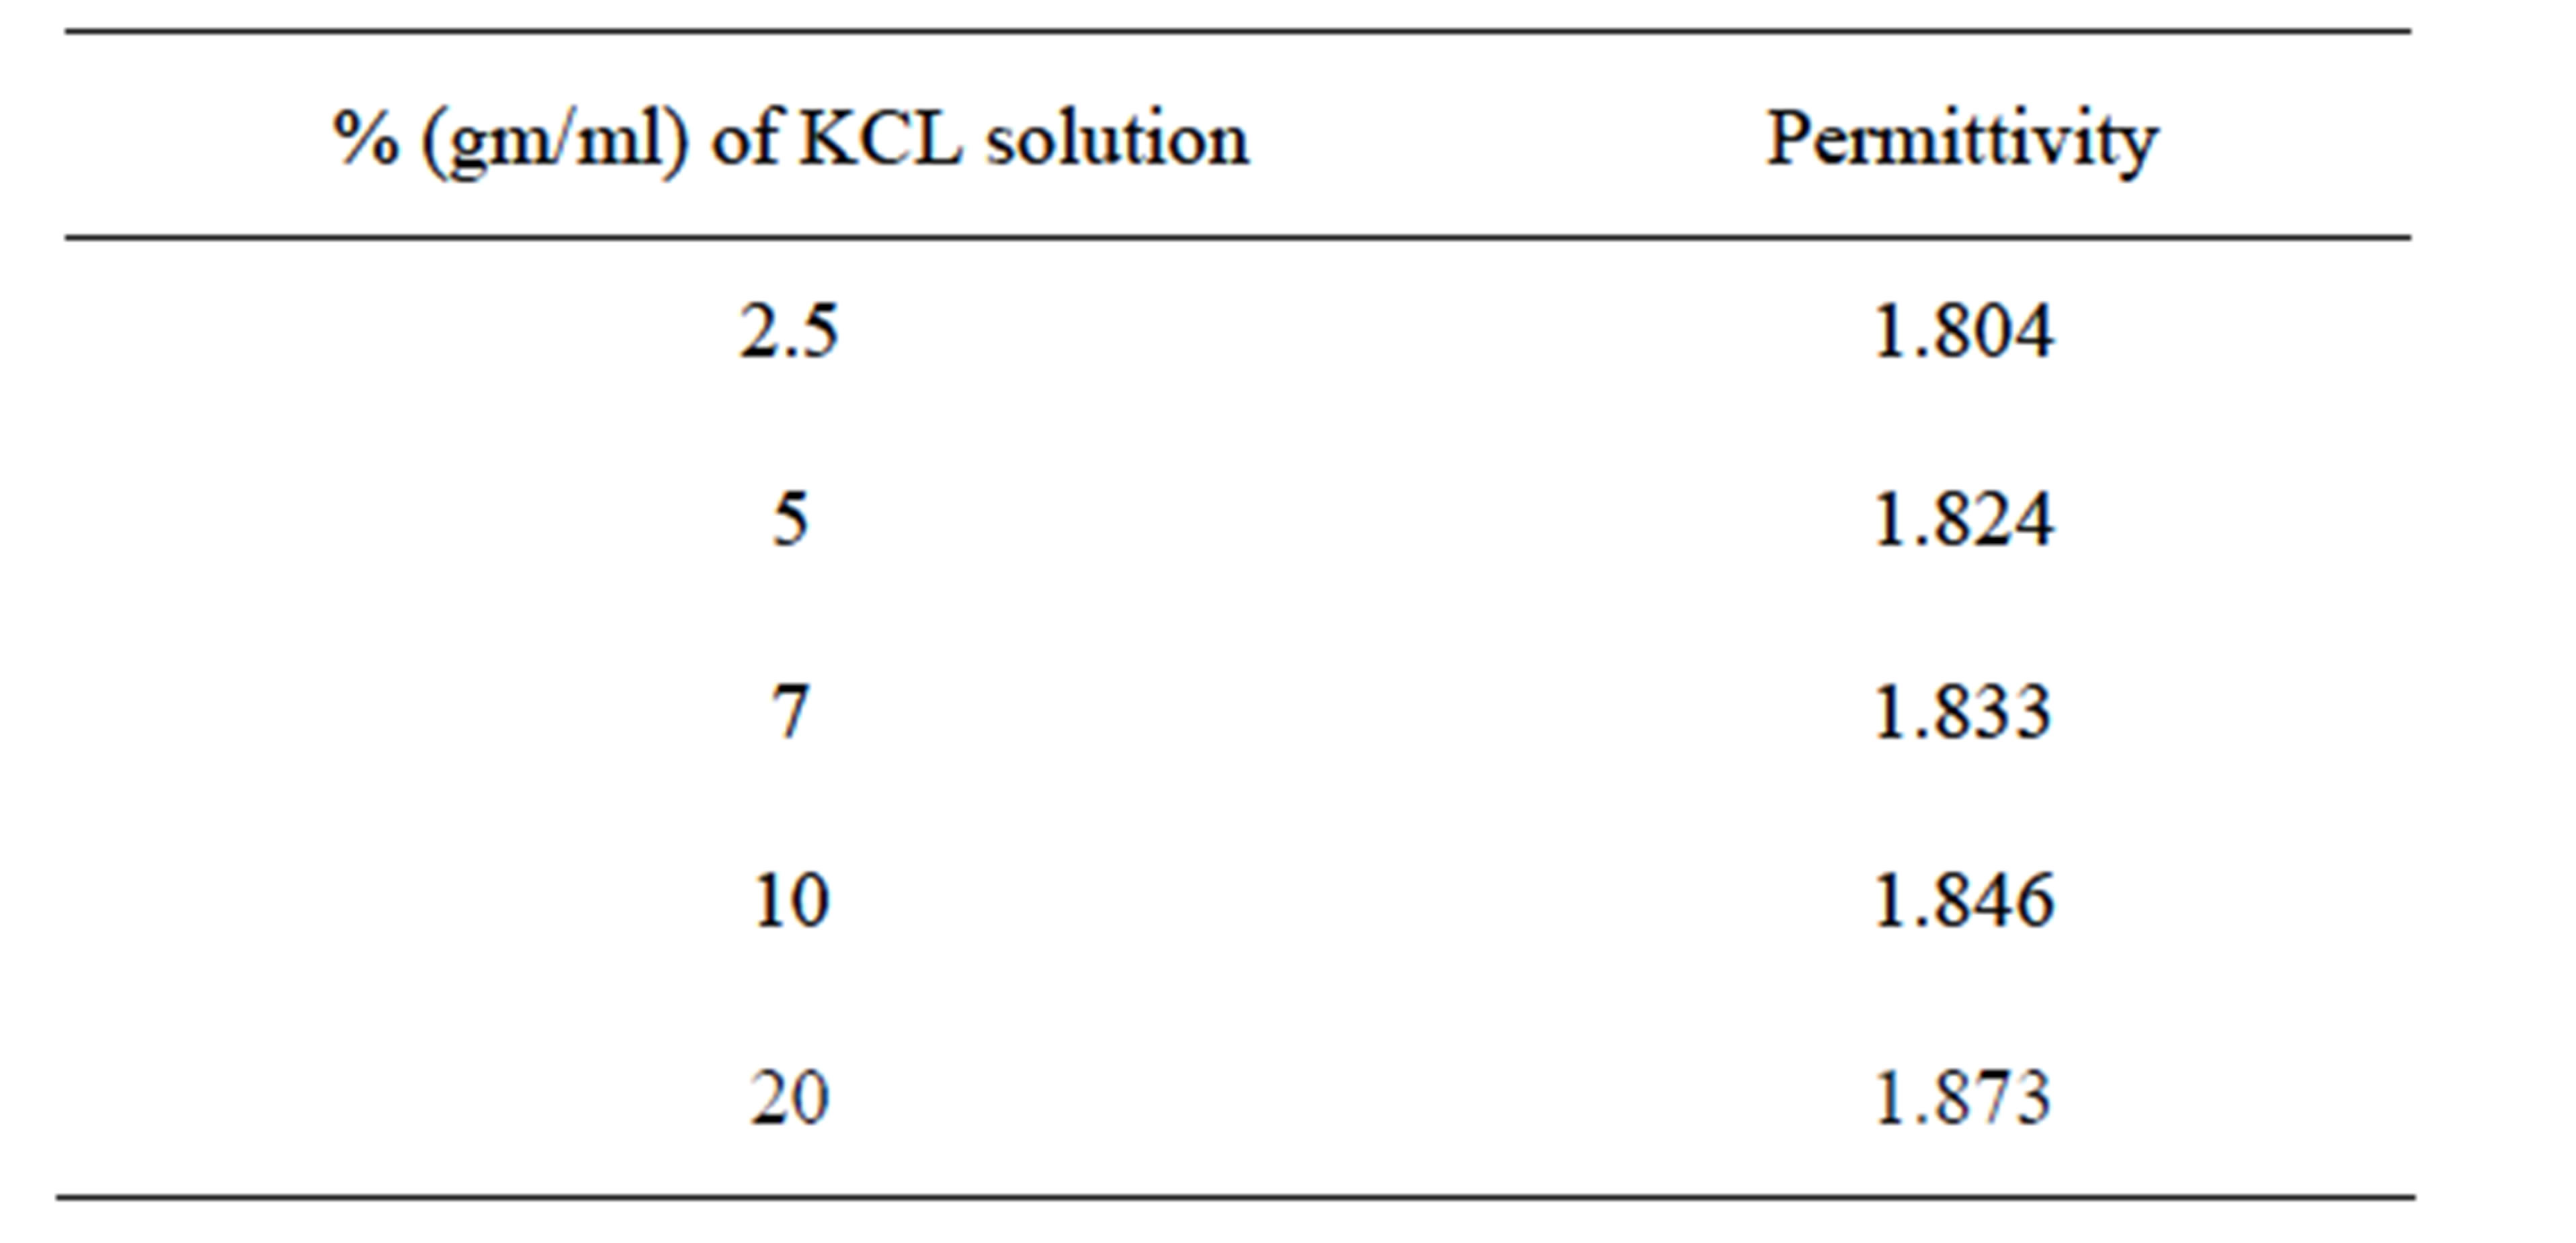
Table 1. Variation of dielectric constant with concentration of potassium chloride.
 (a)
(a)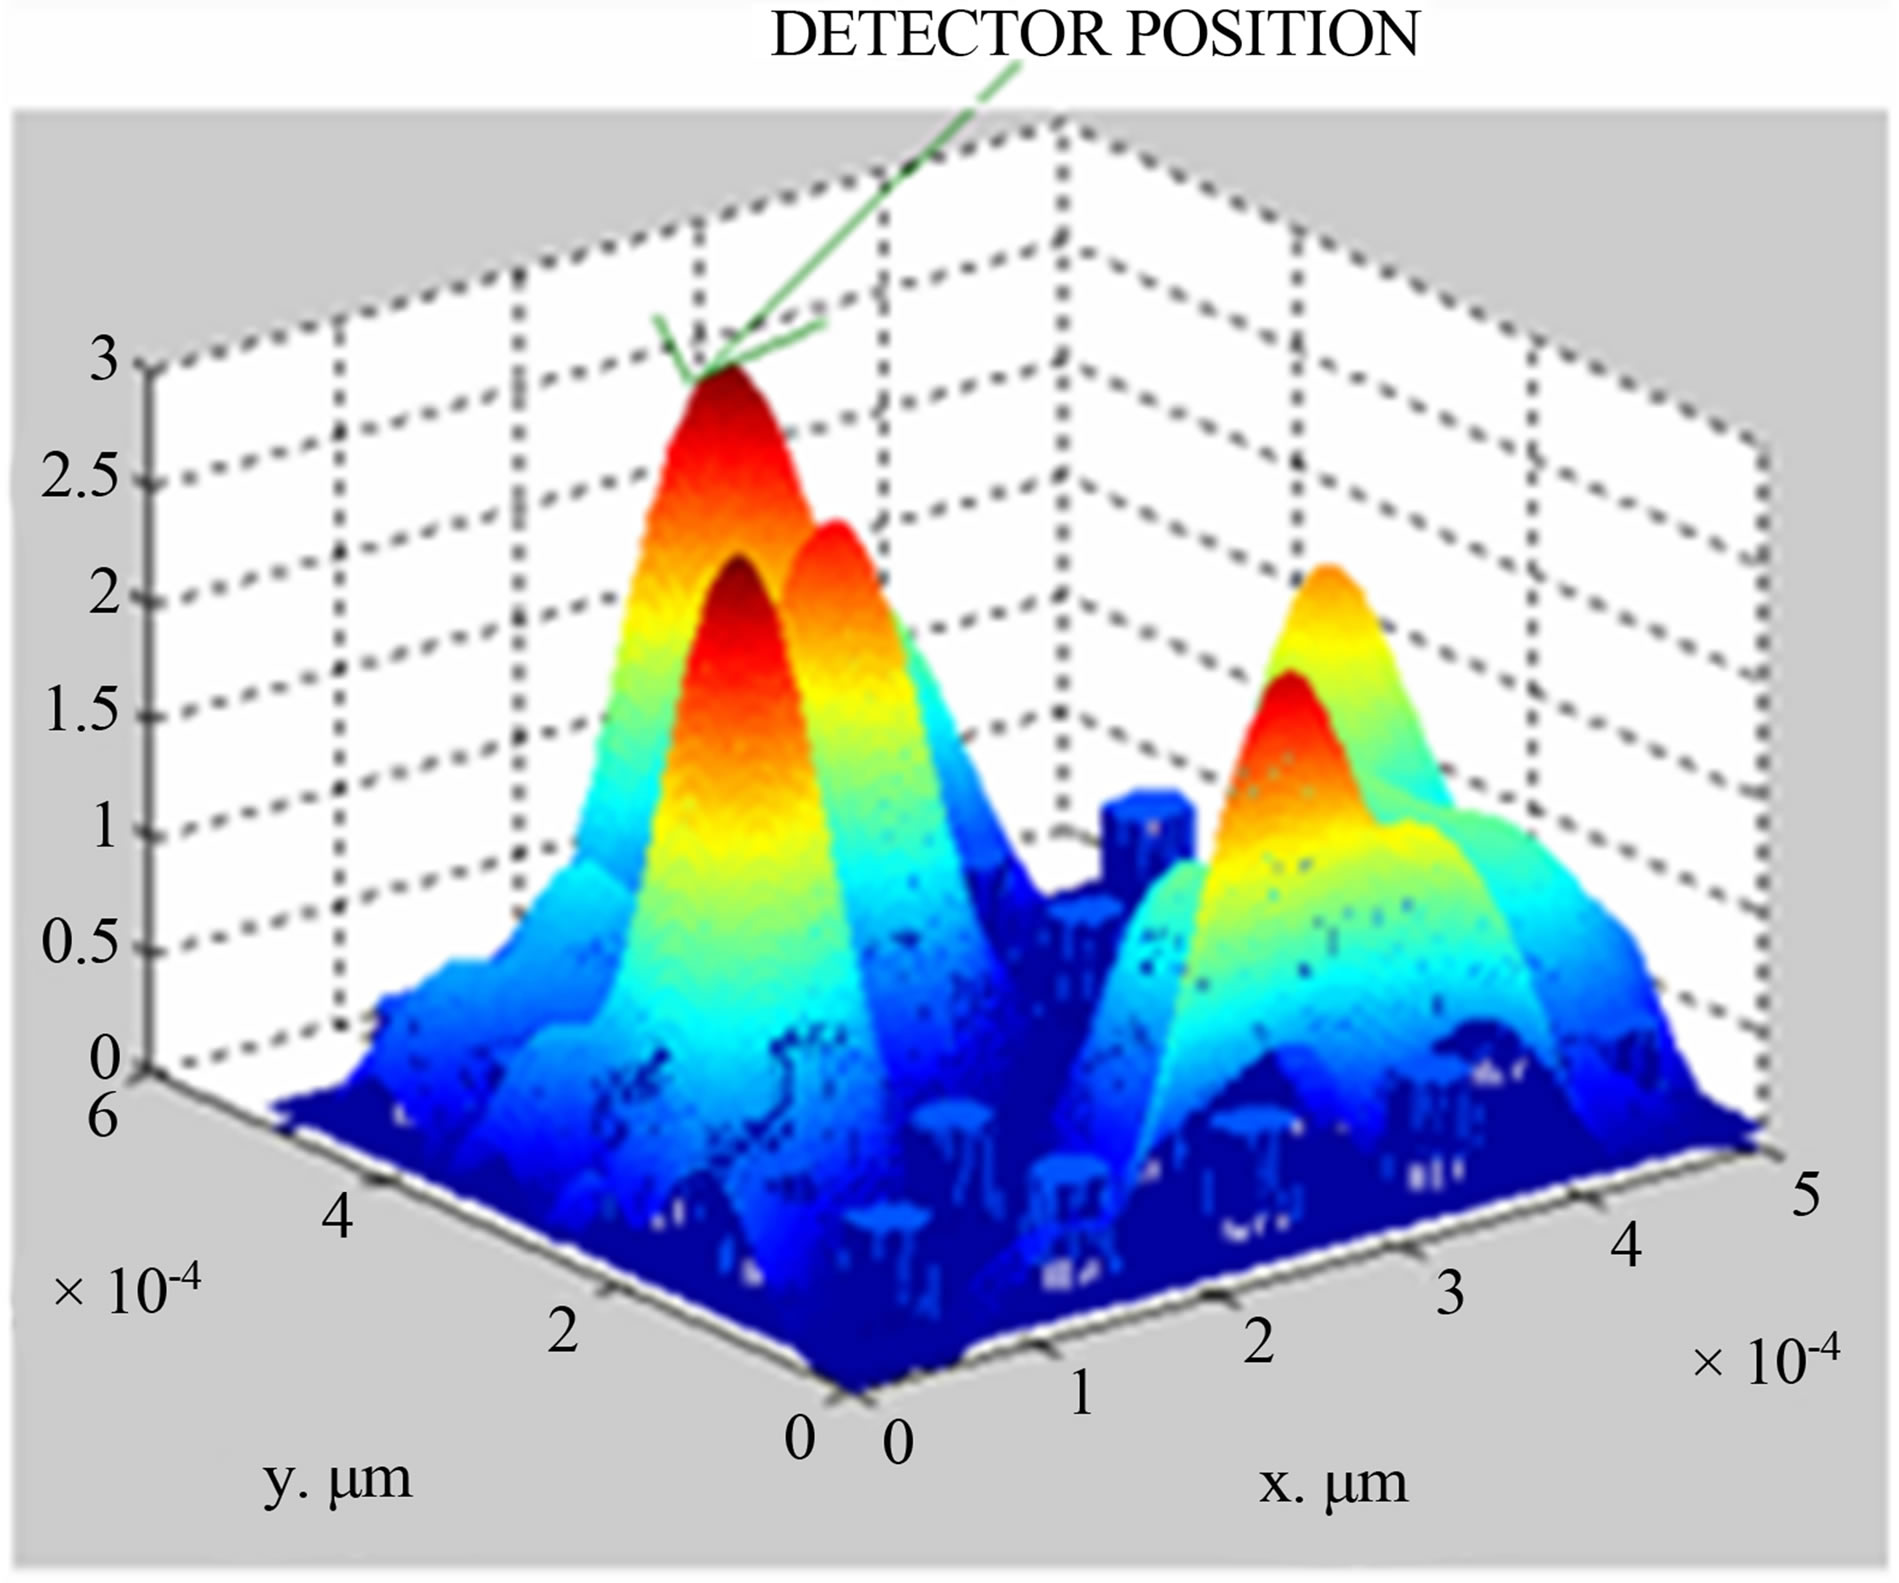 (b)
(b)
Figure 2. (a) Simulated field distribution diagram for 2.5% KCl concentration; (b) simulated field distribution diagram for 20% KCl concentration.
From Figures 2(a) and (b), it is seen that electric field is 0.9 V/μm and 2.3 V/μm with respect to concentration of 2.5% and 20% at the position of (2,5) in x-y co-ordinate system.
Apart from this, it is also seen that electric field increases with the increase of potassium chloride concentration, which varies from 2.5% to 20%. The same variation of an electric field with respect to KCl concentration is shown in Figure 3.
Figure 4 represents the experimental set up to determine the concentration of KCl.
From Figure 4, it is seen that, light from a sodium vapor lamp (λ = 590 nm) is incident on the photonic crystal Fiber. Transmitted light from the photonic crystal fiber is then received by photo detector, which is connected to power meter (optical). A graph is then plotted between transmitted intensity (power measured in the power meter per unit area) and concentration of potassium chloride, which is shown in Figure 5.
From Figure 4, it is seen that, transmitted intensity increases with the increase of potassium chloride concentration, which varies from 2.5% to 20%. It is also seen that an excellent trend line is fitted with the variation of intensity and concentration.
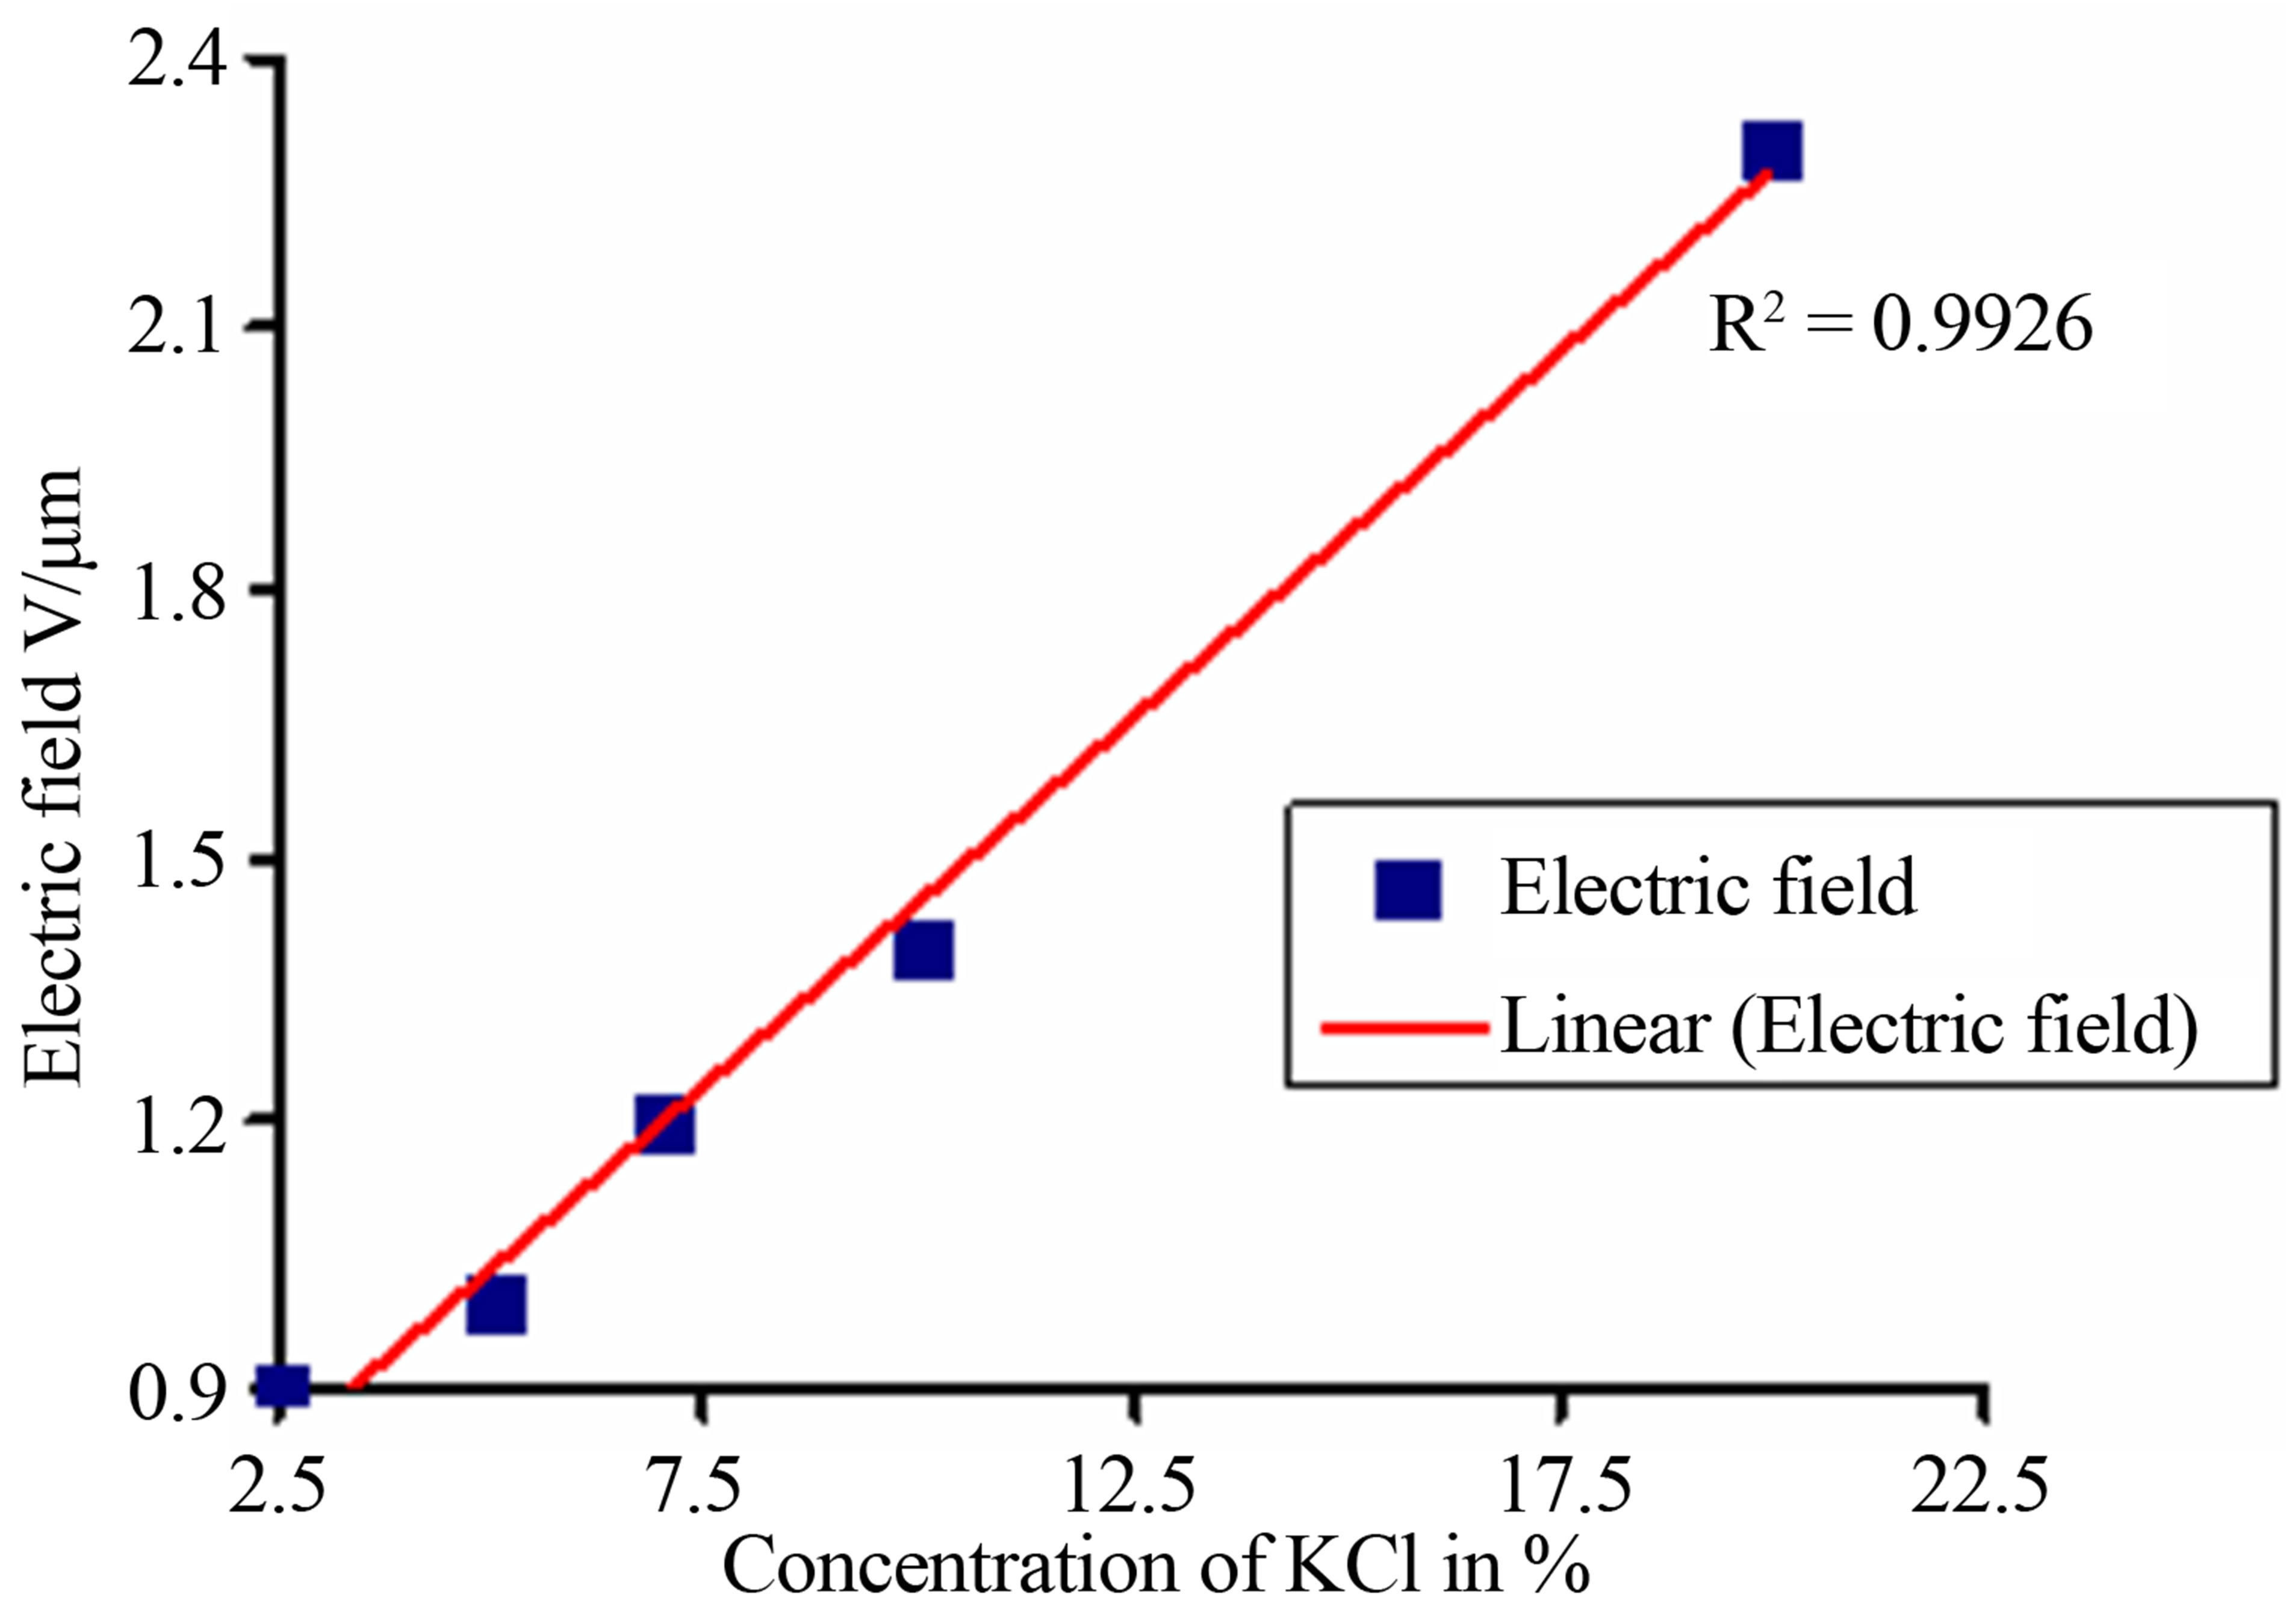
Figure 3. Variation of transmitted intensity with concentration of KCl.
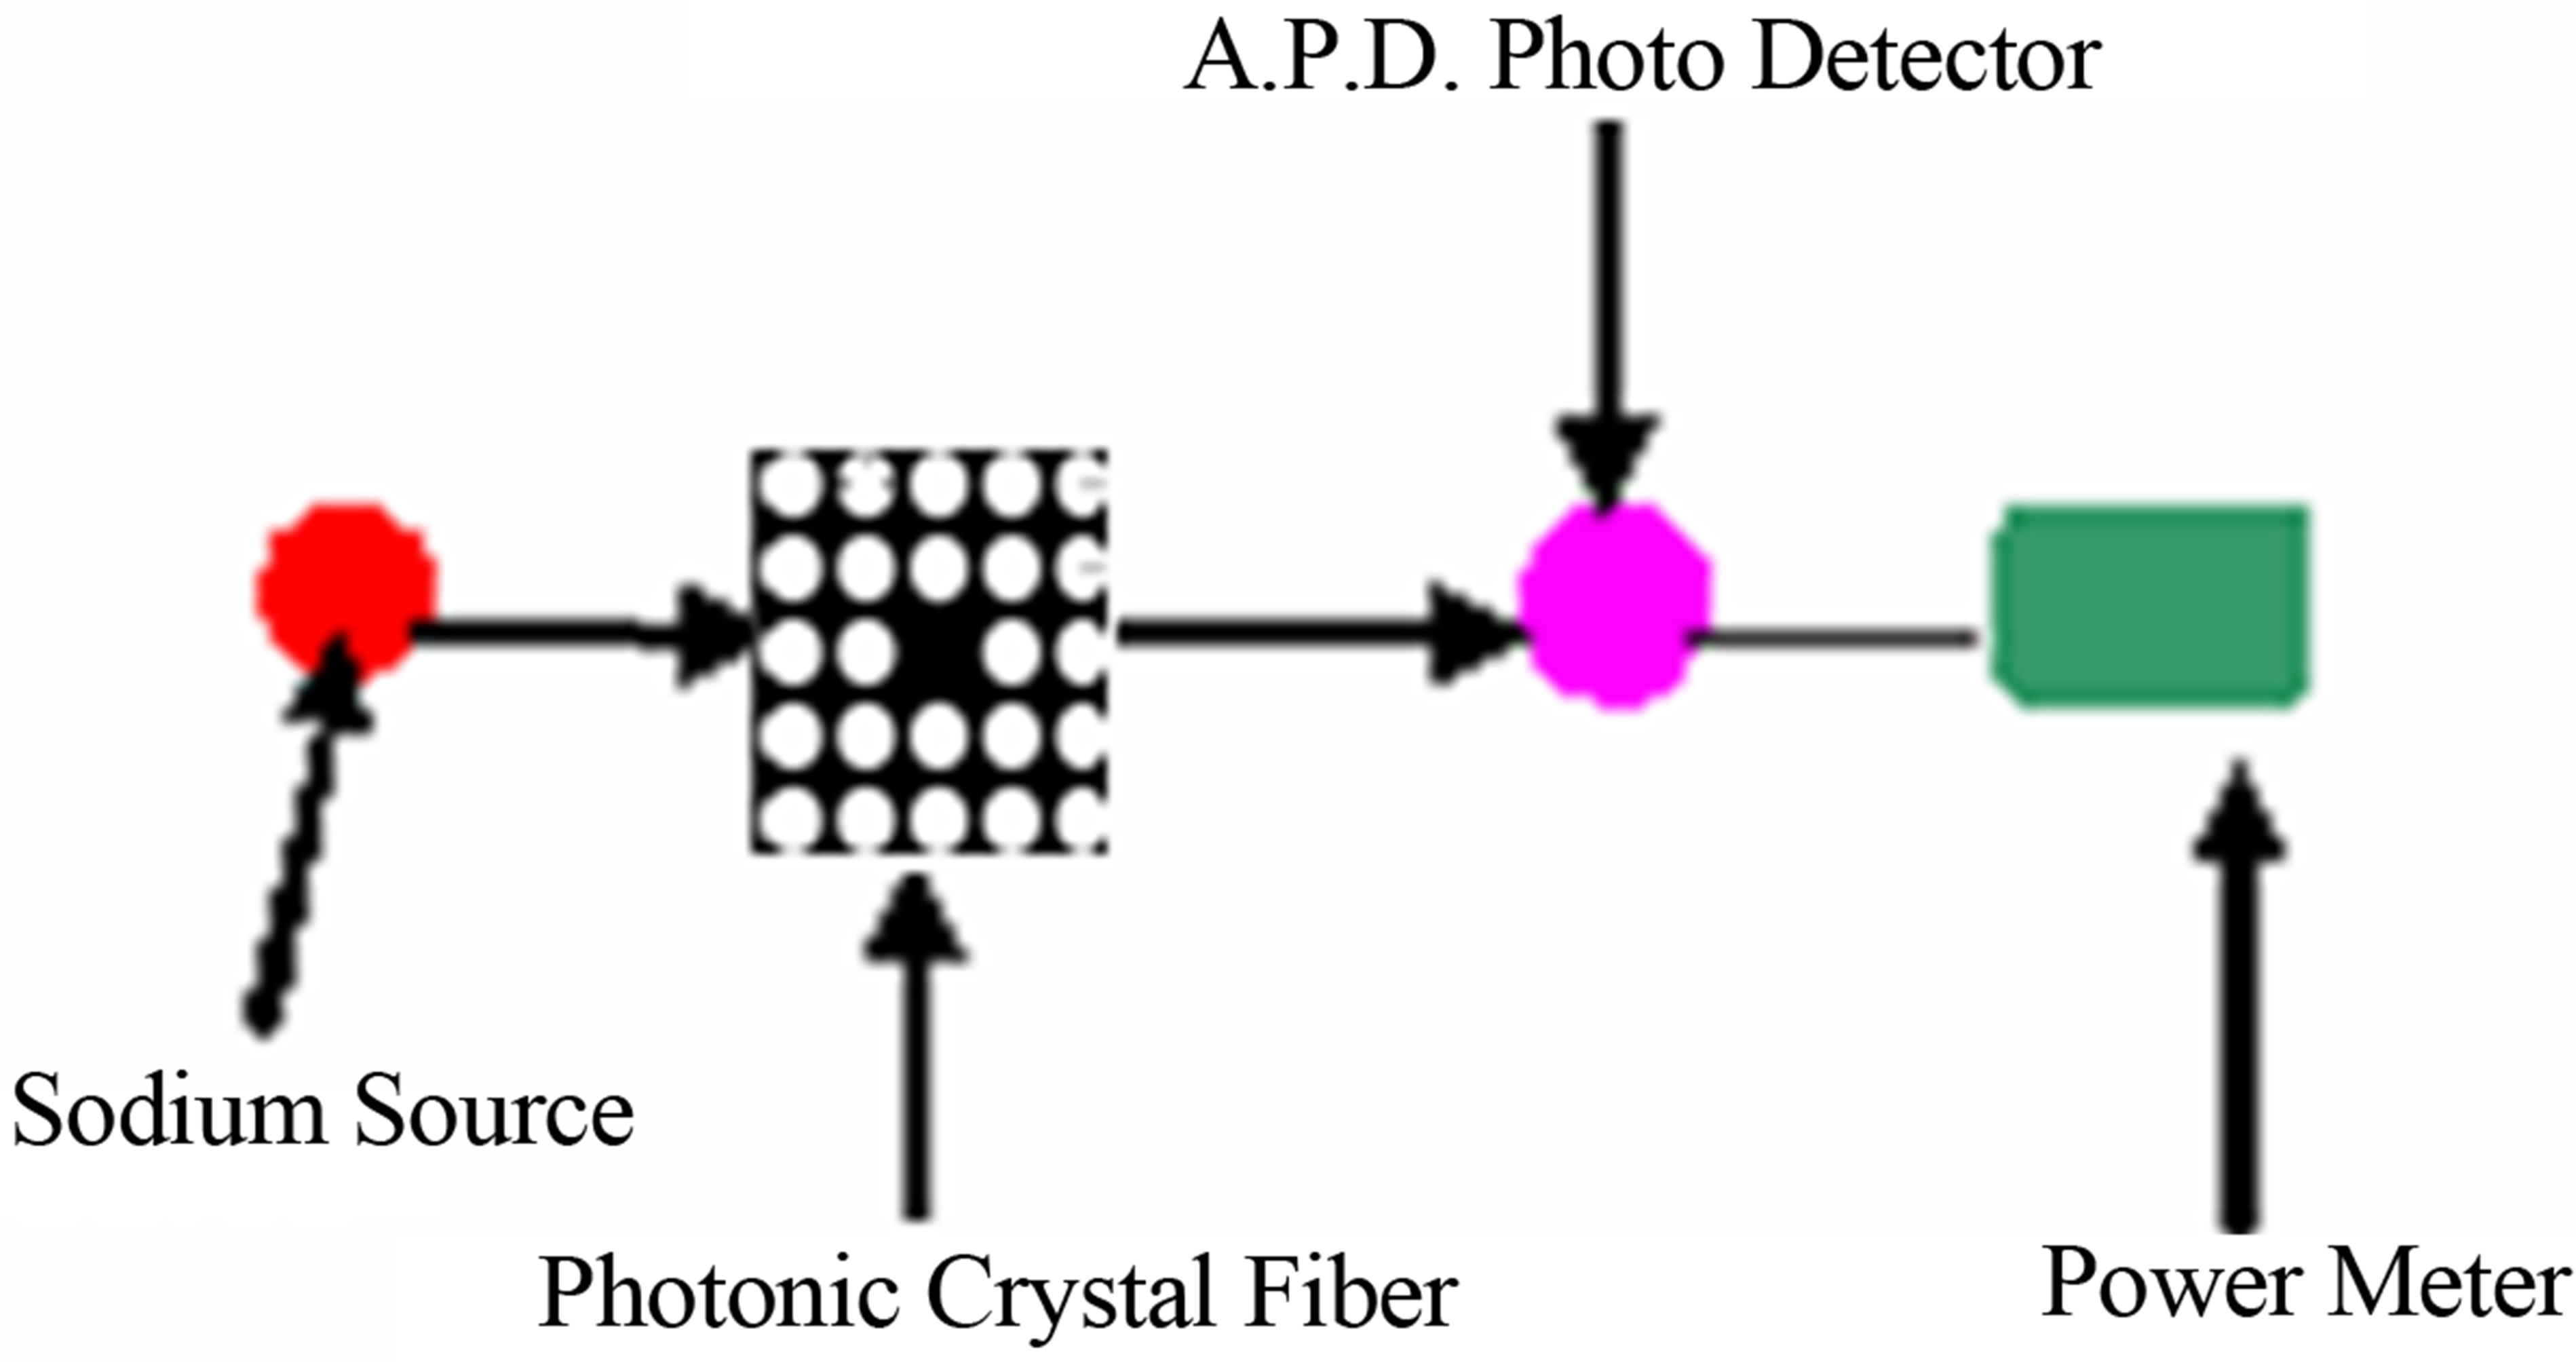
Figure 4. Experimental set up for determining potassium chloride concentration.
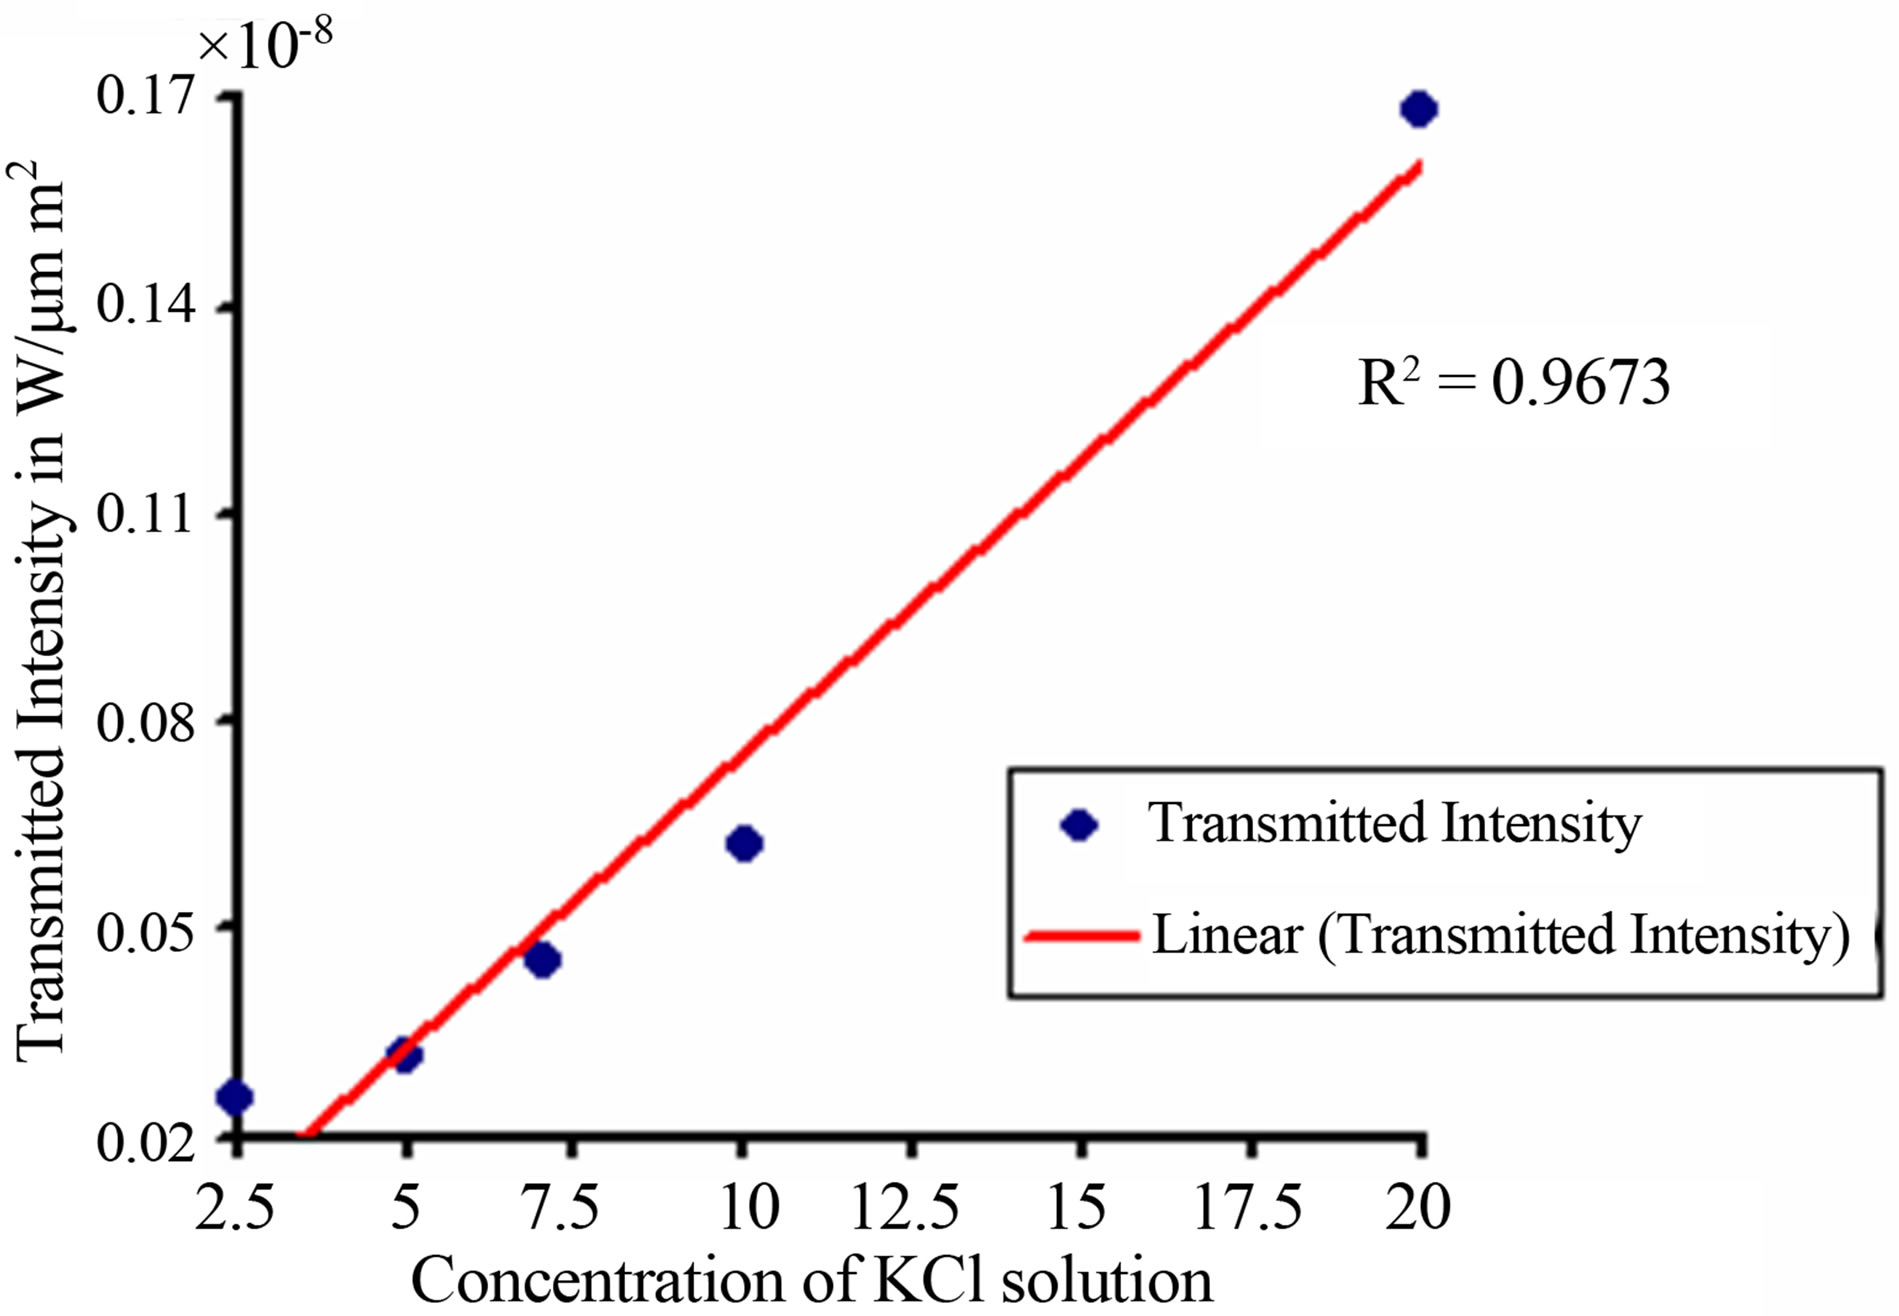
Figure 5. Variation of transmitted intensity with concentration of KCl.
4. Conclusion
Concentration of potassium chloride is estimated by measuring the intensity of transmitted light. Plane wave expansion method is used to determine the field distribution. This measurement is accurate due to its working principle operations in optical frequency. The photonic crystal fiber acts as a sensor to obtain the concentration of potassium chloride in its solution.
NOTES