1. Introduction
Thick film resistors (TFR) are complex heterophase systems [1-7] having the following characteristic inhomogeneity scales:
1) large scale inhomogeneity of few μm or larger, due to substrate, terminations and surface of sample;
2) middle scale inhomogeneity of 0.1 to few μm in size as result of mixing and sintering of powders of glass and conductive phase (CP);
3) nanoscale inhomogeneity of 1-2 nm is a characteristic of the glass itself.
Large scale inhomogeneities are dependent on the design of TFR mainly and too a much lesser extent on its volume. Investigation of nanoscale inhomogeneities is extremely difficult. Moreover the existence of them in glass is the subject of the discussions up to date. So these two kinds of inhomogeneities are usually not considered the factors affecting the conduction mechanism of TFR.
Middle scale inhomogeneity is observed in electron microphotography and in X-ray diffraction patterns of TFR and was the basis to consider the conduction of TFR to be the percolation process. All of the researchers consider the infinite conductive cluster as formed by directcontact of the particles of conductive phase, and glass to be a passive matrix to fix the particles. But this approach does not explain the properties of TFR such as the effect of glass composition, kind of CP and the effect of sintering conditions on the value of conductivity  of TFR and the percolation threshold. In addition, the percolation threshold on the
  (C) might disappear for TFR made of glass of some compositions. There C is volume content of CP. These facts point to the interaction of CP and glass during the sintering process and this interaction is diffusion.
Profiles of diffusion of RuO2 into glass were measured in earlier works [8,9] via electron microprobe. In particular, formation of the reactive layer around RuO2 particles is considered in [8]. Measurements of the resistivity across the interface of glass - RuO2 (angle lap method) have shown that diffusion length of Ru into the lead-boron-silicate glass is 0.5 – 2 um at 1123 K in 10 min.
In [9] diffusion is used to explain effect of sintering conditions (peak temperature and duration) on frequency dependence of impedance of TFR. Thickness of diffusion layer is estimated as few tenths of um at 900 K in 30 minutes and diffusion profile considered to be an error function.
The effect of the thickness of TFR on electrical properties is explained in [10] in terms of diffusion.
Conductivity of TFR as a function of sintering temperature Tf was measured in [11] and it has been shown that percolation levels form due to diffusion of atoms of CP into the glass. The parameters of the diffusion process were estimated from these experiments. The values of activation energy of diffusion (0.2-1.08 eV) in TFR obtained in [11] are not large and so one can assume diffusion to be of exchange type (exchange of oxygen bonds with lead and ruthenium atoms).
But this method is indirect and is based on the properties of electron subsystem in TFR only. It must be noted that there are no visible thermal effects on differential thermal analysis (DTA) curves of the mixture of CP and glass powders at T > 900 K. This fact points at the diffusion and not at the generation of new chemical compounds.
Here we report results of our investigation of interaction of glass and CP (namely RuO2 was used more often) via optical and infrared (IR) spectra since these methods are sensitive to the variations in both electron subsystem and bonds of atoms. X-ray diffraction (XRD) has been used as well.
2. Experiment
Samples investigated were powders of RuO2, leadsilicate glass 2SiO2∙PbO, mixture of them before and after sintering in conditions standard for TFR technology (peak temperature Tf = 1123 K, duration of sintering at peak temperature τ = 10 minute, total duration 60 minute). Powder particles were 0.2 μm and 0.5 μm in diameter for glass and RuO2 correspondingly. Sintered mixture was milled up to 0.5 μm particle size too. Components used for glass melting were of technical category.
RuO2 powders were made by thermal decomposition of Ru(OH)Cl3 in air at 1 100 K, milled and calcined at the same temperature for 1 hour. There were no extraneous compounds of significant amounts found in the powder via XRD. Average size of particles in the powder was about 250 Å from Sherrer formula, while the specific surface measurements give average size of about 0.5 μm. Therefore, one can assume the particles of powder investigated to be polycrystalline consisting from large number of crystalline regions oriented randomly. The discrepancy arises from gist of these methods. The Sherrer’s formula gives main size of the region of coherent scattering (i.e. single crystalline region). On the contrary specific surface measurements give average open surface of the particles, from which main size of them will be calculated regardless of its internal structure (single crystal, polycrystalline etc.) so last value is always no smaller than first one.
IR absorption spectra of powders were taken on the IFS-113 Bruker Fourier spectrometer in the range of 2.5-100 μm, optical spectra – on the Specord M-40 (Karl Zeis, Jena) spectrometer in the 330-1050 nm range.
XRD patterns were taken on diffractometer DRONUM-01 on CuKα radiation with graphite monochromator on reflected beam.
3. Results and Discussion
IR and optical absorption spectra of glass, RuO2, mixture of them before and after sintering are shown in Figures 1 and 2. One can see the fine structure (minute fluctuations) on optical spectra (Figure 2) caused by submicron size of powder particles [12].
Absorption bands near 10 μm and 22 μm on the IR spectrum of glass powder (Figure 1, curve 1) are due to vibrations of [SiO4]4- tetrahedra and Pb-O bonds [13,14].
IR absorption spectrum of RuO2 is featureless and absorbance is varied as  (Figure 1, curve 2). This means that atomic absorption is suppressed by that of free charge carriers, and
 , where
 (1)
(1)
is plasma angular frequency, n and m* are concentration and effective mass of free carriers, ε0 is the permittivity of vacuum [15].
IR spectrum of mixture of glass and RuO2 powders before sintering is superposition of appropriate spectra (Figure 1, curve 3) and do not have new absorption bands. The character of the spectra changes after sintering (Figure 1, curve 4): absorption increases at  > 10 μm and the wavelength dependence is stronger, new absorption bands appear at 6.6 μm and 12.5 μm. The latter one overlaps with the long-wavelength wing of intensive band at 10 μm. Absorption by free carriers is still dominant in the region of
  < 9 μm and α ~
 .
.
Optical spectrum of glass powder (Figure 2, curve 1)

Figure 1. IR spectra of powders: glass (1), RuO2 (2), mixture of them before (3) and after (4) sintering.
is typical and shows the fundamental absorption band starting at 350 nm (transitions from valence band to conductive band) inherent to glass containing 33 mol.% of PbO [16].
Optical spectrum of RuO2 powder (Figure 2, curve 2) has two wide absorption bands centered at 360 and 950 nm (location of last one is approximated because of existence of fine structure).
Optical spectrum of the mixture of powders before sintering (Figure 2, curve 3), like the IR spectrum, is the superposition of spectra of initial powders and does not have additional peculiarities.
The absorption band at 950 nm of optical spectrum of sintered mixture (Figure 2, curve 4) is slightly shifted to highest wavelength and band at 360 nm almost disappears.
It should be noted that in contrast to single crystals, the powders of RuO2 used by us are semiconducting (Figure 3). This might be due to the oxygen excess on the surface of particles. These measurements were made on pellets pressed at 800 MPa, when resistivity becomes nearly independent on applied press. Activation energy determined as a slope of σ(T), has two values: 0.45 and 0.025 eV. Higher value could be attributed to the oxygen layer on the surface of particles which makes them semiconductive, and smaller value is the property of the particle volume.
So one can relate the band 360 nm to the surface layer (transitions between Ru 5s and O 3s states with transition energy of ~3 eV) and band 950 nm – to plasma resonance of free carriers. Thus, it follows from (1) that n has decreased from 1.2∙1021 cm-3 to 1.1∙1021 cm-3 due to sintering.
Gas of free carriers of same concentration is degenerated and temperature dependence of the resistivity of TFR follows the power-law (ρ~Tk) in accordance with scattering mechanism.
Density of RuO2 molecules is 3.6∙1022 см-3 and there is only one electron per 30 atoms of Ru (see above) in
RuO2 powder at room temperature. On the other hand one can assume that all Ru atoms diffused into glass are ionized and concentration of free carriers in TFR is equal to that of Ru atoms. Intensity of the main lines of X-ray diffraction of RuO2 in mixture of glass and RuO2
powders after firing decreases up to 90 % of that in the nonfired mixture. Since volume content of RuO2 in mixture was 16 % (corresponds to 25 weight %) one can consider that only small part of Ru atoms (nearly 3 %) is diffused from particles into glass.
Paucity of Ru atoms diffused into glass is verified from X-ray diffraction patterns as well (Figure 4). Main reflexes of RuO2 in last one are broadened and shifted slightly to small angle after sintering. This means that the relicts of RuO2 crystals are stressed in TFR because of the highest value of thermal expansion coefficient of RuO2 crystals in the a direction in comparison to that of glass (144∙10-7 К-1 and 71∙10-7 К-1 accordingly), while in the c direction it is negative (-39∙10-7 К-1).
New bonds O-Ru-O form during the sintering process in addition to the existing Si-O-Si bonds (bridge atoms of oxygen) and O-Pb-O, inherent in glass 2SiO2∙PbO. Additional bonds have large dispersion of length and bonding constant because the diffused atoms of Ru became bonded both to the [SiO4]4— tetrahedra and Pb atoms, generating the Si-O-Ru-O–Si, Si-O-Ru-O-Pb-O and O-Pb-O-Ru-O-Pb bonds. Retained bonds O-Ru-O-Ru-O are deformed due to the mismatch of thermal expansion of RuO2 and glass. Since the atomic mass of Ru atom lays between that of Si and Pb, the bonds of Ru with oxygen atoms, having different location in glass structure, appear as wide absorption band between 10 and 22 μm (Figure 1).
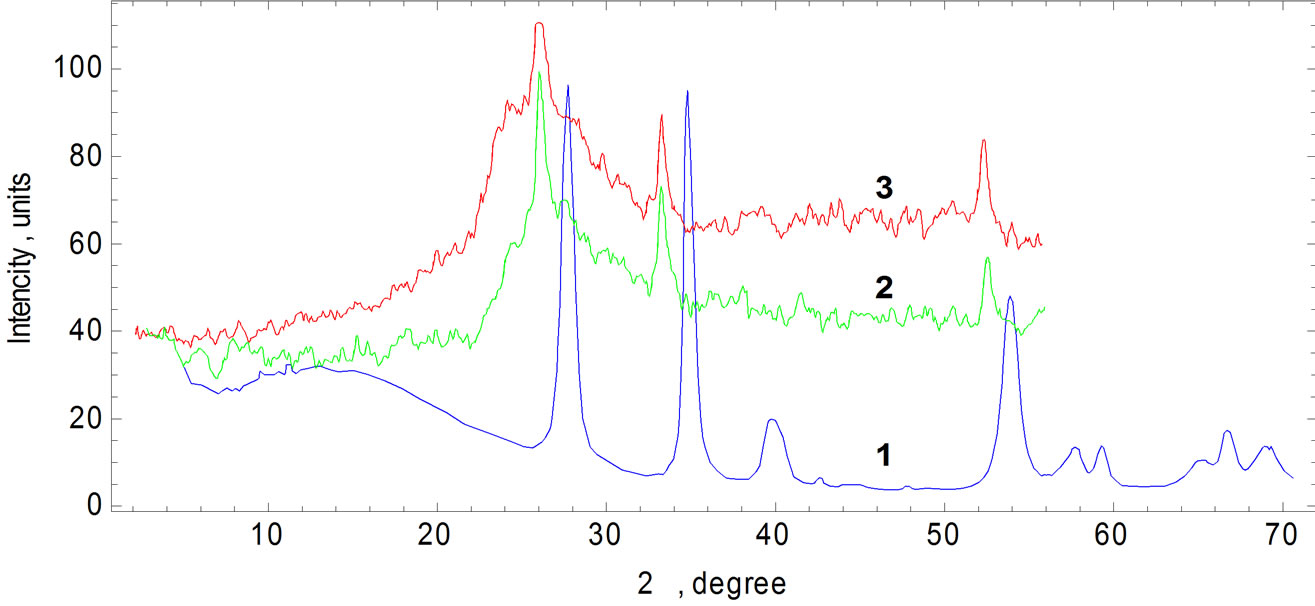
Figure 4. X-ray diffraction in RuO2 (1) and TFR (glass + 16 mass. % RuO2), sintered at 873 К (2) and at 1073 К (3).
4. Conclusions
Sintering of the TFR consisting from RuO2 and silicate glass leads to interaction of them. But no new reflexes of reasonable intensity were observed in XRD and one can exclude the formation of new chemical compounds and consider the interdiffusion of components. As a result of diffusion the glass becomes conductive and infinite conductive cluster is formed from adjacent diffusion zones centered on the CP particles. Because of them percolation threshold can shift to small content of CP or disappear if diffusion process is long enough. Exclusion of the interaction of CP and glass in TFR might be the main obstacles in attempts to explain the electrical properties of TFR.
It is clear from the IR spectra of glass powders, CP and their mixture that free charge carriers are the main factor of absorption and have so high concentration that the frequency of plasma resonance is shifted to the optical range. Free carriers concentration estimated from optical spectra is about 1021 cm-3 and gas of them is degenerated. Small value of activation energy of diffusion (0,2-1,08 eV) calculated from electrical measurements [11] shows that diffusion is of the exchange type (exchange of oxygen bonds with Pb and Ru atoms).
5. Acknowledgements
Fond for Support of Fundamental Researches of the Uzbek Academy of Sciences is acknowledged for the financial support (grants 55-08 and 27-10).