The Consequence of Particle Crushing in Engineering Properties of Granular Materials ()
1. Introduction
Sand particles breakage represents one of the most important factors that are able to alter the mechanical properties of Sand through increasing the portion of fines. The topic is of interest to many research disciplines including powder technology, minerals and mining engineering, geology, geophysics and geomechanics [1-4]. Grain crushing is one of the micromechanisms that govern the stress-strain behavior of a granular material and also its permeability by altering the grain size distribution [5]. The behavior of granular materials is very multifaceted, behaving neither like solids nor like viscous fluids. Stresses inside the granular body are composed by multiple of stress chains, which can lead to local high-stress concentrations within the system. The high stress concentration may lead to inducing crushing of single particle even under relatively low stresses. If sand particles are broken into smaller particles due to the application of external force, physical and mechanical properties of the granular matter will undergo substantial change. Therefore, the original engineering properties with which a structure was designed will change during its engineering life. Examples of these structures which will suffer from such changes are pavements: highway embankmentsearth dams’ embankment, and rock fill dams, etc. Changes in the original engineering properties could put the stability of such structure in jeopardy and make it unsafe during its life of operation. Therefore, understanding the crushing in granular materials during the process of compression and shearing is of highly needs.
Experimental works on the crushing of the sandy materials point out many key factors associated with the occurrence of particle crushing. It has been established that grain crushing is influenced by soil particle solely strength, topology such as angularity, granular materials physical properties such as gradation, porosity, and moisture content, induced stress level and anisotropy [6-17]. Past researches have indicated that the angle of shearing resistance for granular materials undergoing crushing decreases as a consequence of particle crushing [18,19] conducted a ring shear tests on carbonate sand and reported that crushing of particles occurred without a loss of residual angle of internal friction. In this regards, the reported results give the impression that crushable granular materials experience a reduction in the internal friction angle as a consequence of particle breakage prior to achieving a constant value of shear strength. This paper focuses on evaluating the effect of particle breakage in shear strength of dry sand and the effect of particle breakage angle in the estimation of permeability coefficient for granular material subjected to a one dimensional compression. The results of the tests conducted on Aqaba bay sand will be presented and analyzed.
2. Experimental Program
2.1. Material
The material used for the tests was sand samples collected form Aqaba Bay in Jordan. The specific gravity of the sand is 2.63. The particles shapes for the sample are subrounded. In sand natural location particle size and shape reflect material composition, grain formation, transpor tation, and depositional environments. Thus, physical and chemical weathering determines grain shape once it is released from the matrix of parent rocks. From X-ray diffraction analyses, the most dominant mineral in their composition is the quartz with traces of Na-plagioclase and Anorthoclase, therefore, granite rock is the mother rock of the sample.
2.2. Equipment and Procedures
The natural sand samples were prepared as followed. The sands were rained from specific height to a standard compaction test mold of a size 944 cm3. Thereafter the sand was subjected to one-dimensional compression from a hydraulic Jack to a desire pressure. Grain size distribution analysis was made. Other samples were then subjected to direct shear tests using a standard laboratory shear box apparatus with an initial sample cross-section of 60 mm ´ 40 mm. The sand samples were prepared by sieving a predetermined mass of sand over an open box-shaped metal grid inside the shear box, and then slowly raising the grid. This technique assures that there is no segregation of the particle sizes takes placed during the deposition of sands.
3. Experimental Results
3.1. Imposing Particle Breakage
Sand samples were subjected to different level of onedimensional compression. Vertical stresses of 0 MPa, 5 MPa, 10 MPa, 15 MPa and 20 MPa were applied to the sand samples. Since the origin of sand was the granitic rocks, the chosen ranges of compressive stress induced on the sample to produce breakage was based on the ranges reported earlier by [6] for grantic’s sand.
The altering of grain size distribution due to one-dimensional compression is shown in Figure 1. It is obvious that the vertical stresses induced by one-dimensional compression increase the amount of fine particles as a sequence of particles breakage increase. AS2 samples were also subjected to the same level pressure. However, the variation of grain size distribution to this level of pressure was diminutive. Table 1 lists the progression of coefficient of uniformity, Cu, coefficient of curvature, Cc, and the classification of the soil samples as a sequence of particle breakage due to the applied vertical stress. The data listed in Table 1 clearly indicate the increase of both Cu and Cc. However, the classification and the description of soil samples according to unified soil classification system remain constant as a poorly graded soil.
3.2. Particle Breakage Quantification
Grain size distribution approaches that of a well graded soil for a large compressive loads found by [9] that if uniform sand is crushed. However, before the granular assembly reaches a well graded particle distribution, the granular assembly will experience gradual changes in particle size depending in the level of progressive load being applied.
The index of crushing calculated from the grain size distribution after one dimensional compression through [20] formula given as:
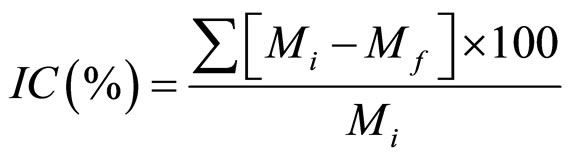 (1)
(1)

Figure 1. Alteration of grain size after one-dimensional compression.
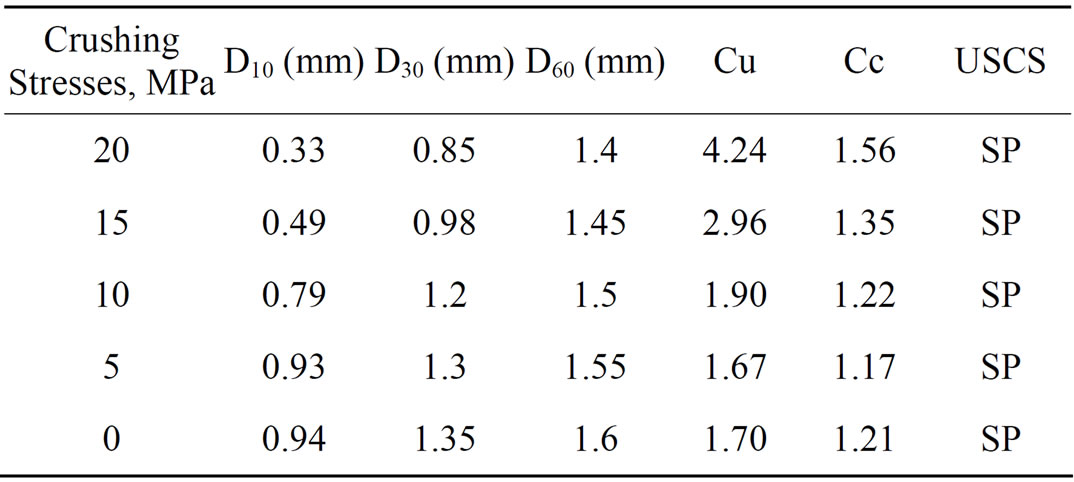
Table 1. Progression of, Cu, Cc, and the classification of the soil samples.
where:
Mi = Initial percent passing sieve size.
Mf = Final percent passing sieve after compression.
The change of passing percentage of each size are shown in Figure 2 for each compression loads. The index of crushing evolution as function of compression stresses is shown in Figure 3. Moreover, the amounts of particles breakage were evaluated from the grain size distribution curves using the method developed by [9]. In this method crushing evaluated by using the particle breakage factor named B10. This parameter is based on the effective size (i.e. D10 and can be obtained from
 (2)
(2)
in which B10 = particle breakage factor, D10f = effective grain size of the final gradation, and D10i = effective grain size of initial gradation. The Progress of particle breakage due to compressive stress is shown in Figure 4.
An alternative definition of particles breakage was proposed also by [21].
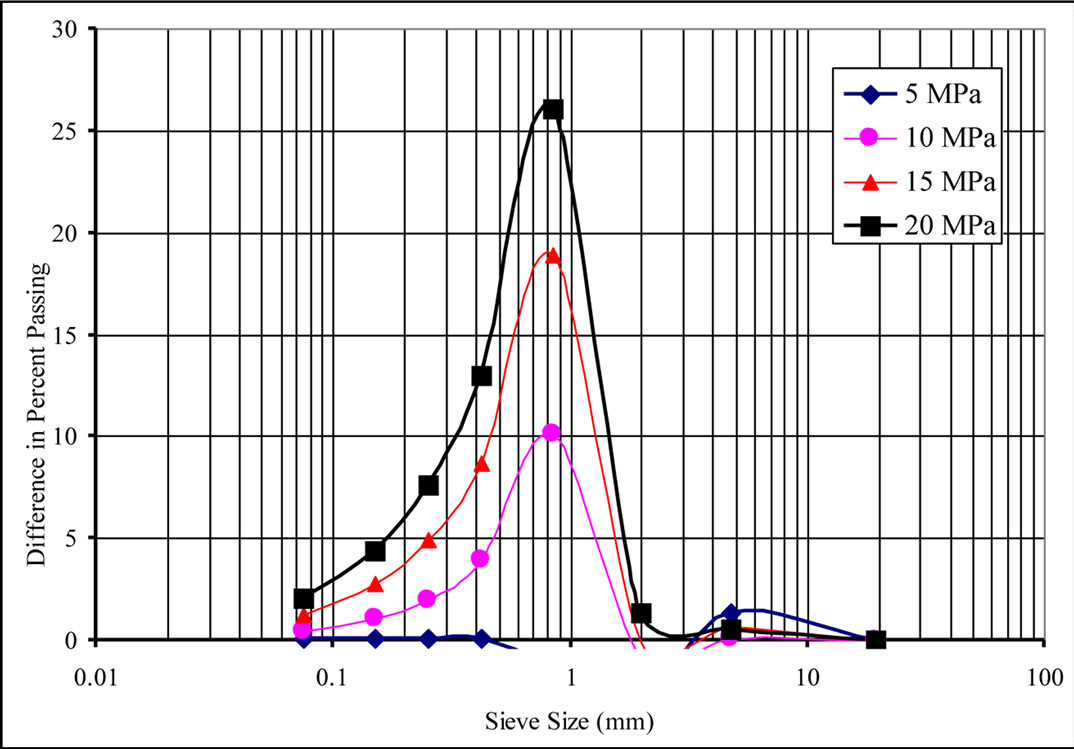
Figure 2. Changes of percent finer of samples after one-dimensional compression.

Figure 3. Evolution of index of crushing as function of compression stresses.
Einav [21] postulates that the grain size distribution will start from and an initial grading and ultimately reach a final grading due to shearing and compression. The relative breakage index, Br, is defined as an area ratio as
 (3)
(3)
where Bp, the “breakage potential”, is defined by integrating the entire area confined between the initial and final grain size distribution whilst Bt between the current, at given compression stress, and the initial grain size distribution, when there is no applied shear or compression stresses (see Figure 5). The Progress of particle breakage according to Einav (2007) postulate is shown in Figure 6.
3.3. Influence of Particle Breakage on Shear Strength
The response of stress strain curve at deferent particle breakage factor under normal stress of sn = 165 kPa are shown in Figure 7 whilst Figure 8 shows the volumetric change. It is clearly shown from these figures that particle breakage alter both the peak and residual stress strain response of the samples as well as the response of dilation/contraction of the volume of the samples.

Figure 4. Evolution of The relative breakage index in one dimensional compression.

Figure 5. Einav (2007) modification definition of Hardin’s breakage index Br.
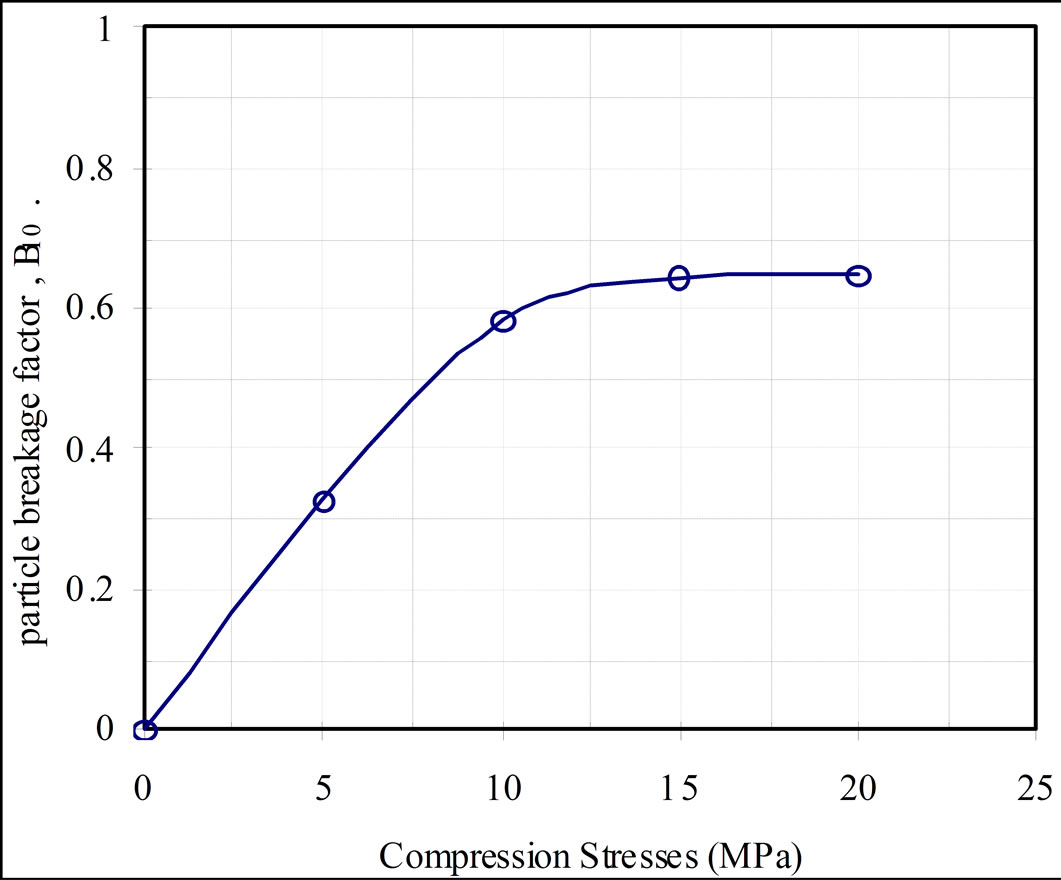
Figure 6. Progress of particle breakage due to compressive stress.

Figure 7. Effect of particle breakage on shear stress displacement curve (sn = 165 kPa).
The shear resistance of pulverized sand comes from interparticle friction and dilation. The two basic parameters can be deduced directly from the direct shear box. The direct shear friction angle,  can be obtained from the boundary measurements of average horizontal shear stress, txy and the average vertical normal stress, σyy by
 . The dilation angle, ψ is obtained from the ratio change of increment of vertical strain
  to increment of horizontal strain
  as
as . Moreover, at large displacement, the direct shear friction angle reaches a constant value called the residual friction angle;
  depend on the initial density of the sand.
The effects of particle breakage on the peak friction, dilation, and residual angles for sand samples are shown in Figures 9. The particle breakage was shown higher effect on residual compared with anther component of the shear resistance component. This is due to the fact that more breakage occur more abrasion to the particle occur which lead to less asperities of the sand particle, less interlocking and more particle arrangement and rotation occur.
3.4. Influence of Particle Breakage on Hydraulic Conductivity
The flow of water in sandy soils can be very significant, since it is important to know the amount of water that will enter the excavation during construction, or the amount of stored water that may be lost by seepage through or beneath a dam. Moreover, the behavior of soil is governed by the intergranular stress, which is the difference between total (overburden) stress and pore water pressure. Therefore, when water flows through the soil pores, the pore water pressures in the ground change. Thus, knowledge of how the pore water pressure changes can be important in considering the stability of earth dams, retaining walls and foundation. Because the pores in soils are so small the flow through most soils is laminar. This laminar flow is governed by Darcy’s Law. Darcy’s law states that the velocity is proportional to hydraulic gradient, the proportion constant called the coefficient of permeability, k, and can easily for sand soil measured by a constant head apparatus. The measured k for different compression strength is shown in Figure 10. It is clearly evident that crushing alters significantly the value of k. Moreover it is well know to relate the coefficient of permeability to effective grain size diameter, D10, as in Hazen (1930) where, k (cm/sec.) =  (D10 in mm) or in the US Bureau of Reclamation, where k = 0.36
 or in Chapuis (2004) where
  in which e = current void ratio and emax = maximum void ratio. The predict k also presented in Figure 10. It is obvious from that Hazen formula still predict the measured k better than either US Bureau of Reclamation or Chapuis formula. Furthermore reexamine Figure 2, it’s clearly shown that the most particle breakage occur at diameters

Figure 10. Prediction and measured k for different particle breakage parameters.
between D10 and D20, henceforth all the measured value lies between the two estimates.
4. Conclusion
Particle breakage for natural Aqaba sand was investigated experimentally. The natural sand specimens were subjected to one-dimensional compression to induce breakage. The grain size distributions of the specimens were reported before and after the application of the stresses. Thereafter, the sand shear strength parameters were assessed using direct simple shear. Inspection of the residual shear strength parameters, i.e. the residual angle of friction, showed an increase as the amount of particle crushing increasing regardless of the level of the normal stress being applied. Moreover, particles breakages reduce the coefficient of permeability drastically. Hazen (1930) formula gave the closest prediction of k, compared with other formulas presented in the literature.