Determination of Tramadol in Human Serum by Capillary Electrophoresis with the End-Column Electrochemiluminescence Detection ()
1. Introduction
Tramadol (Figure 1) hydrochloride is a new category of non-morphine analgesic drugs, which can alleviate the ache because of bone fracture or each technique, the mild cancer. Therefore, a sensitive method to determine tramadol at low level is of considerable for pharmacokinetic and clinical studies. In these methods, the ultraviolet (UV) [1], high-performance liquid chromatography (HPLC) [2], capillary electrophoresis gas chromatography (CEGC), and bolivian carbon electrode voltammetry are commonly used. But these methods need preconcentration before determination because of lacking high sensitive detector.
Capillary electrophoresis (CE) had attracted much attention and became an important and powerful analytical tool in liquid separation and detection areas [3] including the analysis of inorganic ions, organic molecules, clinic and pharmaceutical fields [4]. CE technique has advantages of minimal sample volume, high separation efficiency, relatively short analysis time and low instrumental cost [5]. These advantages make CE an alternative to HPLC. With this method, tramadol is detected with UV [6-7], MS [8] or LIF [9]. Whereas, either low sensitivity as UV, or complicated equipment and high price of detector as LIF and MS limit related practical application.
CE coupled with ECL using Ru has been studied in recent years. CE-ECL offers the merits with enhanced sensitivity, improved selectivity, possible micromation and integration and reduced cost. Because of intrinsic characters of ECL of Ru
 , it shows especially high sensitivity for tertiary amines [10], and it is used to detect amino acid, peptides and β-blockers [11-16] for CE. Wang et al. [17] ever have used CE-ECL endcolumn for simultaneous determination of tramadol and lidocaine in urine. In our research, serum (after centri-
fuged plasma) as sample. On the other hand, plasma circulation is a relative obturate system compared with urine metabolism according to the quantity of water that intake by different individuals. Using CE-ECL method to determine tramadol in serum reflects tramadol metabolism more geuine. Therefore, it is necessary to develop a more reproducible, more precise, selective and more simple method to study tramadol in human serum.
In this paper, a simple, fast, sensitive and more selective method for detecting tramadol is presented and successfully used to determine the tramadol contents in human serum sample.
2. Experimental
2.1. Reagents and Chemicals
All chemicals and reagents used in this experiment were of analytical grade. Tramadol hydrochloride (TMD) was purchased from National Institute for the Control of Pharmaceutical and Biological Products. Tris (2,2’- bipyridyl) ruthenium (II) chloride hexahydrate (98%) was purchased from Sigma-Aldrich Chemical Co. (Milwaukee, WI, USA) and used without further purification. The running buffer was prepared with Na2HPO4 and NaH2PO4 at a phosphate concentration of 20 mmol·L−1 and pH of 8.0. Double-distilled water was prepared by a Milli-Q water purification system (Millipore, Bedford, MA, USA). All solutions were stored in the refrigerator at 4˚C and filtered through a 0.22 μm membrane filter before use.
2.2. Apparatus
MPI-A CE-ECL was purchased from Xi’an Remax Electronic Science-Tech Co. (China). The end-column detection cell of CE-ECL was composed of a three-electrode system (300 μm diameter Pt disc as working electrode, Ag/AgCl−1 electrode as reference electrode, and Pt wire as counter electrode). An uncoated fused-silica capillary (25 μm I.D., 360 μm O.D.) with the length of 40 cm from Yongnian Optical Conductive Fiber Plant (Hebei, China) was set between two buffer reservoirs and electrophoresis was driven by the high potential apparatus. Electrochemical analyzer was adapted to constant potential control. Multi-channel data acquirement and analysis apparatus was employed to collect the intensity of the electrogenerated chemiluminescence.
2.3. Preparation of Standard Solutions
The stock solution of 1 mmol·L−1 tramadol hydrochloride was prepared by dissolving 23.3 mg tramadol hydrochloride in 50 mL water and stored at 4˚C in a refrigerator. Before use, the stock solution is diluted with water to prepare standard solutions with a series of concentrations for the construction of calibration curve, the study of reproducibility and the study of recovery.
3. Results and Discussion
3.1. Cyclic Voltammograms of  and Tramadol Hydrochloride
We studied the ECL behaviors of Ru and TMD at the Pt electrode. As shown in Figure 2, there was no ECL intensity at Pt electrode in 50 mmol·L−1 phosphate buffer with 5 mmol·L−1 Ru
 (curve a). When 10−4 mol·L−1 TMD was added, the ECL intensity increased rapidly from 1.0 to 1.3 V (curve b) and reached a maximum at 1.17 V. This accorded with the oxidation potential of Ru
 [18], which indicated that the oxidation of Ru
 played an important role on the TMD-ECL reaction.
3.2. CE-ECL Optimization
We studied the operating parameters on the TMD determination, such as the detection potential, injection voltage, injection time and buffer conditions as follows.
3.2.1. Effect of Hydrodynamic Voltammograms (HDVs)
The effect of detection potential on the ECL intensity of TMD was investigated as shown in hydrodynamic voltammograms (HDVs) Figure 3. The ECL intensity was not reached maximum when the detection potential was lower than 1.0 V because Ru was not oxidized on the working electrode totally. When the potential was stepped from 1.0 to 1.3 V, the ECL intensity of TMD increased accordingly, and reached a maximum at 1.20 V, after that the signal decreased slightly. So 1.20 V (versus Ag/AgCl−1) was selected as the ECL optimum detection potential.
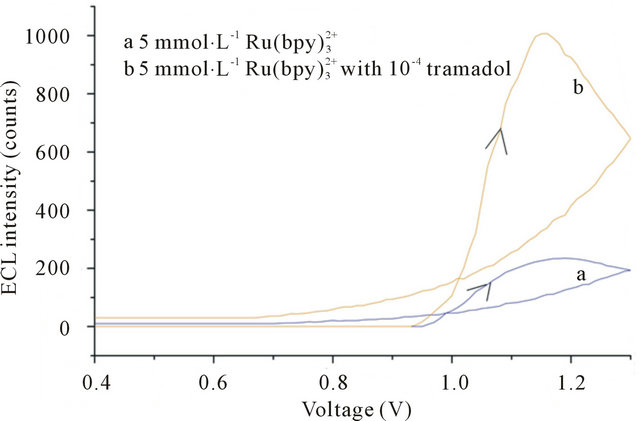
Figure 2. Dependence of the ECL intensity on applied voltage curve. Conditions: 5 mmol·L−1  without (a) or with (b) 3 × 10⁻⁴ mol·L−1 tramadol hydrochlorid. 50 mmol·L−1 phosphate buffer at pH 7.67 in the detection cell.
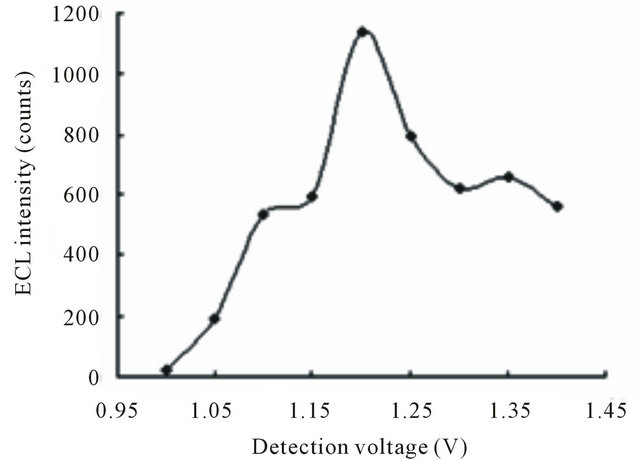
Figure 3. Dependence of the ECL intensity on the detection potential. Conditions: 3.108 × 10⁻⁴ mol·L−1 tramadol hydrochlorid solution, 20 mmol·L−1 phosphate buffer at pH 7.80, 5 mmol·L−1  in the detection cell, electrokinetic injection 10 s × 10 kV.
3.2.2. PH of Running Buffer
The pH of detection buffer has a significant effect on the ECL response. The previous work indicated that Ru has a good ECL efficiency in a weak basic solution because of the deprotonation of the amine species to form a reducing free radical intermediate and the reaction between radical intermediate and tramadol species [19-24]. Also, the pH of separation buffer influences electroosmotic flow (EOF) and the analyte ionization and thus, the separation efficiency. Moreover, if the pH value of separation buffer is different from that of detection buffer, a pH gradient will be noticed along the capillary; so, to eliminate the effect of the difference between detection buffer and separation buffer, two buffers with same pH were used. Figure 4 gives the effect of buffer pH on the detection sensitivity and migration time. The highest ECL intensity of tramadol was at pH 8.0. With increasing pH of the buffer, the eletroosmotic flow inside capillary increased remarkably, and the migration time increase gradually. To maintain good sensitivity and a suitable analysis time, both the detection buffer and separation buffer with pH 8.0 were used.
3.2.3. Effect of Injection System
We investigated effects of injection voltage and injection time on the ECL intensity of TMD, respectively. The ECL intensity increased with higher injection voltage was almost proportional to voltage in the range from 2 to 18 kV shown in Figure 5. When the voltage was higher than 10 kV, the ECL intensity increased slowly, moreover, the higher injection voltage also led the column efficiency falling. Hence, the 10 kV was chosen.
The injection time also affected the detection at the intensity voltage of 10 kV. The Figure 6 indicated when injection time changed from 4 to 18 s, the ECL signal
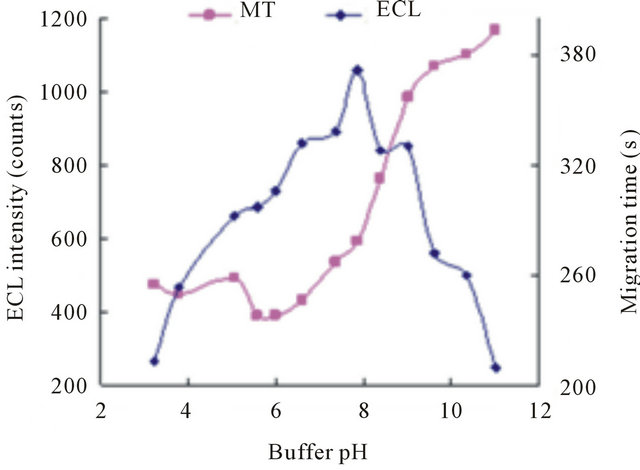
Figure 4. Effect of the buffer pH on ECL intensity (◆) and migration time (■). Conditions: 2.1756 × 10⁻⁵ mol·L−1 tramadol hydrochlorid, 5 mmol·L−1 , 20 mmol·L−1 phosphate buffer, detection potential 1.20 V, electrokinetic injection 10 s × 10 kV.
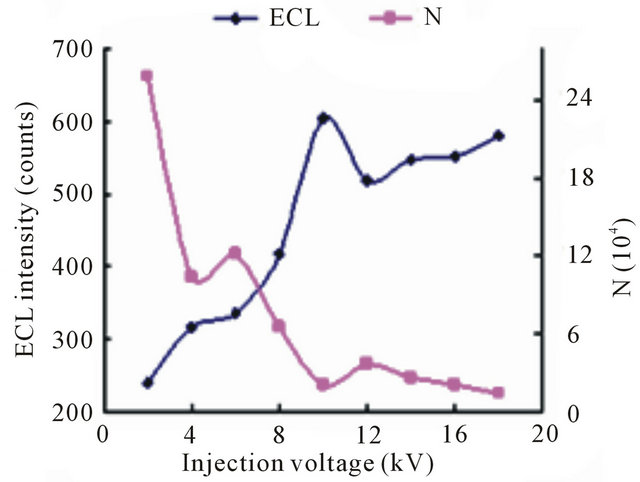
Figure 5. Dependence of the ECL intensity (◆) and separation efficiency (■) on the injection voltage. Conditions: phosphate buffer at pH 7.80, 2.1576 × 10⁻⁵ mol·L−1 tramadol hydrochlorid solution, 5 mmol·L−1 , injection time 10 s, detection potential 1.20 V.
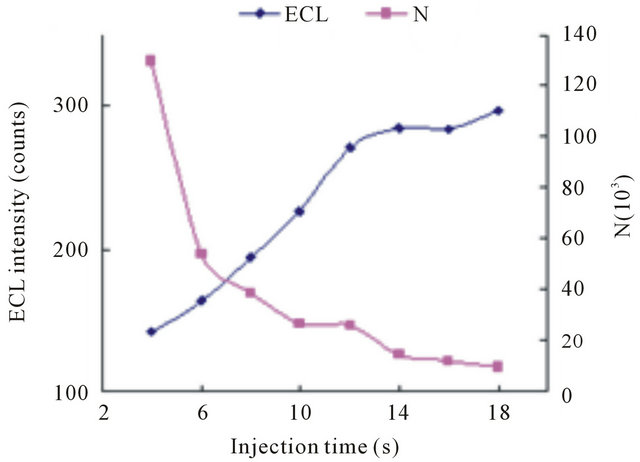
Figure 6. Dependence of the ECL intensity (◆) and separation efficiency (■) on the injection time. Conditions: 2.1576 × 10⁻⁵ mol·L−1 tramadol hydrochlorid solution, 5 mmol·L−1 , phosphate buffer at pH 7.80, injection voltage 10 kV, detection potential 1.20 V.
increased proportionally, but the low column efficiency occurred. Therefore, 10 s was selected as optimum injection condition.
3.2.4. Concentration of 
Ru was post-column added in our work. The ECL reaction was expected to occur when tramadol met Ru
 at the electrode surface. The concentration of Ru
 may exert an effect on the detection sensitivity. Figure 7 shows the ECL intensity changes as a function of Ru
 concentration. Kept tramadol concentration at a constant value of 2.15 × 10⁻⁵ mol·L−1 determined the ECL intensity when Ru
 concentration was changed. In the range of 3 - 10 mmol·L−1 Ru
 , ECL intensity rose steadily with an increase of Ru
 concentration and reached the maximum when the concentration of Ru
 was 5 mmol·L−1. Beyond 5 mmol·L−1, the ECL intensity was not enhanced and distinct minished. Thus, 5 mmol·L−1 Ru
 was chosen for further experiment in light of sensitivity and stability.
3.2.5. Analytical Performance of the Present CE-ECL
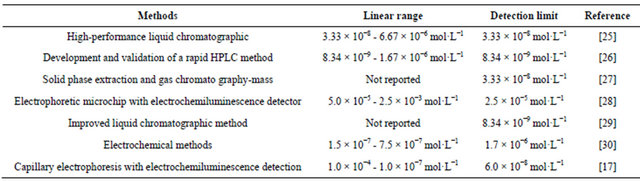
Under the optimized conditions, detection voltage of 1.2 V, buffer at pH 8.0, electrokinetic injection for 10 s at 10 kV, and 5 mmol·L−1 Ru in the detection cell, the reproducibility of the method was tested by consecutive injection of tramadol standard solution of 10−4 and 10−5 mol·L−1 (n = 10). The R.S.D. values of ECL intensity and migration time were 4.58% and 1.39% for 10−4 mol·L−1 and 4.55% and 0.72% for 10−5 mol·L−1, respectively. A series of standard solutions with different concentration was tested to determine the linearity. Regression equation is Y = 737.9x + 64.591 (n = 12). Correlation coefficient is 0.9973. The calibration curve obtained exhibited satisfactory linear behavior over the concentration ranging from 6 × 10⁻⁶ mol·L−1 to 3 × 10⁻⁴ mol·L−1 with a detection limit of 3.012 × 10⁻⁸ mol·L−1 (S/N = 3). Compared with other optical detection methods showed in Table 1, the present method has the advantages of selectivity, sensitivity, reproducibility, linearity and small sample.
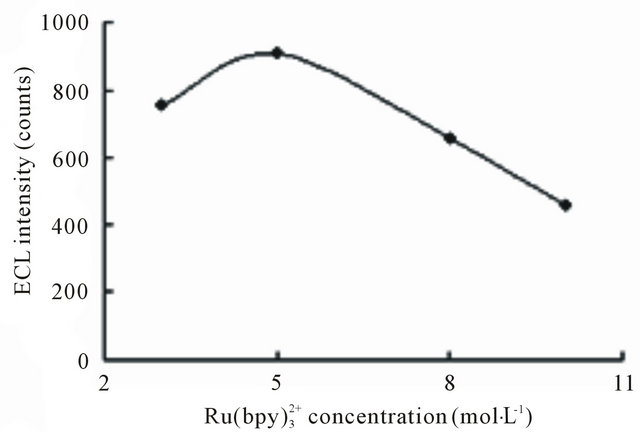
Figure 7. Effect of  concentration on ECL intensity. Conditions: 2.1576×10⁻⁵ mol·L−1 tramadol hydrochlorid solution; 20 mmol·L−1 running buffer at pH 7.80; 50 mmol·L−1 phosphate buffer in the detection cell; electrokinetic injection 10 s × 10 kV.
4. Applications
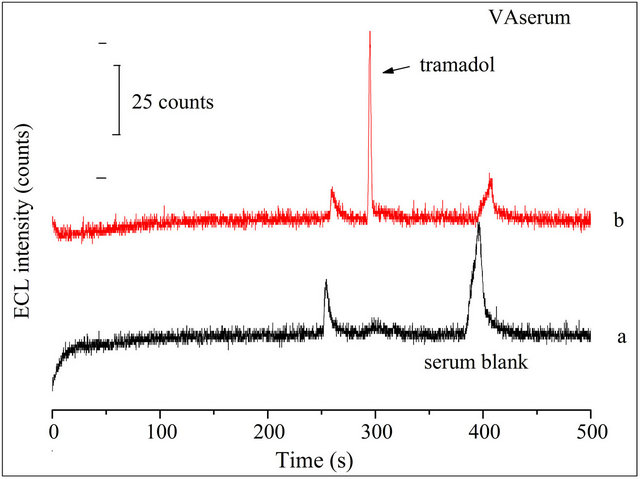
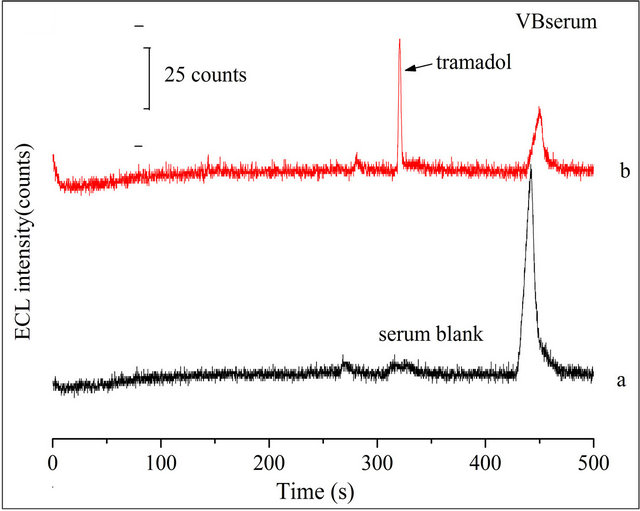
The proposed CE-ECL method was employed for the determination of TMD in human serum sample. Two healthy young volunteers’ blood samples were collected and immediately centrifuged to get the serum. Before use, the serum samples were diluted 10-fold with doubledistilled water and filtered with 0.22 μm membrane. Analyzed serum samples in the same optimized conditions. Figure 8(A-a) and Figure 8(B-a) were the electropherograms of the blank volunteer A serum and the blank volunteer B serum, respectively. The obvious peak variety reveals the individual differences.
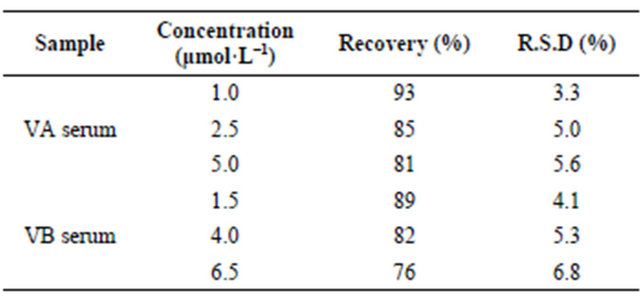
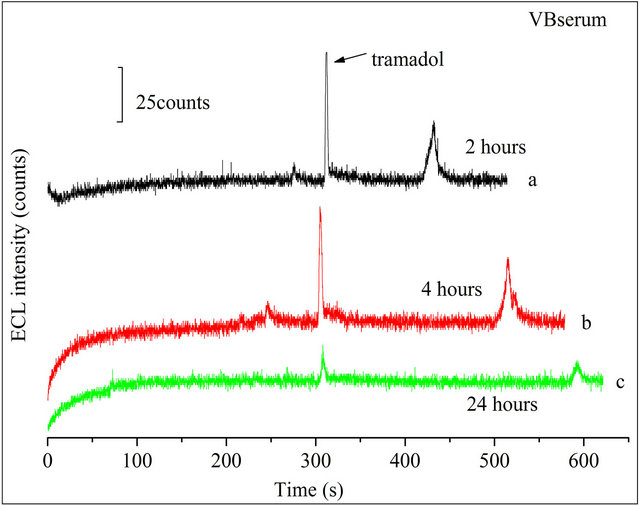
Added 10 μmol·L−1 TMD to the diluted serums, respectively, and determined them in the optimized conditions by CE-ECL method. A similar peak occurred in Figure 8(A-b) and Figure 8(B-b). The tramadol signal occurred at 300 s. The recoveries of tramadol in VA and VB serum sample at different concentrations were 93% - 81% and 89% - 76%, respectively. The R.S.D of ECL peak intensity was less than 7.0%. Results showed in Table 2. Further, the changes of TMD in serum with time were shown in Figure 9(A) and Figure 9(B) for 2
Table 1. Comparison of analytical performances of the previously reported methods with the proposed method.
(A)
(B)
Figure 8. Typical electropherograms of: (a) 1:10 diluted blank volunteer (A) serum or volunteer (B) serum sample; (b) 10 μmol·L−1 TMD was spiked to a. Conditions: detection voltage 1.2 V, buffer at pH 8.0, electrokinetic injection for 10 s at 10 kV, 5 mmol·L−1  in the detection cell.
hours, 4 hours and 24 hours, respectively. We can see that there is not any obvious signals variety with the change of time in the range from 2 h to 4 h for the two samples. However, after 4 h, the signal reduced greatly. The exact reason remains unclear, but this may be associated with some substances or bacteria in serum sample inducing the decomposition of the tramadol and just so the complex environment induced the change in migration time. According to the above phenomenon we suggest that tramadol stand in hunman serum not more than 24 hours. Determination of tramadol in serum by CEECL was still successes with the advantages of selectivity, sensitivity, reproducibility, simple for sample treatment.
5. Conclusion
In this paper, the end-column electrochemiluminescence detection with capillary electrophoresis has been used for the determination of TMD as a simple, fast, sensitive and selective method. A wide linear range for TMD with three orders of magnitude, and a detection limit of 0.03 μmol·L−1 were obtained. The proposed method has been triumphantly utilized to analyze TMD in practical sam
Table 2. Recovery of tramadol in urine and serum sam- ples. Conditions: detection voltage 1.20 V, buffer at pH 8.0, electrokinetic injection for 10 s at 10 kV, 5 mmol·L−1  in the detection cell.

(A)
(B)
Figure 9. Dependence of the ECL intensity on the time in volunteer (A) serum and volunteer (B) serum with tramadol solution. Conditions: detection voltage 1.2 V, buffer at pH 8.0, electrokinetic injection for 10 s at 10 kV, 5 mmol·L−1  in the detection cell.
ples and there was no interference, which proves that the proposed method is suitable for clinical analysis.
6. Acknowledgements
This project was supported by the Natural Science Foundation of Tianjin, China with Grant No. 08JCYBJC- 02800.
NOTES