Response of Peach, Plum and Almond to Water Restrictions Applied during Slowdown Periods of Fruit Growth ()
1. Introduction
In Morocco, fruit rosaceous area is more than 208,000 hectares from which 84% are rosaceous with pits where almond, plum and peach trees represent 85%, 5% and 3% respectively. Production of these three species in the last three years ranged between 227,000 and 257,000 t/year [1]. The great variability in production is due to the occurrence of stressful climatic factors such as frost and drought [2,3]. These species, in particular almond, have known a real development during the last years thanks to efforts of the government (promotion of hydro-agricultural investments, distribution of plants, subsidies) and private initiatives [4].
Reduction of water resources and constant increase of water requirements in agriculture, due to the competition with the other sectors, such as industry and drinking water [5], have lead to the concern of water savings. Therefore, it is necessary to develop techniques for improving plant-water use efficiency, especially for more water requiring species, like the majority of rosaceous trees [6,7], especially in regions where drought events are frequent, such as the case of Morocco [8]. This can be achieved through the effective management of irrigation, which consumes in Morocco 80 at 90% of available water resources [9].
Regulated deficit irrigation (RDI) is commonly used in fruit trees to reduce the amount of irrigation water applied without—or with only very small—reductions in yield [10]. RDI imposes a period of water stress that is controlled in terms of its intensity and the period of application [11]. This period corresponds generally to slow phases of fruit growth where a tree is relatively most tolerant to water deficit [12]. In almond tree, this phase occurs during Stages II and III of fruit development. However, in peach and plum trees, it is situated during stage II only [13].
RDI, if imposed judiciously, minimizes water use, decreases vegetative growth and pruning cost, and may improve fruit quality [14]. Studies of RDI in rosaceous trees remains very limited under Moroccan conditions. The adoption of the findings obtained in similar experiments conducted in other countries [15-17] is not justified because the results are not conclusive, probably, because of different experimental conditions and used genotype. The studies on RDI are specific to a particular ecosystem. It must consider the productions levels and their stability, physiological behavior of trees and fruits quality. For these reasons the aim of this paper was to test various levels of water stress applied during slowdown periods of fruit growth of mature peach, plum and almond trees. The evaluation of trees response was based on measurement of yield, fruits quality, biometrics characteristics of fruits and vegetative growth.
2. Materials and Methods
2.1. Experimental Design
The experiment was carried out during four consecutive seasons (2007-2011) in the Taoujdate experiment station of the National Institute of Agronomic Research (INRA) located 40 km North of Meknes city in Morocco at 33˚56'E, 5˚13'N; 499 m. Meteorological data of the site are presented in Figure 1 where it is shown that rainfall deficit is more marked between May and September with a peak in July and August. The soil is sandy clay with an average of 3% CaCO3, rich in organic matter, with an average of 2.51% in the top soil surface layer (0 - 30 cm). The soil pH is slightly alkaline (7.7), the soil is not saline (average EC around 0.07 ms·cm−1 in the top 60 cm).

Figure 1. Monthly rainfall in 2010-2011 and Hargreaves evapotranspiration calculated using data for 11 last years from meteorological station in field.
For each species, peach (Prunus Persica, cv, JH-Hall), plum (Prunus Domestica, cv, Stanley) and almond (Prunus Dulcis, cv, Tuono), planted in 2004 in parallel lines spaced by 5 × 3 m, 15 trees were used: The trees were trimmed as goblet canopy shape. During the experiment, all the trees of each species were pruned, fertilized and managed similarly, except for irrigation where different water levels were applied.
Crop evapotranspiration (ETc) was estimated as the product of reference evapotranspiration (ETo) obtained with the Hargreaves model [18] and the crop coefficients recommended by FAO adjusted to planting density and foliage dimensions using a reduction coefficient (Kr) recommended for almond tree: Kr = π D2N/20000 where “D” is the average of foliage diameters and “N” is planting density [19]. ETo was determined using climate data of the last eleven years, collected from the INRA meteorological station located in the experimental field.
The irrigation treatments were applied during four consecutive seasons (2007-2011) at slowdown period of fruit growth for each species by supplying different fractions of crop water requirements (ETc). This period was determined for each species under full-irrigation (100% ET0) by weekly in situ measurement of fruits diameter, on six fruiting branches, from fruit set to fruit maturity during three seasons (2007-2010). In parallel, shoots elongation was measured per linear meter on the same fruiting branches to provide explanations of results, especially for vegetative growth. In the fourth season (2010- 2011), two irrigation treatments, 50% ETc (T50) and 75% ETc (T75) were compared to 100% ETc (T100), imposed during slowdown period of fruit-growth for each species. Irrigation water was applied daily using drip system with two emitters per plant. Water quantity was regulated by watering duration.
For each species, the experimental design was a randomized complete block, with three replications. Each of the three block consisted of five trees. The three central trees of each block were selected for application of water treatments, while the surrounding trees were considered as “guard tree” borders.
2.2. Measurements
Generally, response of adult trees to regulated deficit irrigation is not detected in the first year, but it appears after a few years, because of reserves mobilized in wood and large volume explored by roots [20,21]. For this reason, different parameters describing these effects were measured during the fourth season of stress, in 2010- 2011.
2.2.1. Vegetative Growth and Physiological Measurements
Effect of the applied water stress to vegetative growth was evaluated by measurement of annual shoot elongation and leaf area in early November. Average of annual shoot elongation was estimated on all shoots worn by four fruiting two-year-old branches per replication (twelve branches per treatment) chosen at the same height in four sides of trees. Shoot length was reported in linear meter of fruiting branches for eliminate variability that may due to their vigor. Leaf area was measured on all leaves cut without petioles from ten shoots with almost the same length selected randomly per replication. After cutting, leaves were placed in plastic bags and were transported immediately to the laboratory. The area of each leaf was measured using a leaf area meter (adc, bioscientific Ltd) calibrated to 0.01 cm2.
Leaf temperature and chlorophyll content index were measured weekly, in the morning at 11 h, from the beginning of water treatments to harvest on six marked leaves per replication for each species, using an infrared thermometer and SPAD chlorophyll-meter. The leaves were selected on shoots exposed to the north and having approximately equal lengths.
2.2.2. Biometric Parameters of Fruit and Yield
At fruit maturity of each species, samples of fruits, approximately 3 kg each, were collected from randomly ten selected fruiting branches per replication to evaluate the following parameters: fruit and pit weight, fruit and pit dimensions (length and width). This method of sampling fruits takes into consideration the variability of fruit size in a tree. After sampling fruits, each tree was manually harvested and weighed in the field. For eliminating the differences in yield due to variability of tree vigor, yield values were determined per cm2 of trunk section area estimated by measuring trunk-circumference.
2.2.3. Fruit Quality Measurements
Effect of the water treatments on fruit quality was evaluated for peach and plum by measurements of sugar content, acidity, pH and water content. While for almond kernel, it was assessed by measurement of number and relief of epidermal wrinkles. All the parameters were measured on ten mature fruits per replication.
On pulp of peach and plum, sugar content was determined in drops of fruit juice by measurements of refractometric index (˚Brix) using a refractometer. Acidity was determined by titration of free acids and measurements of pH following methods reported by Lichou [22]. Indeed, 5 g of pulp is mixed in 50 ml of distilled water and titrated by sodium hydroxide 0.1 N under continuous agitation until the pH value reached 8.1. Thus, acidity (Ac) is given by the relationship: Ac = V × C × 100/m where “V” is the volume of sodium hydroxide used in ml, “C” is the concentration of sodium hydroxide in mol·l−1 and “m” is the mass of fresh pulp dosed in g. Whereas pulp pH was determined directly by soaking the pH-meter electrode in crushed pulp. Water content was measured by drying fruits pulp at 80˚C during 48 h. On almond kernels, epidermal wrinkles were counted visually and their relief has been evaluated by awarding points from 0 to 5.
2.2.4. Statistical Analysis
Data were analyzed by analysis of variance (ANOVA) using the SPSS software (version 17.0). Mean comparisons were performed using Dunett’s test to compare deficit irrigation to full irrigation and student’s test to compare between T50 and T75.
3. Results and Discussion
3.1. Slow Growth Periods
In peach and plum trees, fruit-growth slowdown corresponds to pit hardening stage (stage II). However in almond tree, it included pit hardening and final stage of fruit growth (stages II and III) [23]. Based on monitoring of fruit diameter, this period is located at different periods in the three species (Figure 2). In almond tree, fruitgrowth slowdown was observed during four months, from April 30 to harvest in September 04. In peach tree, fruit-growth slowdown was recorded during two weeks only, between May 25 and June 10. While in plum tree, fruit-growth slowdown was observed during five weeks, from May 25 to July 01. During the slowdown periods, outer dimensions of the fruit change little, increasing significantly by different magnitudes depending to species. Indeed during these periods, fruit diameter was increased under full irrigation T100 by 26% for peach, 12% for plum and 8% for almond, equivalent respectively to a daily growth of 1.73%·d−1, 0.34%·d−1 and 0.06%·d−1.
Shoot growth began when fruit diameter reached 17% for almond, 27% for peach and 13% for plum. This fruit production came from floral receptacle and previous reserves of trees. During slowdown period of fruit growth, shoot growth is however rapid. During this period, shoot grows by around 133%, 46% and 88% under full irrigation T100 respectively in peach, plum and almond. Slowdown period of shoot growth began after two weeks of pit hardening stage in the three species. At this date, fruit diameter reached 92% for peach, 85% for plum and 99% for almond.
Based on duration of slowdown period of fruit growth, it appears clear that application of RDI during these periods seems more economically important for almond and plum. However for peach, two weeks of saving water seems insufficient period to generate a considerable economic impact. The impact would be important using later varieties, for which kernel hardens during a longer period [24]. Fruit growth rate during slowdown periods

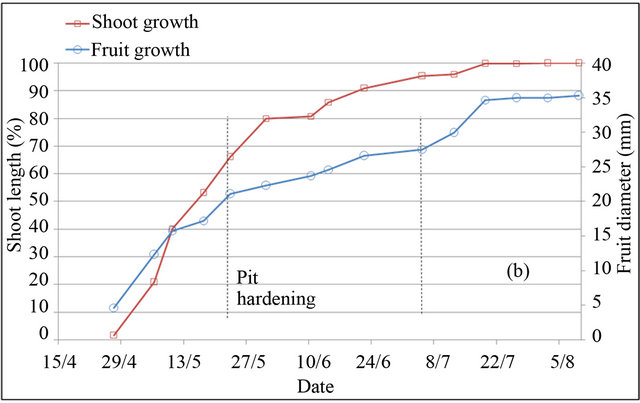
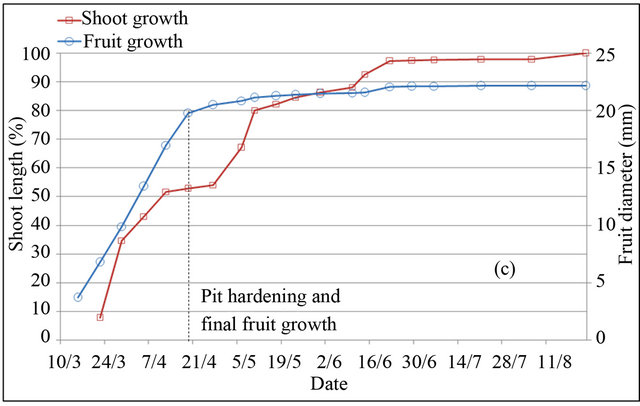
Figure 2. Shoot and fruit growth for peach (a), plum (b) and almond (c) under full irrigation (T100).
may indicate the percentage of fruit weight on which act water restrictions, showing that peach remains the most sensitive fruit, followed by plum and almond, whose around quarter of fruit size is determined during this period. The coincidence of slow fruit growth with rapid shoot growth makes that the RDI strategy in experimenttation may be used to control excessive vegetative growth of trees. This finding has been concluded by other authors [15].
3.2. Shoot Length and Leaf Area
Shoot growth of all tested species was very affected by RDI treatments (Table 1). The differences between values of final shoot length under RDI treatments and those obtained under treatment T100 showed that the applied water stress had a more pronounced effect on almond, followed by plum and then by peach. Based on Student’s test for each species, the two RDI treatments reduced shoot length by the same magnitude, by an average of 63%, 45% and 42% respectively in almond, plum and peach. However, Dunett’s test revealed that the effect is significantly more pronounced under treatment T50 in peach and plum trees for which shoot length was reduced in comparison to treatment T75 respectively by 19% and 7%. For leaf area, although its values decreased under the applied water stress, the effect was not significant.
Therefore, it is clear that moderate water stress applied during the slowdown period of fruit growth restricts shoots growth. This finding is important because it means that water stress applied under these conditions will limit effects of competition exerted by shoot growth against fruit growth. The effect observed does not corroborate with those obtained by other authors, it appears that RDI effect on shoot elongation varies with climatic conditions and used cultivar. In Spain, it is found that shoot length in peach cv. Sudanell under water treatment similar to T50 does not exceed 25% [15]. In Italy, there was no significant effect of RDI applied during stage II of plum development, cv. Fortune, on shoot growth [25]. However, limitation of shoot growth does not significantly affect leaf area. RDI effect on leaf growth is compensated by reduction of shoot length implicitly reducing their number.
Shoot growth reduction is an adaptive mechanism which reduces tree transpiration [26]. It results from several reversible mechanisms such as decrease of cell division speed [27], rigidity of cellular wall limiting cell growth [28] and decrease of cell turgor [29]. However, there is a consensus that reduction of vegetative growth is not a passive consequence of water deficiency in cells, but is rather controlled by trees [30]. It emerges that shoot growth reduction does not necessarily imply a water stress in cells.
Table 1. Shoot length and leaf area under different irrigation treatments.

Lm: linear meter; **: Significant difference at 99% using Dunett’s test in comparison to treatment “T100”; *: Significant difference at 95% using Dunett’s test in comparison to treatment “T100”.
3.3. Chlorophyll Content
Chlorophyll content is an important indicator to assess the effect of water stress on the physiological behavior of trees because of its role in solar energy absorption which is necessary for photosynthesis [31]. Chlorophyll concentration index measured using the chlorophyll meter indicated that there were significant differences in variation of chlorophyll content, induced by water restrictions. After the application of water restrictions, chlorophyll content decreased very much for all species and began to increase to reach the initial values at the end of water restrictions for peach and before this date for plum and almond (Figure 3). The decrease of chlorophyll content was more pronounced under treatment T50 whose effect was extended to stage III of fruit growth.
Certainly, reduction of chlorophyll content under water stress conditions is related to decrease in assimilation and translocation of nitrogen [32]. Indeed, water deficit induced a nitrogen deficit which comes mainly from reductions in nitrogen flow at the roots, and secondarily


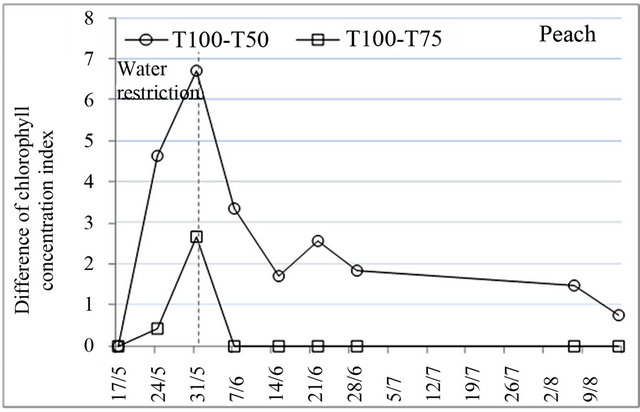
Figure 3. Effect of water restrictions on chlorophyll concentration index for peach, plum and almond.
from capacity reductions of root absorption and reduction of transport between leaves and roots due to transpiration feebleness [30].
3.4. Leaf Temperature and Stress Degree Day
Leaf temperature features prominently among biophysical parameters commonly used to evaluate plant water status [33]. Water restrictions increased significantly leaf temperature for all species during and even after their application. For peach, the average of increase was 3.2˚C under treatment T50 and 2.1˚C under treatment T75, while for plum and almond, the applied water restrictions increased leaf temperature with the same magnitude of 2.2˚C (Table 2). Therefore, it is clear that the water deficit is associated with thermal stress because of reductions in transpiration.
The linear relationship between leaf temperature and air temperature was also influenced by water restrictions. Under full irrigation T100, the relationship between the two temperatures is not significant, but under the water restrictions the correlation coefficient changes to significant values. This same finding was obtained by Helyes et al. in haricot [34]. In fact, under full irrigation, the leaf temperature was not very influenced by air temperature because of importance of steam water in leaves surface. However, under water restriction, transpiration and steam water in leaves surface weakened and make accordingly leaves more exposed to air temperature changes.
Stress degree day values (SDD), corresponding to the difference between leaf temperature and air temperature, showed that in some days under water stress, particularly where air temperature was relatively high, steam water of transpiration was unable to cool leaf surface making leaf temperature exceeded air temperature. Accumulated SDD values at harvest were high and significant for all species under the two tested water restrictions. Particularly for peach, where fruit yield was affected by treatment T50, it was estimated that a 1˚C higher SDD value might cause 105.4 kg·ha−1 yield losses. However, for plum and almond, SDD values variation did not have a significant effect on fruit yield.
Figure 4 shows the evolution of accumulated SDD values from the beginning of water restrictions to harvest. The curves obtained indicate that the effect of water stress started during the first week of its application; but, it increased rapidly after one week for peach and after three weeks for plum and almond even during the period following the end of water restrictions.