Nanoscale Track Diameter and Hydrogen Yield: Dependence upon Charge State of Incident Ion on Polystyrene ()
1. Introduction
When the charged particles like electrons, heavy ions or radiations like γ rays with sufficient energy (MeV’s energy) pass through a solid, they transfer their energy, mainly through electronic ionization and excitation, of the constituent atoms and molecules [1]. In non-conducting polymeric materials, part of this deposited energy causes chemical breakdown leading to the ejection of various atomic, molecular or gaseous species from the material [2]. As a result, localized regions of extensive chemical and structural transformations due to radiation damage are formed along the ion paths. This causes creation of a so called ion track (a nanometric size cylindrical amorphized zone) [3,5,6] corresponding to each incident ion. The ion-tracks may be used to modify material properties in the nanometer to micrometer scale.
In the recent years various experimental techniques have progressed for the characterization of this nano scale region of very high energy deposition created by energetic ion beams [3-6]. Steckenreiter et al. [3] studied the MeV Kr and Mo ion induced modifications in polyethylene terephthalate (PET) and deduced the ion track radius by considering the Fourier transform infra red absorbance measurements. Apel et al. [4] predicted the ion track dimensions in 1 - 11.6 MeV/u 238U irradiated PET using a controlled track etch technique. The use of surface microscopy tools [5] is another contemporary technique for the visualization of the nanoscale modified zone. Partial pressure studies of various gasses emitted from 180 MeV Ag ion irradiated PET using quadrapole mass analyzer also revealed the ion track radii with good accuracy [6].
Mittal et al. [7] showed the possibility of analyzing ion track dimensions by monitoring hydrogen ion yield from the nanosize cylindrical zones. The yield of H+ was found to vary as q~3 following the bombardment by 0.5 MeV/u ions from 127I to 205Tl on a C target [8]. Similarly when 0.5 to 1.5 MeV/u ions from 32S to 127I were bombarded on C and Au foils [9] under poor vacuum conditions or presumably due to absorbed water deposited on the surface, the yield of H+ was found to vary as q~3. A q@3 dependence of the H+ ion yield from C target after low energy 116 keV 208Tl ions bombardment was observed by Brunelle et al. [10]. The yield of molecular species were also found to vary as q3–4 when samples such as phenylalanine, coronene etc. were bombarded with swift heavy ions [11,12]. Similarly when polypropylene (PP) and PET were bombarded with 130 MeV 107Ag ions, the yield dependence of hydrogen was found to vary as q2.98 for the PP and q1.94 for the PET [13]. Bitensky et al. [14] developed a model based on Coulomb explosion of the microscopic charge domain around the point of primary ion impact and predicted a q3 dependence of the H ion yield. The energy and angular distribution of the ejected ions from MeV 127Iq+ (q = 17 − 32) impacted Au and C foils have been studied by Most et al. [15,16] on the basis of Monte Carlo calculations. A slight increase in the mean energies and emission angle with the charge state was reported. However, they did not report any functional dependence of the hydrogen ion yield on the charge state of the incident ion. Using a perturbbative convolution approximation, based upon the first order perturbation theory formulated using Bloch’s stopping power results and a simple scaling law, Schiwietz and Grande [17,18] have been able to show that the stopping power depends on the charge state of the incident ion.
Polystyrene is a macromolecular plastic material. It is a vinyl polymer consisting of a long hydrocarbon chain, with a phenyl group attached to every other carbon atom. It is hard and used for packaging, foam insulation, appliances, housewares, toys etc.
Saturated core model was proposed by Davenas et al. [19] which showed exponential decrease of hydrogen yield from PS when irradiated with 700 KeV He+. In particular PS suffers mainly cross-linking, formation carbon clusters along the region of energy deposition by incident ions [5,20,21].
The objective of this work was to monitor hydrogen evolved from polystyrene due to the fast heavy ion irradiation in order to obtain information on ion-polymer interaction. The radii of the damaged zones or so called ion tracks formed in it have also been analyzed as a function of the charge state of the incident ion from the hydrogen depletion data.
2. Experimental Arrangements
In this recent investigation the Irradiation facilities at the Inter University Accelerator Centre, New Delhi were used. Thin foils of PS having thicknesses between 6 - 20 µm were bombarded with ion beams of 107Ag of charge states 11+, 14+ and 25+ and of energy 130 MeV from a 15UD Pelletron [22] at room temperature. The beam currents in all the experiments were kept at »1 particle nano-ampere to prevent the degradation of the target due to the heating effects. The area scanned by the incident beam on the polymer surface was about 0.09 cm2 and the tilt angle of the target with respect to the beam direction was at 15˚. During irradiation the hydrogen recoils from the films were detected in a silicon surface barrier detector having a depletion depth of 1 mm kept at 45˚ with respect to the beam direction. The energy resolution of the silicon surface barrier detector used was about 30 keV for 5.48 MeV α-particles. Heavier elements, molecules and radicals emitted during the ion irradiation were stopped with the help of a polypropylene film of thickness 26 µm kept before the detector. Further experimenttal details can be found in our earlier work [7,13].
3. Results
When the ion beam impinges on the PS surface, ejection of hydrogen starts. Figure 1 shows two characteristic hydrogen recoil spectra at the fluence of 1.62 × 10¹³ ions/cm2 (lower curve) and 2.47 × 10¹¹ ions/cm2 (upper curve) for 107Ag of charge state 11+ on PS. The hydrogen evolving from a depth of 10 - 100 nm is shown as a function of ion fluence for different charge states for PS in Figure 2. For comparison, curves are shown in Figure 3 from a depth of 1000 to 1500 nm. In this figure these curves were almost overlapping, so the H loss curve corresponding to 11+ charge state was multiplied by 4 while the curve corresponding to charge state 25+ is divided by 4 for the present figure.
The hydrogen areal density as a function of ion fluence (Figure 2) was fitted using two equations [7] in two different regimes
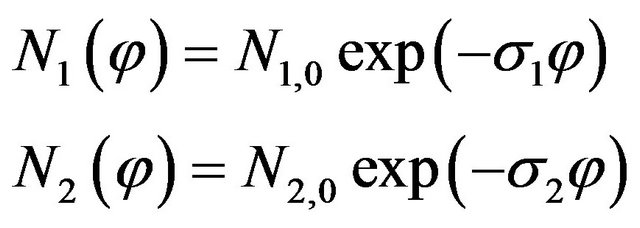
Where φ (cm−2) is the ion fluence, σ1 and σ2 are the hydrogen depletion cross-sections in cm2 and N1,0 and N2,0 are constants. This fitting is shown in Figure 2 as solid lines. Here it is understood that the hydrogen emanation takes place from a cylindrical damage zone [2]. It is also important to notice that at some ion fluence the hydrogen emanation diminishes. This can be attributed to the overlapping of the damage zones which starts at this ion fluence. The nature of hydrogen loss curves then changes resulting in a curve of different slope. This is because of the fact that the whole ion beam exposed region was modified due to hydrogen loss and ion beam induced modifications. The intersection of the two lines (as shown in Figure 2) represents the approximate fluence corresponding to which an overlap [6,7] of ion damage zones takes place. The values of σ1, N1,0, σ2 and N2,0 as a function of incident ion charge state determined in the present experiment are listed in Table 1.
3.1. Hydrogen Depletion per Incident Ion
The average amount of hydrogen depleted per incident

Figure 1. Hydrogen depletion spectra at the fluence of 2.47 × 10¹¹ ions/cm2 (upper cfurve) and 1.61 × 10¹³ ions/cm2 (lower curve) for 130 MeV 107Ag11+ on PS. The zero depth is at ~600 channels and 1 channel corresponds to ~3.1 nm.

Figure 2. Hydrogen areal concentration (in at/cm2) up to a depth of ~100 nm versus fluence for 11+, 14+ and 25+107Ag ions of 130 MeV energy bombarded on PS.

Figure 3. Hydrogen areal concentration (in at/cm2) from a depth of 1000 to 1500 nm versus fluence for 11+, 14+ and 25+ 107Ag ions of 130 MeV energy bombarded on PS. The 11+ curve is multiplied by 4 while the curve corresponding to charge state 25+ is divided by 4.
Table 1. Hydrogen emission cross sections σ1 and σ2; hydrogen concentrations N1,0, and N2,0 measured in the present work for PS.

ion can be calculated by multiplying hydrogen emission cross-section σ1 with the hydrogen concentration N1,0 [6]. These values were calculated for different charge states and are also given in Table 2. The hydrogen released as a function of charge state of the incident ion is shown in Figure 4.
3.2. Track Radius
The radius of the effective damaged zone or the ion track was calculated from the hydrogen depletion cross-sections σ1 using the relation reported earlier [7].

The ion track radii (in nanometers) calculated for PS bombarded with 130 MeV 107Ag ions of different charge states are given in Table 2 and are also shown in Figure 5. As is evident from Table 2, the track radii varied between ~3.2 nm and ~6.8 nm.
4. Discussions
The hydrogen depletion vs. fluence curves for two different depth ranges are shown in Figures 2 and 3. It is evident from Figsures 2 and 3 that when an ion of a particular charge state is incident upon the surface of PS its charge state equilibrates [23,24] in the near surface region (say up to ~10 - 20 nm). Since the resolution of hydrogen profiling in the present experiment was about 50 nm, therefore, we should see this difference near the surface region only. It is expected that if we take the hydrogen counts from up to a depth of, say 100 nm, we could observe the effect due to charge state of the incident ion as is evident from Figure 2, where we have taken the hydrogen ions coming up to a depth of 10 - 100 nm. In contrast the yield of hydrogen become independent of the charge state of the incident ion if we consider the hydrogen ions coming from within a depth of about 1000 to 1500 nm as shown in Figure 3.
It is also obvious from Figures 4 and 5 that emission of hydrogen as well as track radii depend strongly upon the charge state of the incident ion. This behavior is in accordance with the results reported earlier by Schiwietz and Grande [17,18] that the electronic stopping power depends upon the charge state of the incident ion. The
Table 2. Hydrogen emission per incident ion and track radius calculated for different charge states of 130 MeV 107Ag ions on PS. 4th and 6th column of this table show the fitted equations for hydrogen released/incident ion and track radius calculated for different charge states respectively.

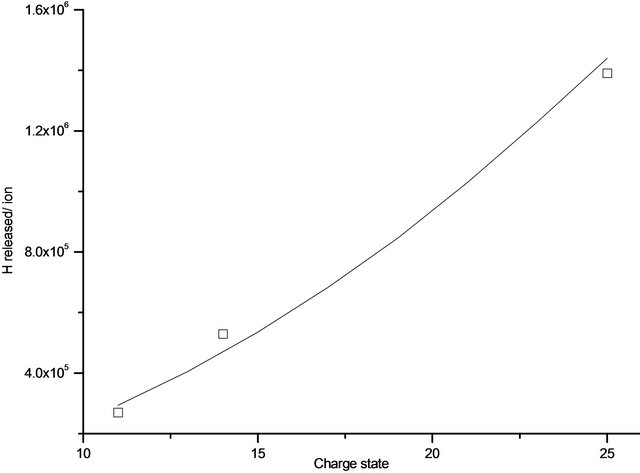
Figure 4. Hydrogen depletion (evolving from a depth of 10 - 100 nm) per incident ion as a function of charge state of the incident ion for PS.
hydrogen depletion per incident ion in the present irradiation of PS with 130 MeV 107Ag ions of different charge states were fitted with an equation of the type y = αqn (Figure 4), where q is the charge on the incident ion. The value of the exponent n is found to be ~2.1 whereas Wien et al. [12] reported this value as 2.7. Therefore, we may conclude that the charge state of the projectile incident at the surface of PS strongly influences ionization of hydrogen due to different electronic stopping power [17, 18] but the force driving desorption of the hydrogen ions was less q-dependent as compared to the predictions of Coulomb explosion model [14]. Halhammer et al. [25] also reported the charge state dependence of projectiles guiding through nanocapillaries in PET.
If we compare the value of exponent n = 2.1 from the present worked out problem to that reported earlier n = 2.98 for PP (13) we can easily conclude that the chances of hydrogen depletion are less from CH2 bonds. Fujimoto et al. [26] suggested that the hydrogen released as H+ from CH or CH2 may recombine with dangling carbon bonds. The rate of hydrogen depletion, from polymers like PP, where CH3 type bonds are present, is therefore, higher in comparison to PS.
It is also evident from Table 2 that the radii of ion tracks formed in PS depend upon the charge state of the incident ion. When the charge state of the incident ion was doubled aproximately (from 11 to 25), the radius of the ion track also increased by a factor of 2. The ion track radii calculated for the different charge states were fitted with an equation of the type r = βqm (Figure 5), where q is the charge of incident ion and the exponent m was found to be 0.9. The radii of ion tracks formed in different ion-polymer combinations as reported by different workers along with present measurements are shown in Table 3. It is evident from this table that our measurements are comparable with the values reported in literature.
5. Conclusion
Monitoring of excitation products like hydrogen from

Figure 5. Track radii as a function of charge state of the incident ion for PS.
Table 3. Ion track radii based upon hydrogen emission during irradiation of polymers as measured in the present investigation along with the values reported previously.

fast heavy ion irradiated polymers is an important tool to probe track dimensions. The hydrogen depletion rate from heavy ion irradiated polymers decreases after certain ion fluence when the overlapping of the ion tracks starts and the hydrogen depletion curves tend to flatten at this ion fluence. The removal of hydrogen when 107Ag ions are bombarded on polystyrene is influenced strongly by the charge state of the incident ions. It varies as qn, where n is 2.1 as compared to n = 2.98, reported earlier for PP. This is a clear Indicative that hydrogen evolution is C-H bond type dependent as the polymer PP contains CH3 type bonds in comparison to -C-Hand -CH2- type bons of PS. The rate of hydrogen loss is less from PS. The radii of damaged zones also depend upon the charge state of the incident ion and were found to vary as qm, m being 0.9.
6. Acknowledgements
The authors are grateful to the Director and Pelletron machine staff at the IUAC, New Delhi for providing the required facilities for this study. They are also thankful to Fouran Singh for providing valuable help at various stages of this experiment. One of the authors DPG expresses his thanks to Dr. (Mrs.) Madhu Chitkara for her constant motivation and encouragement.