Effects of three controlled mechanical ventilation modes on rat lung hydrogen peroxide and apoptosis during hemorrhagic shock ()
1. INTRODUCTION
Major blood loss leads to hemorrhagic shock (HS) and is one of the leading causes of death. The impact of HS depends on the amount and rate of blood loss. Vital organs (e.g. the lungs) are subject to hypoxic injury because of hypoperfusion. The activation of specific inflammatory signalling pathways due to hypoxia induces acute lung injury during HS [1]. Inflammation causes emigration of polymorphonuclear leukocytes through the alveolar capillary beds contributing to pulmonary edema [2]. In HS, hypoperfusion leads to oxidative stress resulting in increased reactive oxygen species (ROS) [3]. Superoxide is formed, which is reduced to hydrogen peroxide (H2O2) and then undergoes reduction to the hydroxyl free radical. This radical directly and indirectly damages lipids, proteins, and deoxyribonucleic acid (DNA), leading to apoptosis.
Intensive airway management is a high priority in the care of HS patients, resulting in approximately 20% of the patients being placed on mechanical ventilation. Adequate gas exchange with low hemodynamic impairment and organ damage is the goal of ventilator support. However, mechanical ventilation alone can lead to an increase of inflammatory mediators, resulting in lung injury [4,5]. Thus, mechanical ventilation in the presence of HS can potentiate the risk of acquiring acute lung injury [6].
There are differing opinions on what is the most effective controlled mode of mechanical ventilation for various lung pathologies [7]. In HS, various modes of mechanical ventilation are used, such as volume control (VC), pressure control (PC), and pressure regulated volume control (PRVC). There are studies demonstrating ventilator induced lung injury (VILI) [8] and ventilator induced apoptosis [9,10]. In VC, the tidal volume is maintained constant. If lung compliance decreases, alveolar pressures will increase leading to possible lung damage. With PC ventilation, peak inspiratory pressure (PIP) is maintained constant. A decrease in lung compliance will result in a decreased tidal volume and possibly lung damage attributable to regional hypoxia. With PRVC, changes in lung compliance trigger the ventilator to change PIP and maintain tidal volume relatively constant. In this study using rats, we investigated three modes of controlled mechanical ventilation: VC, PC and PRVC during HS. The purpose of the study was to determine the relative effects of VC, PC and PRVC mechanical ventilation with equal PIP, tidal volume, respiratory rate (RR), and intrathoracic pressure (ITP) on lung injury as measured by lung H2O2 and percent apoptosis during HS.
2. MATERIAL AND METHODS
2.1. Experimental Design and Protocol
Ten-fourteen week old male Sprague-Dawley rats (Harlan, USA) with a mean weight of 360 g were used in these experiments. The rats were ordered in lots of six and allowed to acclimate for 48 hours. This study was an experimental design in which rats were randomly assigned to receive one of the three modes of mechanical ventilation using a Servo Ventilator 300 (Siemens, USA) with a fractional inspired oxygen (O2) at 40%. This study was approved by the Institutional Animal Care and Use Committee at the University of Kansas Medical Center.
The independent variables for these experiments were the controlled modes of mechanical ventilation: VC, PC, and PRVC. The dependent variables were lung H2O2 and apoptosis. Systolic blood pressure (SBP), diastolic blood pressure (DBP), mean arterial blood pressure (MAP), heart rate (HR), arterial blood values (ABV), PIP, tidal volume, RR, and ITP were recorded during the experiment. An I-STAT instrument was used to obtain ABV measurements including pH, partial pressure of O2 (PaO2), partial pressure of carbon dioxide (PaCO2), O2 saturation (SaO2), hematocrit (Hct), and hemoglobin (Hgb). Arterial blood pressures, HR, RR, and ITP were measured using a pressure transducer (Harvard Apparatus-Holliston, MA). Occlusion tests were randomly performed to determine ITP adequacy. Peak inspiratory pressure and tidal volume measurements were obtained from the ventilator. The body temperature was maintained at 37˚C ± 2˚C with a homeothermic blanket system.
2.2. In-Vivo Experiments
The rats were anesthetized with an intraperitoneal injection of sodium pentobarbital (50 mg/kg body weight). Random toe nail pinches were conducted to assure a surgical plane of anesthesia throughout the experiment. To reduce respiratory secretions, the rats received an intraperitoneal injection of atropine (0.04 mg/100g body weight). After ensuring the rats were under a surgical plane of anesthesia, a tracheostomy was performed using polyethylene (PE) 240 tubing. The carotid and femoral arteries were cannulated with a PE 50 catheter and used for monitoring hemodynamics and withdrawing blood to elicit HS, respectively. A PE 50 catheter was inserted into the esophagus for measuring pressures, as an index of ITPs.
Hemorrhagic shock was elicited by removing approximately 40% of the total blood volume over 30 minutes (min). Hemodynamics, ABVs, and ITP values were obtained before HS with the rats breathing room air (baseline) and at 30 min HS. One of the three modes (VC, PC, or PRVC) was started using 40% O2 and 60% nitrogen. The ventilator parameters were set at: PIP = 8 cm H2O, positive end-expiratory pressure (PEEP) = 1 cm H2O, and ventilation rate = 80 breaths/min. The inspired tidal volume was set at 4.0 mL, resulting in a minute volume of approximately 320 mL/min. The PIP in the PC mode was determined based on the average of PIP throughout the experiments with VC mode. In a previous HS study, lung H2O2 and apoptosis were lowest in rats spontaneously breathing 40% O2 than in rats breathing room air, 60%, or 100% [11]. Fluid resuscitation was not administered during the 60 min of mechanical ventilation to circumvent the complications of reperfusion injury. In addition, this enabled us to compare the effects of mechanical ventilation on H2O2 and apoptosis to our previous study using the same experimental protocol but without mechanical ventilation. The occurrence of spontaneous breathing activity was monitored by a constant measurement of ITP; this also assured the rat was under proper anesthesia. The experiment was terminated by euthanizing the rats with sodium pentobarbital (150 mg/kg body weight), followed by rapid removal of the lungs for H2O2 and apoptosis determination.
2.3. Hydrogen Peroxide Measurements
Lung H2O2 was measured as an index of ROS. Small segments of the rinsed lung were mounted in a paraffin dish that contained a solution of 100 mL diluted (0.8%) dimethyl sulfoxide and 2.1 mg of dihydrofluorescein diacetate (Hfluor-DA) (50 µM) (Molecular Probes - Eugene, OR) at room temperature for 30 min. The pH of the solution was 7.8. The tissue was rinsed for 10 min using phosphate buffer solution (PBS). Hfluor-DA permeates the cells and the oxidized unesterified form reacts with H2O2 converting Hfluor-DA to Fluor, resulting in dye fluorescing. Thus, this method provides an index of H2O2 resulting from superoxide formation and the subsequent production of hydroxyl radical [11].
The lung segments were stretched, mounted on slides, and measured for H2O2 using a laser scanning cytometer (Model IX71, CompuCyte Corporation-Westwood, MA) that detected fluorescence expressed as 106 with a detection limit of 1 µM H2O2. Excitation wavelength was 488 nm and emission wavelength 529 nm. The signals were digitized and an image was created on a pixel-by-pixel basis. In general, three lung segments were prepared and the average fluorescence determined for each experiment. Three 1 mm2 areas were randomly selected from the central region of each lung segment and the emissions resulting from multiple excitations were collected by the photomultiplier tubes. Within each area, 95 fields were scanned and within each field the fluorescence from 1000 excitation-emissions was summated. An average fluorescence of the three areas was obtained for each lung segment.
To correct for H2O2 formed during the preparation for analysis, fluorescence of sham lungs were subtracted from fluorescence of HS lungs. Sham lung fluorescence was determined using the same methods above, except the samples were taken immediately following anesthesia without blood withdrawal (n = 6).
2.4. Apoptosis Experiments
Lung damage attributed to free radicals was determined by measuring the extent of nuclear damage employing fluorescent dyes. Small segments of lung tissue were minced and homogenized in a Krebs solution containing antioxidants, trypsin, and collagenase. The solution was placed in a 37˚C water bath and vortexed every 5 min for 30 min. The supernatant was centrifuged at 6000 rpm for 30 min and the pellet resuspended in Krebs solution. 2 µL of ethidium bromide (EB) and acridine orange (AO) (Sigma-Aldrich, St. Louis, Missouri) were added and vortexed. An aliquot (20 µL) was placed on a microscope slide and imaged using fluorescent microscopy. Approximately 300 nuclei were captured, merged, and analyzed for color (hue) values using Boyce Scientific Analysis® software.
The EB and AO were used to determine apoptosis, using differential nuclear dye uptake and fluorescent microscopy. The emission/excitation wavelength for EB was 523/605 nm and 502/525 nm for AO. In undamaged nuclei, AO permeates the nuclear membrane and binds to DNA resulting in a green fluorescence. In contrast, EB permeates only damaged nuclear membrane and binds to DNA resulting in an orange fluorescence. The lung nuclei were classified as normal, apoptotic, or necrotic according to their color hue values. A normal undamaged nucleus would visually appear green color with a hue value between 90 and 120. An apoptotic nucleus would be orange color with a hue value ranging from 25 to 89. Any nuclei that appeared red color and had a hue value between 25 and 0 would be determined as necrotic. The percent of lung apoptotic nuclei were then calculated and reported. This method was described previously for quantifying nuclear DNA damage [12]. Figure 1 displays an image of undamaged (green) nuclei and damaged (orange) nuclei in the lung.
2.5. Statistical Analysis
Data are presented as mean ± SEM. One way analysis of variance (ANOVA) was used to determine the differences within the three groups at baseline, shock, and various time points during controlled mechanical ventilation. Treatment differences among the VC, PC, and PRVC mechanical ventilation modes were analyzed by one way ANOVA followed by post hoc test. Significance was defined as P < 0.05 with Bonferonni adjustment using SPSS software (Version 18 for Windows®; Chicago, IL).
3. RESULTS
3.1. Hemodynamic Measurement Data
The hemodynamic values at baseline, shock, 30 min, and 60 min treatment of the three modes of controlled mechanical ventilation are summarized in Table 1. Compared to baseline, there were significant decreases in all arterial blood pressure measurements within all three groups at shock, 30 min, and 60 min of controlled mechanical ventilation (P < 0.05), except for SBP at 60 min in the PC group. No significant changes in HR were observed within groups except for HR at 60 min in the VC group. There were no significant differences in hemodynamic values at baseline, shock, and 30 min of controlled mechanical ventilation among the groups with three exceptions. Compared to the PC group, DBP at 60 min for the VC and PRVC groups were significantly lower (P < 0.05). Mean arterial pressure at 60 min for the PRVC group was significantly lower than that of the PC group.
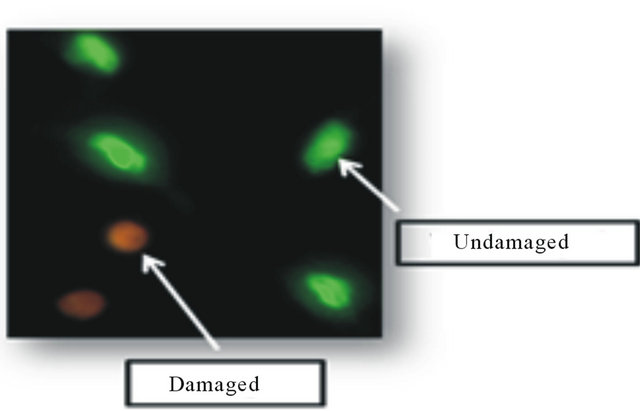
Figure 1. Lung nuclear fluorescence. This figure depicts undamaged (green) and damaged (orange) lung nuclei.
Table 1. Blood pressures and heart rates at baseline, hemorrhagic shock, and during 30 and 60 minutes of mechanical ventilation (an = 6, bn = 5).

Data are presented as mean ± SEM. VC, volume control; PC, pressure control; PRVC, pressure regulated volume control; SBP, systolic blood pressure (mmHg); DBP, diastolic blood pressure (mmHg); MAP, mean arterial pressure (mmHg); HR, heart rate (beats/min). †P < 0.05 in comparison with baseline; *P < 0.05 in comparison with VC; **P < 0.05 in comparison with PC.
3.2. Arterial Blood Values
Table 2 presents ABVs at baseline, shock, and 60 min of mechanical ventilation. There were no significant differences in pH at baseline, shock, and 60 min of mechanical ventilation within groups. PaCO2 at shock and 60 min with VC and at shock in the PRVC group were significantly lower, compared to baseline (P < 0.05). No significant differences in PaO2 were observed between baseline and shock within groups. However, PaO2 at 60 min treatment with controlled mechanical ventilation were significantly higher than baseline and shock. SaO2 were significantly higher at shock and 60 min treatment than baseline within groups except for SaO2 at shock in the VC group. With respect to baseline, there were significant decreases in Hct and Hgb at shock and 60 min
Table 2. Arterial blood values at baseline, hemorrhagic shock, and following 60 minutes of mechanical ventilation (an = 5, bn = 4).

Data are presented as mean ± SEM. VC, volume control; PC, pressure control; PRVC, pressure regulated volume control; pH, acidity; PaCO2, arterial carbon dioxide (mmHg); PaO2, arterial oxygen (mmHg); SaO2 %, oxygen saturation; Hct, hematocrit; Hgb, hemoglobin (g/100ml); †P < 0.05 in comparison with baseline; ‡P < 0.05 in comparison with shock.
treatment within groups. There were no significant differences in ABVs among the groups at baseline, shock, and 60 min treatment.
3.3. Peak Inspiratory Pressures, Tidal Volumes, and Respiratory Rates
Table 3 summarizes the PIP, tidal volumes, and RR at 1, 10, 20, 30, 40, 50, and 60 min of mechanical ventilation. Within groups, there were no significant differences in PIP, tidal volumes, and RR across all time points. Among groups, PIP at 40 and 60 min of PC were significantly lower than VC. Tidal volumes at 30, 40, and 50 min of PC were significantly lower than VC and PRVC (P < 0.05). There were no significant differences in RR among groups.
Table 3. Peak inspiratory pressures, tidal volumes, and respiratory rates during mechanical ventilation (an = 6, bn = 5).
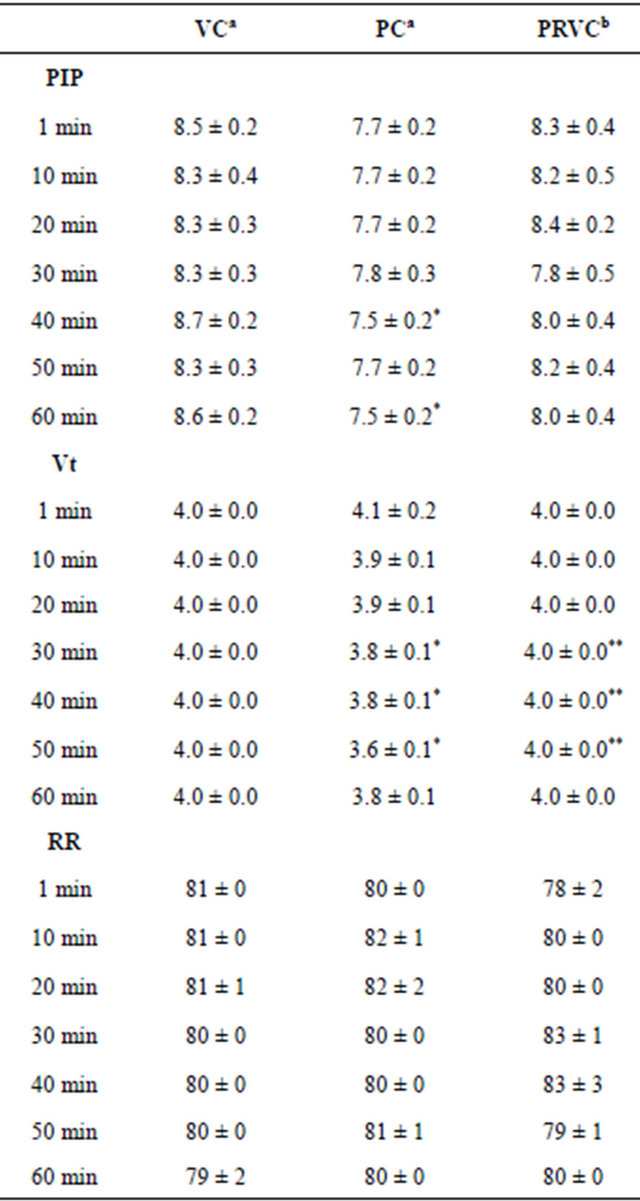
Data are presented as mean ± SEM. VC, volume control; PC, pressure control; PRVC, pressure regulated volume control; PIP, peak inspiratory pressure (cm H2O); Vt, tidal volume (mL); RR, respiratory rate (breaths/min); Min, minutes. *P < 0.05 in comparison with VC; **P < 0.05 in comparison with PC.
3.4. Intrathoracic Pressures
Table 4 summarizes ITP at baseline, shock, and during mechanical ventilation. Within groups, inspiratory ITPs during mechanical ventilation were significantly greater than baseline and shock (P < 0.05). There were no significant differences in expiratory ITP at baseline, shock, and during mechanical ventilation within groups. Statistical comparison among groups indicated no significant differences in inspiratory and expiratory ITP at baseline, shock, and during mechanical ventilation. It is noted that the ITP as measured by the esophageal catheter is less negative than intraplueral pressure. This is likely due to
Table 4. Intrathoracic pressures at baseline, hemorrhagic shock, and during mechanical ventilation (n = 6).

Esophageal pressure (cm H2O) was measured as intrathoracic pressure. Data are presented as mean ± SEM. VC, volume control; PC, pressure control; PRVC, pressure regulated volume control; Min, minutes. †P < 0.05 in comparison with baseline; ‡P < 0.05 in comparison with shock.
on-going esophageal smooth muscle activity, which increases esophageal luminal pressure. It seems unlikely that the degree of esophageal smooth muscle activity would differ among the three modes of mechanical ventilation.
3.5. Lung Hydrogen Peroxide
Lung H2O2 concentration was directly proportional to the percent fluorescent intensity. Lung fluorescent intensity results expressed as 106 were 1.84 ± 0.14 for the VC group, 1.11 ± 0.04 for the PC group, and 0.36 ± 0.07 for the PRVC group (Figure 2). The differences in lung H2O2 measured by fluorescent intensity among the groups were statistically significant (P < 0.05). The VC group lung H2O2 was 66% greater than the PC group and 5 times greater than the PRVC group. The PC group lung H2O2 was 67% higher than the PRVC group.
3.6. Lung Apoptosis
Figure 3 illustrates percent lung apoptosis following 60

Figure 2. Fluorescent intensity of lung hydrogen peroxide for volume control (VC), pressure control (PC) and pressure regulated volume control (PRVC) mechanical ventilation during hemorrhagic shock. Data are expressed as mean ± SEM (n = 6). *P < 0.05 VC vs PC, PRVC; +P < 0.05 PC vs PRVC.

Figure 3. Percent lung apoptosis for volume control (VC), pressure control (PC) and pressure regulated volume control (PRVC) mechanical ventilation during hemorrhagic shock. Data are expressed as mean ± SEM (n = 6). *P < 0.05 VC vs PC, PRVC; +P < 0.05 PC vs PRVC.
min controlled mechanical ventilation among groups. The percent lung apoptosis for the VC, PC, and PRVC groups were 20.9 ± 0.9, 12.1 ± 0.6, and 4.5 ± 0.1, respectively. Similar to lung H2O2, the percent lung apoptosis among groups were significantly different (P < 0.05) with the VC group being 73% greater than the PC group and 4 times greater than the PRVC group. Apoptosis in the PC group was 2.7 times greater than that in the PRVC group.
4. DISCUSSION
We investigated the effects of three controlled mechanical ventilation modes (VC, PC, and PRVC) on lung injury as measured by lung H2O2 and apoptosis in a rat model of HS. Our data suggest that during HS, lung H2O2 and percent apoptosis were greatest when rats were treated with VC ventilation for 60 min, followed by rats treated with PC ventilation. The extent of lung H2O2 and apoptosis was lowest among rats that were placed on PRVC ventilation, which was comparable to the rats breathing 40% O2 without mechanical ventilation in our previous study [11]. With induced HS, SBP, DBP, and MAP decreased significantly from baseline and remained decreased during controlled mechanical ventilation. No significant differences in hemodynamics and ABVs among the three controlled mechanical ventilation groups throughout the treatment period indicate the degree of HS among these animals was comparable. Peak inspiratory pressures, tidal volume, RR, inspiratory and expiratory ITP among the three controlled mechanical ventilation groups were maintained relatively similar across the treatment period.
Tables 1 and 2 summarize the hemodynamic and ABVs of all animals using the three modes of controlled mechanical ventilation. The blood pressures and heart rates were not different among the various ventilation modes except for three values at 60 min. These three values were related to DBP and MAP which were only slightly higher in the animals receiving PC ventilation. Thus, all animals were hemodynamically similar throughout the various stages of the experiment regardless of the administered mode of mechanical ventilation. The ABVs were comparable among the three groups. This suggests the modes of ventilation did not alter the gas exchange levels. There were also no differences observed in the Hct and Hgb values among the groups. Consequently, it does not appear that there were differences in tissue O2 delivery among the three modes of controlled mechanical ventilation. Thus, the differences in lung H2O2 and apoptosis during the three modes of controlled mechanical ventilation are attributable to other factors.
Ventilator induced lung injury can arise from the lung being directly damaged by the action of mechanical ventilation. It has been observed that this can result in alveolar apoptosis [9,10]. For years, macroscopic injuries associated with the ventilation of patients have been described to produce “barotrauma”. This term often relates to alveolar over distension when high inspiratory pressures are applied [13]. More recently, a newer term called “volutrauma” is used to emphasize lung injury related to alveolar over distension from excessive volume rather than excessive pressure [14]. As shown in Tables 3 and 4, we found no consistent changes between the PIP, tidal volume, or inspiratory and expiratory ITP among the animals administered VC, PC, or PRVC. Thus, our observations of marked significant differences in H2O2 and apoptosis with three modes of controlled mechanical ventilation were not reflected by differences in routinely used respiratory parameters. In addition, pulmonary resistance (cm H2O/mL) was calculated for all three modes at each time period using this formula: (PIP-PEEP)/tidal volume. No significant differences in pulmonary resistance before and after mechanical ventilation were found across the three modes. Also, there were no significant differences in tidal volume per 1 kg of body weight across the three modes.
A possible explanation for the differences in lung H2O2 and apoptosis may be attributable to differences in the mechanics of gas delivery among the three modes of controlled mechanical ventilation. With VC, the ventilator delivers a pre-set tidal volume at a constant flow during a pre-set time and frequency [15]. The goal of PC is to deliver breaths at a constant pre-set pressure with decelerating flow during a pre-set time and frequency. In PRVC, the inspiratory pressure is continuously adjusted for changes in lung compliance, thereby, maintaining the pre-set tidal and minute volume [16,17]. Both PC and PRVC utilize an inspiratory decelerating flow pattern. In PRVC, the pressure is kept constant for the entire pre-set inspiratory time and breaths are given at the pre-set frequency. In our study, we found the least amount of H2O2 production and apoptosis in the animals that received the PRVC during HS. A possible mechanism for reduced cellular lung injury with PRVC may relate to the continuous adaptation of inspiratory pressures to maintain the pre-set tidal and minute volumes. Following HS, MAP and Hgb were greater with PC than VC. This may have, in part, contributed to apoptosis and H2O2 being lower in PC than VC.
Mechanical ventilation can cause inflammatory responses and profound generation of free radicals by inducing mechanical stresses to airways, which can lead to lung injury [4]. Research has demonstrated that high tidal volume and low or zero PEEP appear to cause more VILI [18]. The potential mechanisms of VILI are related to cyclic stretch and shear stress that stimulates various inflammatory responses. Research has shown that controlled mechanical ventilation with decelerating inspiratory flow (PC and PRVC) may improve oxygenation by early filling of alveoli and maintaining alveolar pressure longer. This leads to more homogenous gas distribution and better ventilation and perfusion matching, when compared to constant flow (VC) [19-21]. The decelerating flow pattern may increase carbon dioxide elimination and decrease intrapulmonary shunting, thus limiting the risk for barotrauma [21]. In our study, as shown in Figure 2, we observed that there were significant lower levels of lung H2O2 in the PC and PRVC mechanical ventilation than the VC. Decelerating flow pattern applied in both the PC and PRVC might have attenuated the shear stress on epithelial cells and alveolar cells, as compared to the constant flow pattern in the VC mode. The least amount of H2O2 production was found in the PRVC group. We speculate that changes in H2O2 production in PC were greater than PRVC because of uneven alveolar ventilation. This lack of homogeneous ventilation could lead to small areas of alveolar hypoxia that would increase ROS production. During mechanical ventilation, the PIP of PC was slightly less than PRVC, which resulted in lower tidal volume assuming no differences in lung compliance. This plus greater homogenous alveolar ventilation with PRVC may account for H2O2 and apoptosis being greater in PC.
Production of H2O2 can stimulate apoptotic pathways and can directly or indirectly cause damage to lipids, proteins, and DNA. Le et al. [10] investigated the effect of high tidal volume mechanical ventilation on lung apoptosis and observed an increase in alveolar cell apoptosis. Ventilator induced apoptosis may result from the activation of caspases within the lungs due to alveolar over distension [10], the mitogen-activated protein kinase pathways [22], and selective activation of the intrinsic apoptotic pathway (caspase 9) [23]. As shown in Figure 3, we found that rats treated with VC had the highest amount of lung apoptosis, followed by those on PC. Ventilator induced apoptosis in the PRVC group was the lowest. In our previous study, we observed that lung H2O2 and apoptosis in HS rats in the absence of mechanical ventilation on 40% O2 were 0.5 × 10⁶ ± 0.05 and 2.38 ± 0.40, respectively [11]. The H2O2 production (0.3 × 10⁶ ± 0.05) and percent lung apoptosis (4.5 ± 0.13) in the PRVC group in our current study was not significantly greater. Thus, it appears that mechanical ventilation with PRVC did not affect the degree of lung injury as measured by H2O2 and apoptosis during HS.
There are limitations in the current study. We placed animals on a short time period of mechanical ventilation (60 min), which may prevent us from observing any macroscopic changes or alterations in pulmonary mechanics that could result from longer periods of mechanical ventilation. However, cellular damage was already observed in a short time period, indicating potential clinical significance when treating HS with different modes of controlled mechanical ventilation. In addition, a prolonged HS period could produce more lung injury resulting in decreases in lung compliance. Esophageal smooth muscle activity can result in esophageal pressure not equating to intrapleural pressures. However, this limitation would be expected to apply equally to all three modes of mechanical ventilation. No fluid resuscitation was given to correct HS during mechanical ventilation. This allowed us to examine the effects of controlled mechanical ventilation in the absence of changes in free radicals associated with fluid resuscitation, e.g. reperfusion injury. We recognized that our H2O2 and apoptosis values represented not only lung tissues, but also pulmonary vascular and various blood cells.
5. CONCLUSION
Mechanical ventilation is an important supportive treatment for HS; however it can induce lung injury. We observed that the amount of lung H2O2 and apoptosis during HS was greatest with VC, significantly less with PC, and reduced even further with PRVC. These data suggest that PRVC is the mechanical mode of choice to use during HS treatment, as it causes the least amount of lung damage. The PRVC could significantly reduce the risk of acute lung injury induced by both HS and mechanical ventilation. However, it is not known if the relative differences in lung injury (H2O2 and apoptosis) with these three modes of mechanical ventilation would be the same at lower or higher O2 concentration. Future studies should include examining these three modes of mechanical ventilation over prolonged periods of HS with various drug and fluid resuscitation therapies.
6. ACKNOWLEDGEMENTS
The Uniformed Services University of the Health Sciences (USU), 4301 Jones Bridge Rd., Bethesda, MD 20814-4799 is the awarding (grant number: HU0001-08-1-TS08) and administering office. This research was sponsored by the TriService Nursing Research Program, Uniformed Services University of the Health Sciences; however, the information or content and conclusions do not necessarily represent the official position or policy of, nor should any official endorsement be inferred by, the TriService Nursing Research Program, Uniformed Services University of the Health Sciences, the Department of Defense, or the US Government.
NOTES