Method for Automated Georeferencing and Integrating Printed Maps in GIS for Collecting Addresses ()
1. Introduction
Addresses are an important data for urban applications. About 80% of the information local authorities use have a geographic locations, and most of those are related to addresses [1,2]. It is very important to have an accurate database of addresses. The emergency dispatching applications for example, can not work without such database [3]. Unfortunately, having a reliable data, especially in developing countries, is often a big challenge.
In morocco, some researches took an interest in urban phenomena such as detecting slums [4] or urban heat islands [5], but rare are the researches that discuss this matter. Even those that touched this subject [6] didn’t emphasis on addressing locators schema and approaches to get data from the field. On other hand, an interesting work was realized by Davis and Fonseca [7] on the certainty of locations produced by an address geocoding system, where they present a conceptual schema for addressing database that it is flexible enough to accommodate different contexts, including the Moroccan case. Their work extends Simpson’s and Yu’s work on postal codes to records of any kind [8]. An important matter is still to study: It concerns the method to acquire data, to build a reliable reference database. Traditional methods that involve GPS surveying have a very low quality price ratio. Moreover, using printed maps if not managed carefully, may lead to data loss or low quality. It also presents the big challenge of georeferencing and dependence to base maps and coordinates references.
The objective of this work is to present a method to gather data from the field, based on automation of georeferencing maps of scales that are between 1/500 and 1/2500, achieving accuracy better than 1 m. The case study concerns urban addresses of Casablanca.
2. Material and Methods
2.1. Case Study Area
Casablanca is Morocco’s economic capital. It is also its largest city, with more than 3 million inhabitants with a total area of 1140.54 km2 [4] (Figure 1). It is located on the Atlantic coast, about 100 km south of the administrative capital (Rabat). The Wilaya of Greater Casablanca counts two prefectures (Casablanca and Mohammedia) and two Provinces (Nouceur and Mediouna) for a total of 17 municipalities, 10 urban and seven rural [4].
2.2. Available Data and Procedures
In order to collect 400,000 addresses, representing the majority of addresses locators in Casablanca and Mohammedia prefectures, 3500 maps were generated (Figure 2). Each map represents a sub-zone, and contains necessary data for collecting addresses from the field: routes, routes limits, plots, points of interests, neighbourhoods and sub-zone’s boundaries [9].
Here bellow, Figure 3 shows the project’s operations process flow:
The metropolis is subdivided into sub-zones. Every one of them is printed in A3 format map with the subzone number in the header of the document (Figure 2). Once the work in the field is done, and both geometry and necessary details for the matching are drawn, the
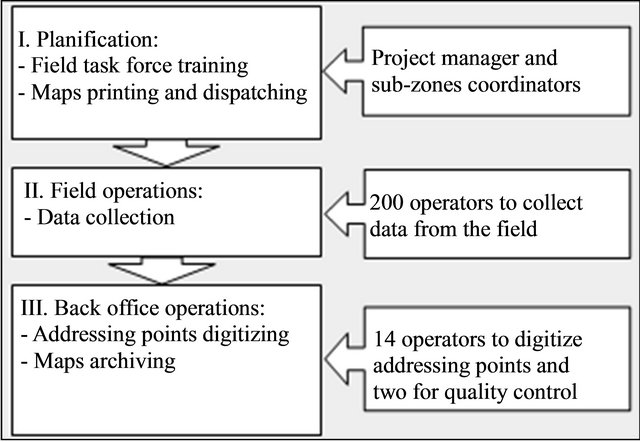
Figure 3. Project’s operations process flow.
maps are returned to the processing task force in the back-office for digitizing. After the quality control operations, the map is finally scanned and archived.
The hard document is the only reference for the quality control and verification of the digitized data. That is why it should be scanned and preserved. It should even be georeferenced to simplify its reuse. This would optimize the operation of digitizing data (Addresses locators in our case) [10].
3. Method of Automated Georeferencing
By georeferencing a raster map we mean to translate, rotate and to scale a digitalized copy of the original map so its (significant) points do align with theirs corresponding points on a referential (vector) map [11].
The operation of georeferencing maps that were generated from our geographical information system is one process among others, of an entire procedure. It starts from the printing and ends with the georeferencing of the digitized maps. In order to optimize the last step, we should rethink the first one.
The georeferencing of scanned maps depends on recognizable reference points on the document and in the geographical information system. But data changes in the system. In our case, base map data and sub-zones changed in many cases compared with the paper maps. The next work flow in (Figure 4) presents the proposed procedure and necessary parameters.
3.1. Printing and Automated Georeferencing Methods
The GIS offers the possibility to insert automatically some references on every printed map. We are using this possibility to generate a code that indicates the coordinates of the fore corners of the map’s frame, to use it for georeferencing. This will enable us to be independent of any possible updates in the database, between the maps’ printing and their use; But also to perform this operation in any other system (Even if it doesn’t have the same data that figures in the map).
In order to optimize the georeferencing code in the maps generated from our GIS, we are considering the Natural Code Area (NAC) alphanumeric codes, developed by Geographic Products Inc. [12]. NAC uses a Base 30 numeral system to encode position. The primary grid for the globe is subdivision of the flattened globe into a 30 by 30 grid. Each grid is referenced by a unique identifier that is described by a base 30 “number”. This means that each grid reference is one a single identifier. This proCess is recursive and quickly converges under 1 m resolution (Table 1).
The previous table shows that six digits NAC ensures a resolution around 5 cm, which is sufficient for our addressing database. For different needs, applications may use lengthier NAC [14].
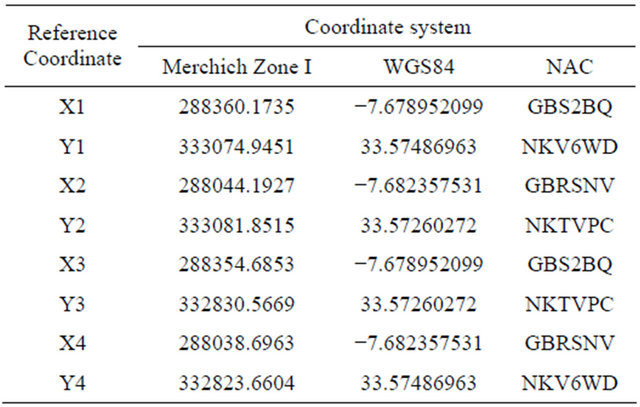
The Georeferencing Code (GC) is the concatenation of NAC(X1), NAC(Y1), NAC(X2), NAC(Y2), NAC(X3), NAC(Y3), NAC(X4) and NAC(Y4) where (X1, Y1), (X2, Y2), (X3, Y3) and (X4, Y4) are the coordinates of the

Figure 4. Procedure for printed maps use.
Table 1. Convergence of the NAC resolutions [13].

map’s frame corners.
Here bellow, Figure 5 shows the GC calculation algorithm:
Table 2 presents parameters for printing and georeferencing sub-zone number 235301:
The corresponding Georeferencing Code is:
GBS2BQNKV6WDGBRSNVNKTVPCGBS2BQNKTVPCGBRSNVNKV6WD.
Figure 6 illustrates the printed sub-zone with the GC in the footer of the map.
The result of georeferencing routine is presented in Figure 7. We consider 10 control points to compare coordinates between printed maps and reference geodatabase. Table 3 shows the results of this comparison. The maximum difference observed between georeferenced map and reference database is 28.4 cm. The correlation coefficient between the two coordinates’ series is 0.99999999998.
3.2. Method Validation: Accuracy Discussion
3.2.1. The Target Accuracy
Our addressing database statistics for Mohammedia town
Table 2. Printing parameters for sub-zone N˚ 235301.
show that 79.57 % of addresses locators are 5 meters far from the nearest different point address. 98.98% of addresses locators are 1 m far from the nearest different address.
We consider 1 m as a reasonable tolerance for our addressing database. This means that any method of data collection should have an accuracy that is sub 1 m.
3.2.2. The GPS Accuracy Discussion
Global Positioning System (GPS) that is a satellite based navigation and surveying system for determination of precise position and time, using radio signals from the satellites, in real time or post-processing mode [16]; Is commonly considered as the best data collection tool from the field. This fact is contestable for two main reasons: cost and accuracy. These two factors are related as shown in Table 4.
Various errors are in GPS system: Orbital errors, Clock errors, Ionospheric errors, Multipath errors, Tropospheric errors, Receiver noise, Relativistic corrections, Dilution of Precision (DOP), etc. [17]. The ionospheric delay is the main problem in achieving millimeter level positioning [18]. These errors bias the receiver user’s position to be ±15 m from the actual coordinates [19].
3.2.3. Printed Maps with Georeferincing Code Method Accuracy
In our method, the accuracy of digitized data depends on the scale of the printed map, the printer resolution, the Scanner resolution, the georeferencing precision and the graphic error (of marks on the map and mouse cursor on the screen).
Scanning resolution is normally expressed as pixels-per-inch (ppi) or dots-per-inch (dpi). Printing resolution is also measured in dots-per-inch and depending on the type of printer the dpi can range anywhere from 72 dpi to 3000 dpi [20].
Supposing that we use the same resolution “R” for printing and scanning the map, the final document resolution is R (expressed in dpi) and the map’s scale is 1/S, the Devices’ Error (DEr) is then:
 (1)
(1)
The graphic error is the difference between the marked point on a map with a pencil, and its actual position [21]. Its average value depends on the operator. In general, it can be estimated to 0.1 mm.
With the map scale equals to 1/S. the Graphic Error (GpEr) is:
 (2)
(2)
Using the affine polynomial transformation based on the fore points of control as presented in Figure 6, the accuracy of georeferencing depends on the Graphic Error

Figure 6. Printed “Sub-zone” with a generated georeferencing code.

Figure 7. Georeferenced raster with “georeferencing code method”.
Table 3. Comparative table between calculated and reference coordinates of control points.

Table 4. GPS receiver classifications*.

*Adapted from work by Sullivan and Ehsani. Ohio State University; and work by Calven and Glen. The University of Georgia (may 2009). #How much the reported position varies while the unit is stationary.
and Database Precision (DPr) (Our database precision for instance is 0.01 m). The Georeferencing Error (GfEr) is:
 (3)
(3)
The Overall Accuracy (OAcc) of digitized points based on our method is:
 (4)
(4)
From Equations (1), Equations (2), Equations (3) and Equations (4) we conclude:
 (5)
(5)
where R is printing & scanning resolution, 1/S is the map scale and DPr is the database precision.
The last formula shows that the preponderant parameter in the accuracy of our method is the map’s scale. In our case, we have a database precision of 0.01 m, devices’ resolution of 300 dpi and a scale that is between 1/500 and 1/2500. Our overall accuracy is then between 20 cm and 1 m.
4. Conclusion and Perspectives
This paper described the development of a method of automated georeferencing and integrating printed maps in a GIS for collecting addresses from the field. Through this study, we showed limitations of traditional methods based on GPS, especially there limited extent, high cost and varying accuracy (5 cm to 15 m). We introduced the notion of Georeferencing Code, based on the National Area Code (NAC). A method that guarantees accuracy better than 1 m for maps scales under 1/2500. Georeferencing time is reduced from 5 min to less that a minute per map. It also guarantees georeferecing independently of database’s content modification.
Even if the method we presented gives an alternative solution that is more accurate and costs less. It still remains limited. The process includes human intervention to perform processings that can be fully automated.
This research may provide a basis for more advanced work on raster maps georeferencing automation and also data collection from the field. Standardizing the use of bi-dimensional barecodes (QR code for example) to store Georeferencing Code and necessary metadata on every printed map can be an interesting application.