Chemical and Geological Control on Surface Water within the Shade River Watershed in Southeastern Ohio ()
1. Introduction
Stream water and streambed sediment chemistry are continuously affected by the activities of man. Most of the water bodies in Ohio have been affected by natural and human factor that affects the physical, chemical, and biological quality of surface and groundwater [1]. Some of the natural processes include geology, soil, ecology, climate and physiography [1] and the human factors or activities include agriculture, urbanization, mining, and road construction, which have created instability in the ecosystems [2].
Agricultural activities have resulted in elevated concentrations of nutrients, sediment loads, and other nonpoint sources in streams [3,4]. During storm water runoffs, most of the nutrients are transported in soils, and surface water. These nutrients are bio-accumulated in wetlands [5], sequester in soils [6-8] and incorporated in biomass [9] and streams or lakes. Excessive amount of the nutrients reduces the concentration of dissolved oxygen (DO) in surface water, leading to eutrophication [10- 14], and organic-rich sediments, which can directly or indirectly affect and alter the ecology of aquatic systems [15]. Low DO in streams can stress aquatic organisms, and this can lead to a high mortality rate or low diversity [16,17].
The second factor affecting stream water quality in Ohio is urbanization. Currently, urbanization is second to agriculture as the main cause of stream impairment [18]. Due to population growth and urbanization, land surface are paved into impervious surfaces preventing infiltration of precipitation into the subsurface. This has created high erosion rates, large sediment loadings, and high flood frequencies. The transportation of sediments and high erosion rates have changed the morphology and hydrology of most streams [18,19], thereby affecting the activities of benthic and aquatic organisms. The behaviors of aquatic invertebrates and macroinvertebrates have been examined extensively in relation to pollution [20-23].
Coal mining is the third factor that affects water quality through environmental pollution and land degradation problems such as mine drainage and mine subsidence [24-26]. Mine discharge has resulted in high concentrations of acidity, iron, manganese, aluminum, and sulfate [27-29] in surface water bodies. The concentration of these elements can have detrimental effect on fish and macroinvertebrate communities [30]. Studies on fish and macroinvertebrate environments have revealed that acid mine drainage has affected fish and macroinvertebrate communities [31], isolating populations in healthy portions of the streams.
This manuscript focuses on a study conducted to examine the surface water chemistry of the Shade River Watershed (SRW). The watershed is associated with high sedimentation rate, erosion and flooding [32,33]. The objectives of this study are to: 1) determine the causes of impairment in the streams; 2) study the geological factors controlling stream water chemistry; and 3) understand the spatial distributions of the stream water chemistry, and mineral stability of the dominant ions within the SRW.
This study is part of the U.S. Environmental Protection Agency (EPA) Science to Achieve Results (STAR) project that focuses on land use, biology, and water quality within the Western Allegheny Plateau in Ohio. The purpose of the project is to classify streams according to their chemical, hydrological, geomorphologic, and biological gradient conditions. These conditions are very important for the sustainability of the aquatic environment.
Any variation in these conditions can have adverse effects on the water quality, physicochemical and biological components of the streams. Therefore, it is important to monitor the chemical properties of both the streambed sediments and the stream water, and compare them to the biological indicators [2].
2. Material and Methods
2.1. Study Area
This study was conducted within the SRW, a sub-watershed of the Ohio River within the Western Allegheny Plateau (WAP) in southeastern Ohio. SRW falls on the boundary between the southern part of Athens County and the northeastern part of the Meigs County (Figure 1). The Shade River drains an area of 570 square Kilometers and it flows into the Ohio River in the southeast. SRW is drained by the eastern, middle, and western branches of the Shade River [32,33], but this study is restricted to the western and middle branches of the river. These two branches have not been extensively sampled prior to this study.
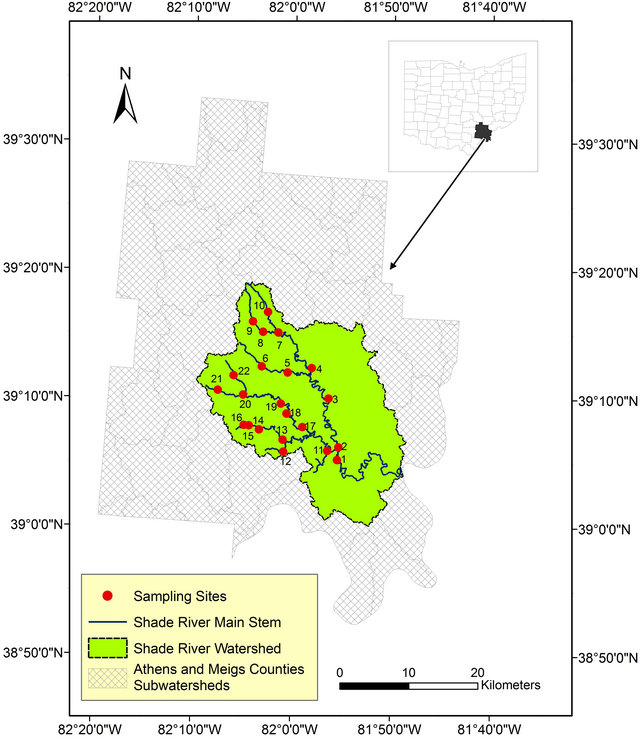
Figure 1. Map of the study area showing the sampled sites within Athens and Meigs Counties.
s According to Childress and Jones [33], part of the western branch of the Shade River was surface mined for coal during the mid-1940s to the early-1960s. This resulted in elevation of sediment loadings, and severe surface water and soil quality deterioration. Several attempts were made at that time to reclaim some of the mined and abandoned mined areas, but the efforts yielded no results. However, in 1978, new reclamation techniques were used to improve the sedimentation and water quality problems due to the passage of the Federal Surface Mining Control and Reclamation Act of 1977. Currently lime and other types of alkaline are used as buffers in curbing the water quality issues.
SRW is made up of rocks of the Conemaugh (western part of Meigs County), Dunkard, and Monongahela Formations (central part of Meigs County) of the Pennsylvanian [34]. These formations consist of sandstone, siltstone, limestone, shale and coal with some minor amount of conglomerate. The area is characterized by soils of the Gilpin-Upshur-Lowell-Guernsey association [35]. This soil association is moderately to well-drained soils that formed in colluvium and/or residuum from shale, siltstone, limestone, and some sandstone.
2.2. Sample Collection
Field sampling for this project was done in 2006 for grab stream water, as well as measured field parameters. Twenty-two referenced sites were selected and sampled based on a Geographic Information System (GIS) data generated according to USEPA criteria (Figure 1) [36].
The field parameters, which included temperature, dissolved oxygen (DO), electrical conductivity (EC), total dissolved solids (TDS), pH, acidity, and alkalinity, were measured at the time of water sample collection (Table 1). Temperature and pH were measured using the YSI Model 60 Handheld pH/temperature meter; EC and TDS were measured using CO150 model HACH conductivity meter; DO was measured using the YSI Model 55D Handheld DO meter; and alkalinity and acidity were measured using bromcresol green-methyl red and phenolphthalein indicators, and sodium hydroxide and sulfuric acid for acidity and alkalinity titrations, respectively.
Table 1. Physical and field parameters measured in the Shade River Watershed.

TDS and DO were measured in mg/L; pH (unitless); EC (μS/cm); and Temperature (T) in ˚C. Kg. Cr. represents Kingsburg Creek; and Sh. Rr. represents Shade River.
Filtered and unfiltered grab water samples were collected midstream for cations and anions analyses. The filtered samples were passed through a 0.45 μm millipore filter membrane using the vacuum filtration method and placed in a sterilized 250 milliliter (mL) high density polypropylene sample bottles for chemical analyses. The samples for cation analyses were preserved with diluted 2% nitric acid, while those for anion analyses were unpreserved. Samples for total phosphate analysis were preserved with 20% by volume sulfuric acid (H2SO4) and kept in 125 mL high density polypropylene sample bottles. The preservation of the samples was done to prevent the formation of metal complexes in the case of the cations and phosphate complexes in the case of phosphate. The samples were stored in a cooler filled with ice prior to standard analytical procedure. The cations were analyzed using Varian 720-ES Inductively Coupled Plasma Optical Emission Spectroscopy (ICPOES); expect Na, which was analyzed using the Shimadzu AA-6800 Atomic Absorption Spectrophotometer (AAS). The other cations analyzed included Na, Ca, Mg, Fe, Mn, and Al.
2.3. Sample Analysis
The anions were analyzed using HACH DR/2010 Portable Spectrophotometer [37]. The anions analyzed include Nitrate-N (NO3-N), sulfate (SO4), bicarbonate (HCO3), and total phosphate (PO4, Table 2). Nitrate-N concentration was determined using USEPA approved method 8192 called the Cadmium Reduction Method. Sulfate concentration was determined using USEPA approved method 8051 called the Turbidimetric or SulfaVer4 method. Total phosphate concentration was determined using USEPA approved method 8180 called Hydrolyzable Digestion and the PhosVer3 or Ascorbic Acid Method. Bicarbonate concentrations were calculated from the measured alkalinity values obtained.
2.4. Statistical Analysis
Correlations between the chemical species are shown in Table 3. At the 95% confidence level (r = 0.05) considering 22 number of samples, the calculated t-critical and r-critical value for the test of significance of the correlation coefficients are 2.08 and 0.42 respectively. It can be observed in Table 3 that there is a positive and significant correlation between Mg and Ca (r = 0.74). Na correlates significantly with Ca (r = 0.60), Mg (r = 0.58), and Fe (r = −0.46). These correlations indicate a common rock source or similar chemical processes for the forma
Table 2. Concentration of some chemical species measured in the filtered water samples.
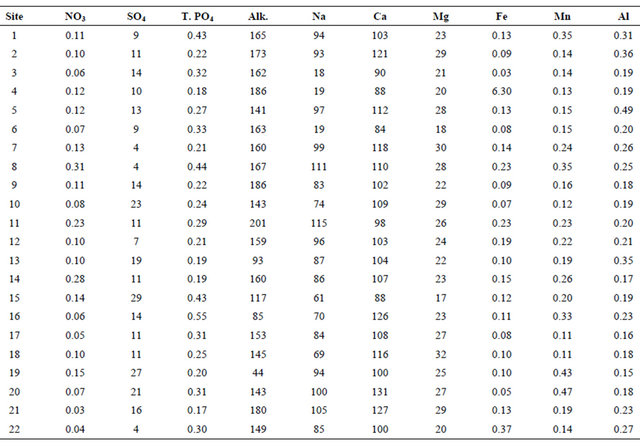
T.PO4 and Alk represent Total Phosphate and Alkalinity, respectively. All the elements are in mg/L except Alkalinity (Alk.), which is measured in mg CaCO3/L.
Table 3. Correlation matrices for waters and field parameters within the Shade River Watershed. The highlighted values are statistically significant at 95% confidence level (|r| > 0.42; n =22 and ρ = 0.05), as given by the test of significance of the correlation [38].

tion of the aforementioned cations. The formation of the cations could be related to the weathering of carbonates or silicates. TDS correlates with EC (r = 0.98), as well as Mg (r = 0.45). This indicates that Mg is influential in the TDS concentration. pH correlates significantly with TDS (r = 0.50), and EC (r = 0.51) but correlates negatively with Na (r = −0.48), and Mn (r = −0.64) as shown in Table 3. The inverse correlation between pH and Mn indicates that as pH increases, the concentration of Mn reduces or vice-versa. Increase in pH in an oxidizing condition results in the precipitation of Mn [39] and manganese hydroxide [40] at alkaline pH. Sorption reduces the concentration of Mn in solution.
3. Results and Discussion
3.1. Water Chemistry
The analyzed ions were used to determine the process controlling the water chemistry in the SRW based on the Gibbs [41] diagram. This diagram is based on three dominant processes: evaporation or crystallization, rock dominance or weathering, and precipitation. The graph of TDS versus  for the 22 data points indicates that the surface water within the watershed is located within the rock weathering portion of the boomerang-shaped graph (Figure 2).
3.2. Field Parameter and Water Chemistry Analysis
Stream water concentration within the SRW fell within the USEPA criteria for the protection of aquatic life except some few ions and field parameters that had higher values.
pH, TDS, EC, and alkalinity fell within the USEPA criteria except DO (Table 4). All of the sites had DO concentrations equal or greater than 4.0 mg/L, except Sites 12 and 14 that had values below the USEPA criterion of 4.0 mg/L [42] (Figure 3, Table 4). Iron concentration was within the USEPA criteria except site 4, which had a concentration of 6.30 mg/L (Table 4). The main causes of impairment within the SRW were total phosphate and manganese. The concentrations of these elements were beyond the USEPA criteria for the protection of aquatic life. The concentration of the total phosphate ranged from 0.2 to 0.5 mg/L (Figure 4, Table 4), which exceeded the USEPA criterion of 0.05 mg/L. Manganese on the other hand is associated with mining.
Manganese concentration ranged from 0.11 to 0.47 mg/L, which exceeded the USEPA criterion of 0.10 mg/L. Manganese concentration within sampled sites in the western branch was higher than those of the middle branch. The measured average concentration of manganese was 0.22 mg/L, which exceeded the USEPA criterion. Aluminum concentration ranged from 0.15 to 0.49 mg/L, with a mean value of 0.23 mg/L. Most of the areas associated with mining have high concentration of aluminum beyond the USEPA criteria of 0.2 mg/L. The high concentration of the aluminum could be due to acid mine drainage sources.
SRW had high concentration of the major cations (Ca, Mg, and Na), which could be associated with the weathering of carbonate or silicate minerals. The high concentrations of these elements depict the local geology of the
Table 4. Descriptive statistics for the measured ions (filtered samples) and the field parameters with their respective criterion for aquatic life.

All the elements are in mg/L except pH (unitless), EC (μS/cm), and Alkalinity (Alk.), which is measured in mg CaCO3/L. *Most of the USEPA criteria values were obtained from [42].

Figure 2. Dominant process controlling water chemistry within SRW [After 16].
area. The concentrations of the major cations were higher in the western branches as compared to the middle branches. The high concentrations of these cations could be attributed to the high rate of weathering, acidic nature of the soil, erosion of host rocks to the area, and/or from the remnant of the mining activities.
3.3. Composition of the Streamwater Samples
The composition of the surface water within the watershed was determined using ternary diagrams (Figures 5(a) and (b)). The diagrams indicate that the predominant cation in the waters is calcium (Ca2+) while the predominant anion is bicarbonate (HCO3).
3.4. Mineral Stability Phase
The SRW rocks contain carbonates consisting of calcite and dolomite. The weathering of carbonates, which depends on carbon dioxide and water, results in the formation of more calcium and bicarbonates ions. The equation for the weathering of carbonate is represented by:
 (1)
(1)
The equilibrium constant for calcite in Equation (1) is represented by:
 (2)
(2)
where  and
and  denote the activities of calcium and bicarbonate ions respectively (normally expressed in moles per liter of H2O), while
  is the partial pressure of carbon dioxide (10−3.5 atm at 25˚C). A plot of the logarithms of
  and
and  shows that the surface water within the SRW is supersaturated with

Figure 3. Spatial distribution of dissolved oxygen concentration in SRW.
respect to calcite (Figure 6).
Dolomite is formed when calcite dissolves in the presence of magnesium ions (Equation (3)).
 (3)
(3)
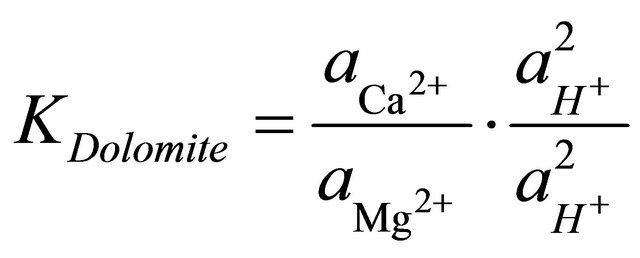
To determine the stability field of the calcite within the area, the equilibrium reaction for the formation of dolomite was multiplied by the ratio of the square of the activities of the hydrogen ions to square of the activities of the hydrogen ions.
 (4)
(4)
where  and
and  are the activities of calcium and magnesium ions respectively, while KDolomite is the equilibrium constant for the formation of dolomite (100.2 at 25˚C). The stability fields for both dolomite and calcite for the waters in SRW was demonstrated by a line plot of
  versus
 , as shown in Figure 7. The figure showed that the surface water in SRW fell within the stability field of calcite.
3.5. Mining Effect on Water Chemistry
The concentration of surface water collected near mined and reclaimed sites (Figure 8) show significant increase in the concentration of Al, Mn, and SO4. These elements are associated with the problems of AMD. Iron, apart one site shows considerable reduction in the concentration due to the effect of lime used as a buffer in reducing the effect of AMD. The buffer effect of the lime and carbonates used can facilitate the precipitation of manganese hydroxide at alkaline pH under oxidizing condition [40].
4. Conclusions
Investigating the chemistry of surface water obtained

Figure 4. Spatial distribution of total phosphate concentration in SRW.


Figure 5. Ternary diagrams for the concentrations (milliequivalence in %) of the dominant ions in the SRW waters.
from the Shade River Watershed has giving an insight to the impact of mining and other land use effect on water quality. Analyses of the various ions compared to the USEPA criteria for the protection of aquatic life has indicated that total phosphorus, manganese, and iron are the most impairing ions in the surface water. The water within the watershed is supersaturated with calcite and it is within the calcite’s stability field.
The high concentrations of some of the major ions depict the local geology and the anthropogenic influence on

Figure 6. Phase diagram for the saturation field of calcite for surface water within the SRW.
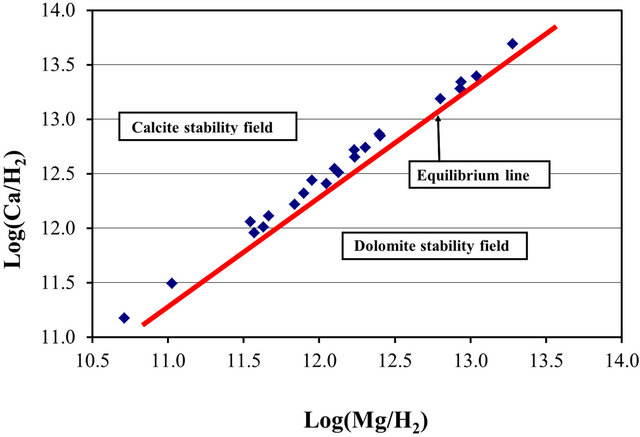
Figure 7. Stability field of calcite and dolomite for surface water within the SRW.

Figure 8. Map showing the mined and reclaimed sites in SRW.
the watershed. Eutrophication is evident at some of the sites due to the high concentration of the total phosphorus from nasogical Sciences’ Alumni Grant. The authors would like to acknowledge Mr. Kwarteng Amaning (formerly of Ohio University) for finishing Phase 1 of the project, and all the reviewers of this paper.