Preliminary Geophysical Investigation to Delineate the Groundwater Conductive Zones in the Coastal Region of Akwa Ibom State, Southern Nigeria, around the Gulf of Guinea ()
1. Introduction
One of the major challenges faced by the communities within the coastal regions of any nation is the encroachment of seawater into the coastal aquifers due partly to excessive abstraction of groundwater in the coastal area. Salinity of water bearing units may also be due to infiltration of polluted water into the pervious and semi pervious geological formations that host the groundwater [1-4]. Groundwater sustains the flow of coastal streams and rivers and is a source of fresh water to coastal ponds, wetlands and other coastal ecosystem.
In the study area, when water is pumped in some boreholes, it is found to be hard, oily and rusty if allowed to stay in a container for sometimes. This observation provoked the decision to embark on this study to see the lithologic arrangements of water bearing formation and their depth of burial. The observation is viewed as a result of influx of conductive water from conductive sand into the borehole after some period of pumping or influx of ferruginized and saline water either from the river or permeable layer of paleowater aquifer into the over pumped borehole screen surrounding. This problem which is natural can be carefully mitigated by locating the screen in water bearing units away from the scientifically screened layer of conductive or ferruginized sandy layer. This layer can be identified through geophysical investigation applying electrical or electromagnetic method [5,6]. Generally, since conductive layers are interwoven with non conductive and pervious layers, it is believed that the recharge zones located at topographically high region can be one of the possible sources of the conductive water collected in impervious or semi-impervious layers within the subsurface. Hence, borehole screens stationed in the conductive aquifer will continue to yield water that is conductive.
2. Location and Geology
The study area cuts across Eastern Obolo, Onna, Eket and Ibeno Local Government Areas (Figure 1(a)) within the coastal region of Akwa Ibom State (Figure 1(b)).
The area falls within longitudes 7.301 to 8.201E and latitudes 4.301 to 5.301N in Nigeria (Figure 1(c)) around the Gulf of Guinea. The area has over 200 mm of rainfall per annum. Mean annual potential evaporation is about 4.6 mm/day and relative humidity is in the range of 60% to 90% [7]. The area is generally flat and lies within the beach dunes and large valleys. It is characterized by mangrove swamps, tidal creeks and brackish lagoons. The area is subjected to constant inundation by saline and brackish water. Geologically, the study area has major lithologic formations which include the Miocene Akata Formation (shales, intercalated sands and silstone), Miocene Pliocene Agbada Formation (sands and sandstones, intercalated with shales) and the Pliocene Benin Formation (coarse-grained, gravelly sands with minor intercalation of clays and shales). The middle and the upper sand units [7] of the Benin Formation form the major aquiferous units in the area. The part of the Tertiary Niger Delta in which the Study area falls is a large arcuate basin of wave-dominated type. It is characterized with little or no igneous intrusion and insignificant outward evidence of plate tectonics. The subsurface lithologic and geologic conditions are symptomatic of the marine depositional environments within the study area. This depositional pattern gives rise to the various rock units which are fresh at some depths and conductive at some other depths.
3. Material and Method
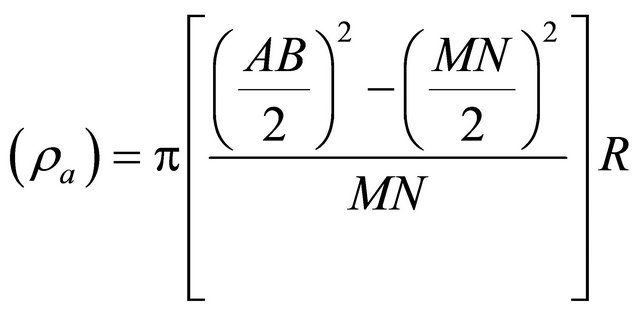
The geophysical screening of the subsurface that led to the discrimination of the lithologic units was performed using the Vertical electrical sounding (VES) method employing the Schlumberger electrode configuration (Figure 2) in three profiles (Figure 1(a)) with average distance of 100 m between VES points [8-12]. The minimum and maximum potential and current electrode separations were 0.5, 50 m (i.e. 0.25 - 25.00 m of half of MN) and 2.00 m, 1000 m (i.e. 1.00 - 500 m of half of

Figure 1. Location maps showing (a) Study area and VES transects; (b) Study area in Akwa Ibom State and (c) Location of Akwa Ibom State in Nigeria.

Figure 2. The Schlumberger electrode configuration used in the study area.
AB) respectively. With the aid of ABEM Terrameter SAS 4000 and its accessories, the apparent resistivity (ρa) was measured in twelve locations using Equation (1)
 (1)
(1)
The equation is simplified as in Equation (2)
 (2)
(2)
where the geometric factor
 ;
;
AB and MN are the current and potential electrode separations respectively and R is the measured resistance. This was done by measuring the earth’s resistance through the effect of injected current sent into the ground. The measured R was multiplied by the geometric factor k, determined by the electrode configuration. The coordinates of the locations were taken using the Global Positioning System (GPS). The processing of apparent resistivity values was done using Resist Software. The software employs the principle of inversion with the help of a well-known Resistivity Transform. The backward different formula was used for the analysis. This led to the determination of the model representative curves in Figures 3(a)-(e). The represented curves shown in the figures were chosen on the basis proximity to borehole locations. From the curves, the water table (saturated top layer), depth, thickness and resistivity were determined [13,14-16].The depth, thickness and resistivity values of each layer were predetermined by the software.
4. Results and Discussion
The determined water tables from VES interpretation were used to predict the direction of flow shown in Figure 4. This shows on the average that the northern zone is topographically high while the southern region is topographically low [8]. The establishment of the inequality in the water table suggests that groundwater flows from the north (high hydraulic head) to the south (low hydraulic level). This implies that the northern zone is the recharge zone while the southern region is the sink. With this infiltration by hydraulic connection, the source and sink of pollutants has elevated the concentration of fluid conductivity in the impervious and semi-impervious aquifers around the Gulf of Guinea [17,18].
Figures 5(a)-(c) show the geological provinces of the three transects with four VES points in each. The geosections show the different lithologic units from top to bottom in each of the profiles. Although the determined units which were constrained by logged borehole are somewhat similar, the depths of burial and the thicknesses of distribution in the subsurface differ from one transect to another.
Figure 5(b) represents the geosection drawn along the profile of VES1 Iko Town to VES4 (Onna) at the western part of the study area. The gosection of Figure 5(a) shows from top to bottom lateritic top soil with average thickness and depth of 19.5 m; conductive sandy layer with average depth and thickness of 70.4 m and 51.3 m respectively. Fine sand has average depth and thickness of 115.1 m and 44.2 m respectively. The fine sand is underlain with coarse sand which shows infinite depth within the maximum current electrode separations. The description of these lithologic units was aided by the borehole near VES2.
At the transect covering VES5 (Ikot Akpatek) to VES 8 (Effoi) at the northern part of the study area, the geosection in Figure 5(b) was drawn. The geosection shows four different lithologic units from top to bottom. The top soil is lateritic sand with average depth and thickness of 14.1 m. Underlying this layer is the gravelly sand of average depth and thickness of 60.3 m and 46.2 m respectively. Below the gravelly sand is a thick layer of conductive sand whose average depth and thickness are 167.6 m and 107.2 m respectively. At VES5, this layer is more developed up to a depth of 210 m. However, at VES6, the conductive layer is less than 150 m deep. Along the transect, the layer deepens gradually again up to 175 m at VES8. The infinitely thick layer of coarse sand whose thickness and depth could not be determined within the maximum current electrode separation lies below the conductive layer. The transect at the eastern part covers VES9 (Abat) to VES12 (QIC School, Ibeno). The topmost layer is lateritic soil with an average depth and thickness of 17.2 m. This layer is immediately underlain with gravelly sand of average depth and thickness of 42.2 m and 25.2 m respectively. Just below this layer lies a thick layer of coarse sand with average depth and thickness of 102.2 m and 59.6 m respectively. This layer deepens most at VES10 and VES11 and seems to thin out at VES12 and is underlain by an infinite layer of conductive sand whose depth and thickness could not be determined within the maximum current electrode separation used in this work. In brief, the ranges of resistivities of layers for the different transects can be obtained from Table 1. These ranges are significant in determining whether a layer is conductive (saline) or not.

Figure 4. Grid vector map showing groundwater flow in the study area.
 (a)
(a)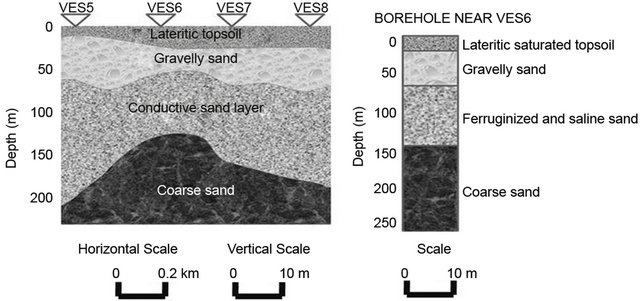 (b)
(b) (c)
(c)
Figure 5. (a) Western geosection along VES1-4 and the logged borehole near VES2; (b) Northern geosection along VES5-8 and the logged borehole near VES6; (c) Eastern geosection along VES9-12 and the logged borehole near VE10.
Table 1. Summary of location and geoelectric parameters for the three transects.

5. Conclusions
In summary, the establishment of the flow direction can be used in contamination study. For the transect at the western part, saline and ferruginized water can be avoided by locating the screen of a borehole in the fine sand layer (75 m depth on the average) or in the coarse sand (above 100 m deep). In transect at the northern part, the saline water layer is well mapped out. The decision to avoid this layer is predicated on the location. On the average, borehole depth should be located from 220 m deep in order to get water that is devoid of contamination of this layer. Again on transect at the eastern part, the saline and ferruginized layer is deeply seated and good quality water can be obtained from 40 - 75 m deep. However, over pumping can cause intrusion of conductive water from the depth range of 88.5 m (VES12) to 116.2 m (VES11) into the borehole located in the coarse sand.
With this geophysical method, saline and ferruginized layers are clearly spelt out for water resources to be assessed with caution. The method is thus benign, noninvasive and friendly to the environment [19,20] and so it is recommended that wildcat drilling should be discouraged in order to avoid locating borehole depth at the conductive layers.
NOTES